. 2017 Jan 25;45(2):749-761.
doi: 10.1093/nar/gkw1125. Epub 2016 Nov 29.

Protein dynamics of human RPA and RAD51 on ssDNA during assembly and disassembly of the RAD51 filament

Affiliations

Protein dynamics of human RPA and RAD51 on ssDNA during assembly and disassembly of the RAD51 filament

Chu Jian Ma et al. Nucleic Acids Res. .

Abstract

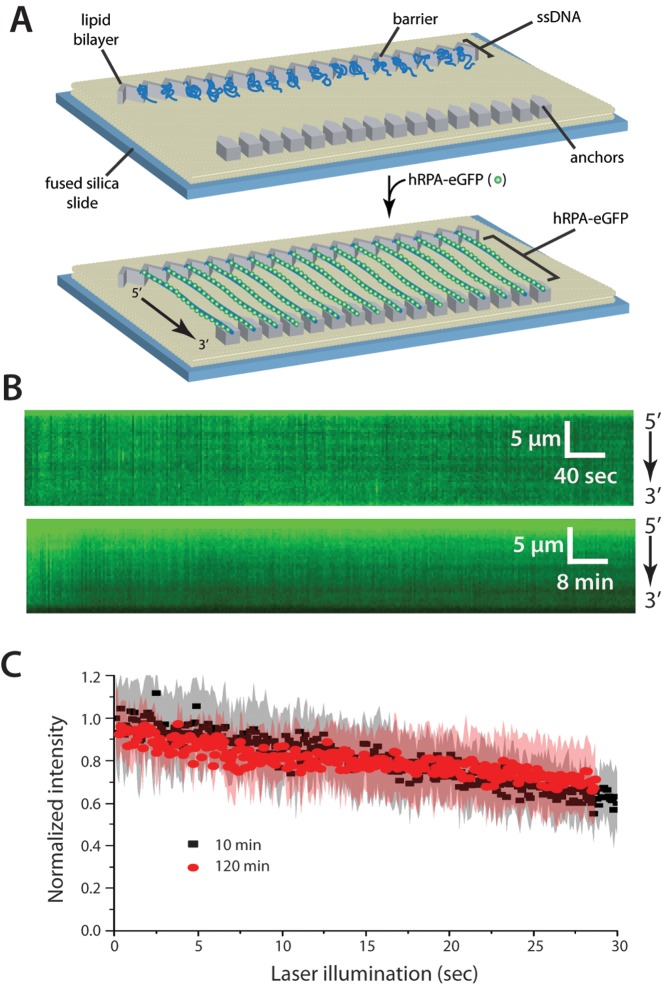
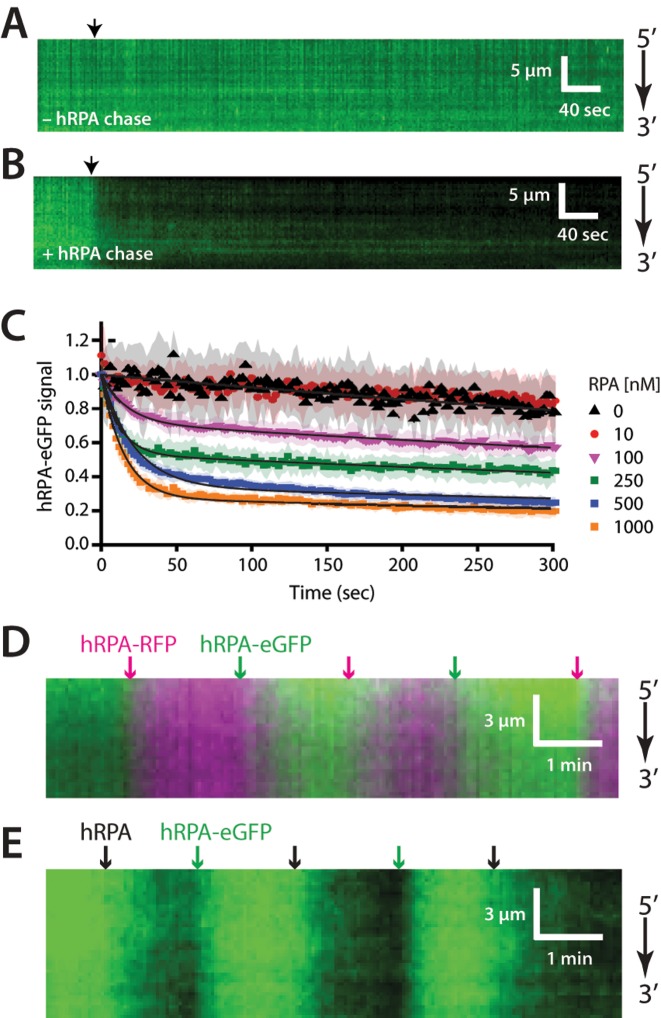
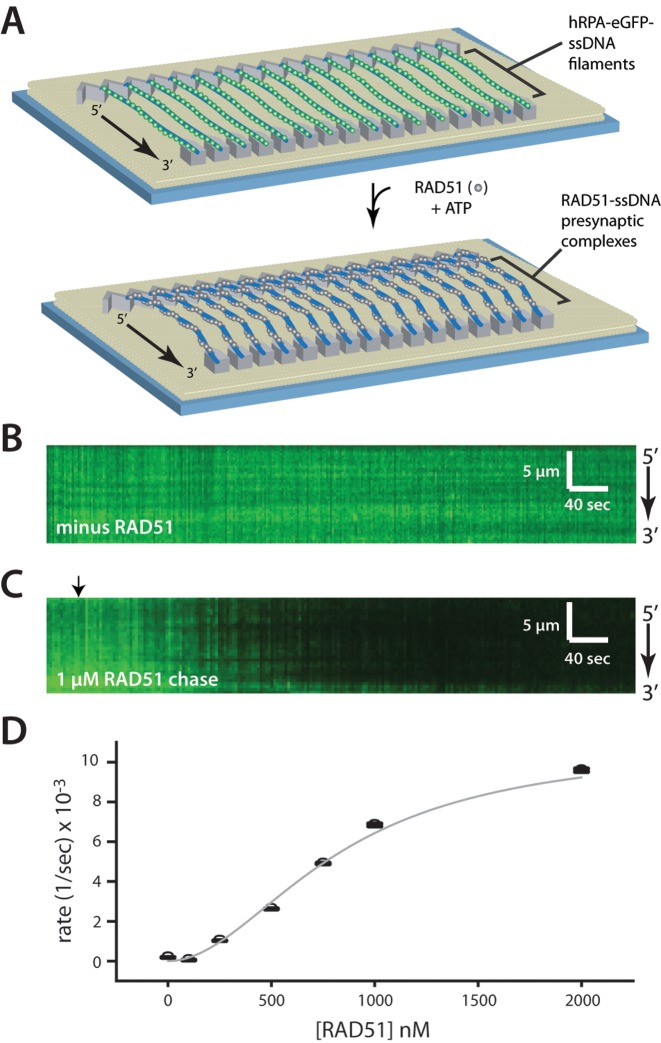
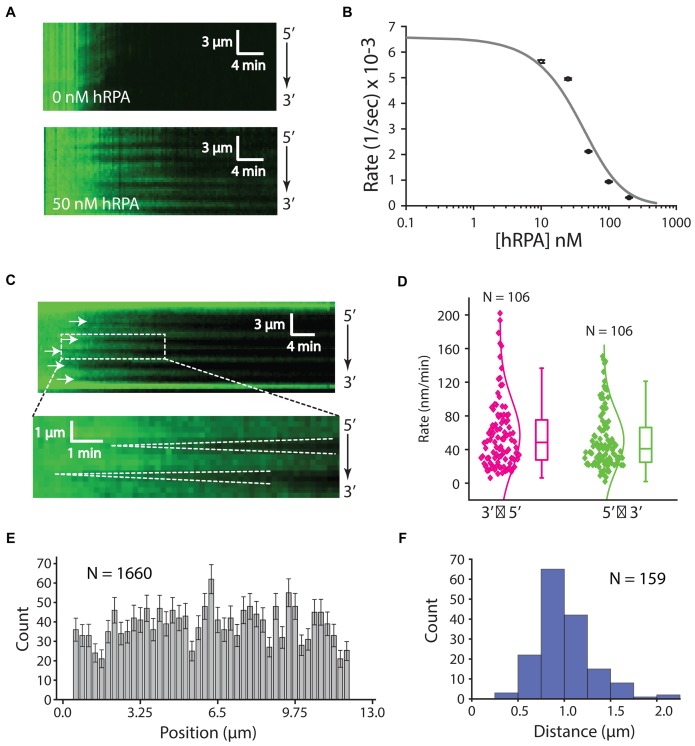
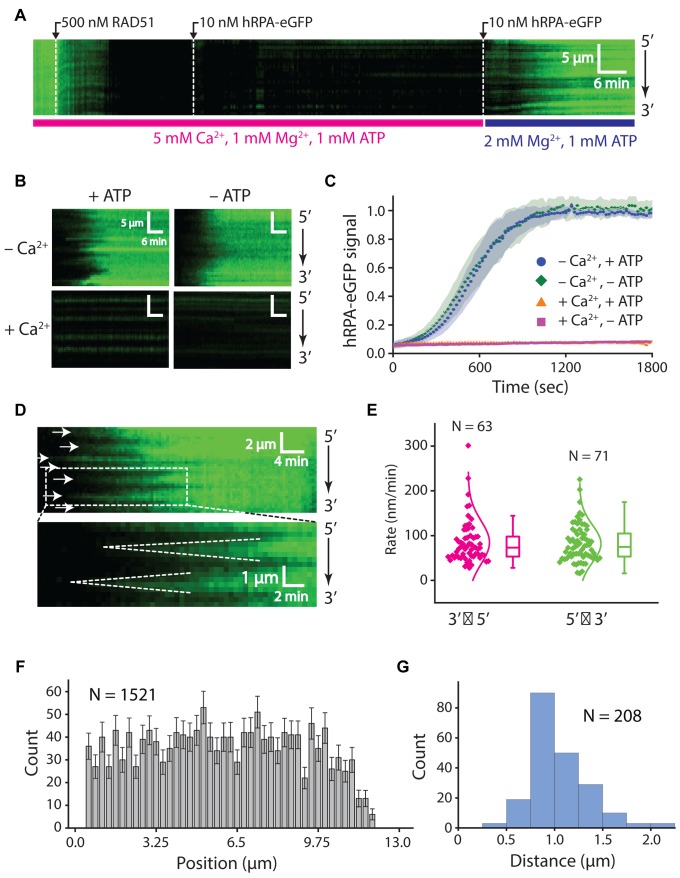
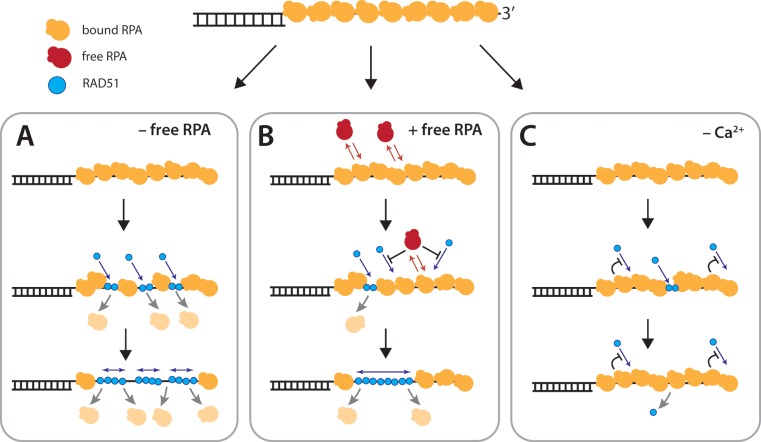
Homologous recombination (HR) is a crucial pathway for double-stranded DNA break (DSB) repair. During the early stages of HR, the newly generated DSB ends are processed to yield long single-stranded DNA (ssDNA) overhangs, which are quickly bound by replication protein A (RPA). RPA is then replaced by the DNA recombinase Rad51, which forms extended helical filaments on the ssDNA. The resulting nucleoprotein filament, known as the presynaptic complex, is responsible for pairing the ssDNA with homologous double-stranded DNA (dsDNA), which serves as the template to guide DSB repair. Here, we use single-molecule imaging to visualize the interplay between human RPA (hRPA) and human RAD51 during presynaptic complex assembly and disassembly. We demonstrate that ssDNA-bound hRPA can undergo facilitated exchange, enabling hRPA to undergo rapid exchange between free and ssDNA-bound states only when free hRPA is present in solution. Our results also indicate that the presence of free hRPA inhibits RAD51 filament nucleation, but has a lesser impact upon filament elongation. This finding suggests that hRPA exerts important regulatory influence over RAD51 and may in turn affect the properties of the assembled RAD51 filament. These experiments provide an important basis for further investigations into the regulation of human presynaptic complex assembly.


Figures

Figure 1.
Figure 1.
Human RPA can bind tightly to ssDNA. (A) Schematic of the double-tethered hRPA-ssDNA curtain, showing the nanofabricated patterns on the surface of a fused silica microscope slide. The ssDNA molecules are anchored to the lipid bilayer in defined a 5′→3′ orientation through a biotin-streptavidin-biotin linkage and aligned at the zig-zag shaped chromium (Cr) barriers. The ssDNA is labeled and extended by injection of hRPA-eGFP and downstream ends are anchored through non-specific adsorption of the RPA-ssDNA to the exposed Cr pedestals. (B) Kymographs showing single ssDNA molecules bound by hRPA-eGFP in the absence of free RPA. Images (100-msec exposure) where collected at 2-s intervals for 10 min (upper panel) or at 24-s intervals for 2 h (lower panel), as described (26). (C) Loss of RPA-eGFP signal over time is due to photobleaching. Collecting images with longer shutter time (24 s) led to the same rate of signal decrease when corrected for total illumination time. Each curve represents normalized averages over time calculated from at least 14 individual ssDNA molecules, and the shaded regions represent standard deviation.
Figure 2.
Figure 2.
Facilitated exchange of ssDNA-bound hRPA. (A) Representative kymograph showing hRPA stably bound to ssDNA in the absence of free RPA. Arrowhead indicates injection of HR buffer alone. (B) Kymograph showing dissociation of ssDNA-bound hRPA-eGFP upon injection of unlabeled wild-type hRPA (1 μM), as shown by the black arrowhead. (C) Normalized RPA-eGFP signal intensity versus time after injection of different concentrations of unlabeled, wild-type hRPA. Each curve represents normalized averages over time calculated from at least 18 different ssDNA molecules, and shaded regions represent standard deviation. Loss of RPA-eGFP signal over time is due to combination of photobleaching (e.g. at 0 nM and 10 nM free hRPA) and hRPA-eGFP turnover in the presence of 100–1000 nM free hRPA. Accordingly, the curves were fit to double exponential decays (solid black lines), with one of the rates corresponding to photobleaching. (D) Two-color kymograph showing facilitated exchange between successive injections of hRPA-eGFP (green) and hRPA-RFP (magenta) and the corresponding color-coded arrowheads indicate injection time each different hRPA protein. (D) Kymograph showing facilitated exchange between successive injections of hRPA-eGFP (green) and (E) wild-type hRPA (dark), and the corresponding arrowheads indicate the injection time for each protein.
Figure 3.
Figure 3.
Assembly of the RAD51 presynaptic complex. (A) Schematic showing the ssDNA curtain experiment for visualizing assembly of wild-type (dark) RAD51 using ssDNA-bound by hRPA-eGFP as a starting substrate. (B) Kymograph showing hRPA-eGFP stably bound to ssDNA in the absence of RAD51. (C) Kymograph showing displacement of hRPA-eGFP from the ssDNA upon injection of unlabeled RAD51 (indicated by black arrowhead) in the presence of 2 mM ATP, 1 mM Mg2+ and 5 mM Ca2+. The decrease in signal intensity is the result of hRPA-eGFP photobleaching, dissociation of hRPA-eGFP by RAD51 and the movement of molecules away from the TIRF field due to extension of the ssDNA. (D) The observed dissociation rates (see Supplementary Figure S3A), corrected to remove the contribution of photobleaching, are plotted against the RAD51 concentration. The constants are subsequently fitted to the hill equation to extract the Hill coefficient of 1.95 ± 0.322, Vmax = 0.011 ± 0.0042 s−1 and km = 828 ± 319 nM.
Figure 4.
Figure 4.
Influence of hRPA on RAD51 presynaptic complex assembly. (A) Assembly of the RAD51 filament on ssDNA-hRPA in the presence of free hRPA-eGFP. Representative kymograph showing dark RAD51 (750 nM) binding to hRPA-eGFP coated ssDNA in the presence or absence of 50 nM free hRPA-eGFP, as indicated. (B) Plot of hRPA-eGFP dissociation rates after injection of 750 nM RAD51 with different concentrations of free hRPA-eGFP in buffer containing 2 mM ATP, 1 mM Mg2+ and 5 mM Ca2+. Each rate was calculated from at least 42 different ssDNA molecules (see Supplementary Figure S3B). The resulting data were fitted to the adjusted hill equation for competitive inhibition by hRPA. (C) Kymographs highlighting individual nucleation events (white arrowheads) and the bi-directional RAD51 filament growth. (D) Plot showing filament elongation rates for 5′→3′ and 3′→5′ growth. (E) Position distribution histogram showing the locations of different RAD51 nucleation events along the length of the ssDNA substrate; error bars correspond to std. dev. obtained from bootstrapping. (F) Size distribution histogram reporting the lengths of RAD51 filaments based on the distances between adjacent nucleation events, as highlighted by the white arrowheads in (C) for 750 nM RAD51 with 50 nM RPA.
Figure 5.
Figure 5.
Disassembly of the RAD51 presynaptic complex. (A) Kymograph showing the assembly of an RAD51 filament on hRPA-eGFP coated ssDNA in buffer containing 1 mM ATP, 1 mM Mg2+ and 5 mM Ca2+. Free RAD51 was removed by chasing with buffer containing 1 nM hRPA-eGFP, and filament disassembly was initiated by chasing with buffer lacking Ca2+. (B) Kymographs showing the behavior of pre-assembled the RAD51 filaments when chased with buffers with and without Ca2+, ATP, or both, as indicated. (C) hRPA-eGFP normalized signal intensity versus time after injection of free hRPA-eGFP as a readout of RAD51 dissociation. Signal increase is the result of binding of free hRPA-eGFP that follows the dissociation of RAD51 from ssDNA. Shaded regions on the curves represent standard deviation, at least 23 ssDNA molecules were measured for each condition. (D) Kymographs highlighting the bi-directional disassembly of RAD51 filaments as visualized by re-binding of fluorescent hRPA-eGFP. White arrows highlight the positions at which disassembly initiates, and dashed lines highlight examples of bi-directional filament disassembly. (E) Plot showing filament disassembly rates for 5′→3′ and 3′→5′ dissociation. (F) Position distribution histogram showing the locations at which RAD51 filament dissociation initiates along the ssDNA; error bars correspond to std. dev. obtained from bootstrapping. (G) Size distribution histogram reporting the lengths of RAD51 filaments based on the distances between adjacent positions at which disassembly initiates; as highlighted by the white arrowheads in (D).
Figure 6.
Figure 6.
Model for RAD51 filament assembly. (A) When free hRPA is absent from solution, the ssDNA-bound hRPA does not exchange between free and bound state and RAD51 nucleation is unrestricted, resulting in numerous, short filaments. (B) When free hRPA is present, hRPA is in dynamic equilibrium between free and bound states. Free hRPA also restricts RAD51 nucleation events, giving rise to fewer, but longer filaments. (C) In the absence of Ca2+ RAD51 either cannot nucleate on the DNA, or the nucleation events do not result in stable DNA-bound complexes that are capable of supporting filament elongation. Additional details are presented in the ‘Discussion’ section.

References

    1. Symington L.S., Rothstein R., Lisby M. Mechanisms and regulation of mitotic recombination in Saccharomyces cerevisiae. Genetics. 2014;198:795–835. - PMC - PubMed
    1. Cox M.M., Goodman M.F., Kreuzer K.N., Sherratt D.J., Sandler S.J., Marians K.J. The importance of repairing stalled replication forks. Nature. 2000;404:37–41. - PubMed
    1. Fraser C., Hanage W.P., Spratt B.G. Recombination and the nature of bacterial speciation. Science. 2007;315:476–480. - PMC - PubMed
    1. Keeling P.J., Palmer J.D. Horizontal gene transfer in eukaryotic evolution. Nat. Rev. Genet. 2008;9:605–618. - PubMed
    1. Brown M.S., Bishop D.K. DNA strand exchange and RecA homologs in meiosis. Cold Spring Harb. Perspect. Biol. 2014;7:a016659. - PMC - PubMed

Publication types