. 2017 Feb 28;45(4):1760-1775.
doi: 10.1093/nar/gkw1158.

Autoregulation of MBNL1 function by exon 1 exclusion from MBNL1 transcript

Affiliations

Autoregulation of MBNL1 function by exon 1 exclusion from MBNL1 transcript

Patryk Konieczny et al. Nucleic Acids Res. .

Abstract

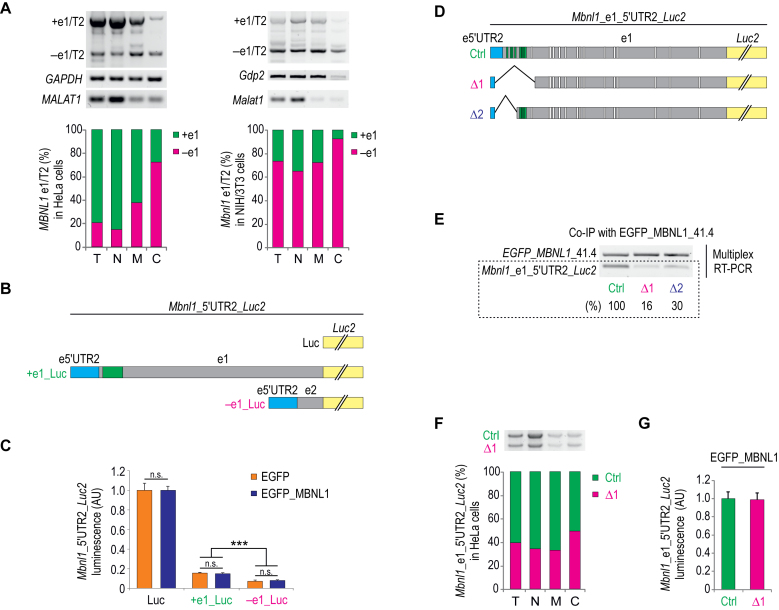
Muscleblind-like proteins (MBNLs) are regulators of RNA metabolism. During tissue differentiation the level of MBNLs increases, while their functional insufficiency plays a crucial role in myotonic dystrophy (DM). Deep sequencing of RNA molecules cross-linked to immunoprecipitated protein particles (CLIP-seq) revealed that MBNL1 binds to MBNL1 exon 1 (e1) encoding both the major part of 5΄UTR and an amino-terminal region of MBNL1 protein. We tested several hypotheses regarding the possible autoregulatory function of MBNL1 binding to its own transcript. Our data indicate that MBNLs induce skipping of e1 from precursor MBNL1 mRNA and that e1 exclusion may impact transcript association with polysomes and translation. Furthermore, e1-deficient protein isoform lacking the first two zinc fingers is highly unstable and its EGFP fusion protein has severely compromised splicing activity. We also show that MBNL1 can be transcribed from three different promoters and that the transcription initiation site determines the mode of e1 regulation. Taken together, we demonstrate that MBNL proteins control steady-state levels of MBNL1 through an interaction with e1 in its precursor mRNA. Insights from our study open a new avenue in therapies against DM based on manipulation of the transcription initiation site and e1 splicing of MBNL1 mRNA.


Figures

Figure 1.
Figure 1.
Mbnl1 protein interacts with the 5΄-most part of e1 of its own mRNA. (A) Mbnl1 CLIP cluster in e1 of mouse Mbnl1 and schematic representation of Mbnl1 RNA fragments used in B. (B) A filter binding assay showing an in vitro interaction of MBNL1 with the selected 190 nt-long region of e1 (WT) and reduced interaction with the corresponding fragment carrying point mutations in YGCY motifs (Mut1–Mut3). Mean values from two experiments ± standard deviation (SD) are shown on the graph. (C) The proposed structure of the e1 fragment based on the RNA digestion with two enzymatic structural probes, T2 RNase and S1 nuclease. The nuclease digestion sites are marked as indicated in the legend. Mutation sites of Mut1-Mut3 are marked with color-coded arrows as in A and B. CLIP-seq CIMs are indicated with black arrows.
Figure 2.
Figure 2.
MBNL1 expression is predominantly driven from T2 in cardiac and skeletal muscles. (A) Schematic representation of a genomic DNA fragment spanning transcription start sites (T1–T3) and their associated 5΄UTR exons (e5΄UTR1–e5΄UTR3) of MBNL1 that could be potentially spliced to either e1 or e2. Intron lengths between e5΄UTRs and e1, as well as e1 and e2 in either the mouse or human pre-mRNAs, are indicated. (B and C) Semi-quantitative multiplex PCRs showing Mbnl1 T1–T3 levels in C2C12 myoblasts following induction of differentiation (B) and in foetal (left panel) and adult (right panel) human tissue cDNA panels from Clontech (C). Specific signals for each of the e5΄UTR were related to signals obtained from amplification of genomic DNA isolated from either mouse C2C12 myoblasts (B) or human HeLa cells (C). Signals from B were additionally related to Gdp2 mRNA signals obtained from a semi-quantitative multiplex RT-PCR. Values were obtained based on quantification of bands intensities from one of two gels. Sk musc, skeletal muscle; Panc, pancreas; gDNA, genomic DNA. AU indicates arbitrary units.
Figure 3.
Figure 3.
Splicing of MBNL1 e1 is autoregulated by MBNL proteins in pre-mRNA transcribed from T2. (A) RT-PCR analyses of MBNL1 e1 splicing in skeletal muscles of non-DM (n = 3), DM1 (n = 3) and DM2 (n = 5) patients (left panel), and WT (n = 3) and HSALR (n = 3) mice (right panel). (B) E1 splicing in MBNL1 pre-mRNA following forced expression of EGFP_MBNL1, 2 and 3 (–e5, –e7) in HeLa cells. (C) Increased inclusion of e1 in MBNL1 mRNA upon administration of siRNA against MBNL1 in fibroblasts. 25 nM of either control AllStars (Ctrl) or MBNL1-specific siRNA was administered. n = 3 per each treatment group. (D) RT-PCR analyses of Mbnl1 e1 splicing in HeLa cells following co-delivery of wild-type (min_e1_WT) or mutant (min_e1_Mut3) minigenes containing Mbnl1 e1 with either a plasmid encoding EGFP or EGFP_MBNL1 (41.4). Note abolished skipping of the most-5΄ part of e1 (e1_5΄) in min_e1_Mut3 upon forced expression of EGFP_MBNL1 (red frame). (E) Quantification of the bands from the correspondingly color-coded frames in D, showing proportion of transcripts with included (blue) and excluded (red) e1_5΄ region. (F) RT-PCRs of human skeletal muscle samples (Clontech) with primers specific to either e5΄UTR2 or e5΄UTR3 and 3΄UTR of MBNL1 showing that these transcripts are full-length. (G) Schematic representation of splicing outcomes of MBNL1 e1 depending on the transcription initiation start site. Bar graphs show mean values + SD. Statistical significance was evaluated by two-tailed Student's t-test; *P <0.05, **P <0.01, ***P <0.001.
Figure 4.
Figure 4.
Reduced translation from MBNL1 5΄UTR lacking e1. (A) Subcellular fractionation of HeLa (left panel) or NIH/3T3 cells (right panel) followed by RT-PCR analyses for MBNL1 e1, GAPDH/Gdp2 and MALAT1. MALAT1 was used as a positive control for the nuclear fraction. (B) A schematic representation of Mbnl1_ 5΄UTR2_Luc2 (Luc, +e1_Luc, –e1_Luc) luciferase constructs used in C. The vectors contain Mbnl1 e1 5΄UTRs based either on e1 (+e1_Luc) or e2 (–e1_Luc) fused to luciferase Luc2 or Luc2 alone (Luc). (C) Luciferase assay showing translational activities of Luc, +e1_Luc and –e1_Luc mRNAs following plasmid co-delivery with EGFP or EGFP_MBNL1 (41.4) constructs. AU indicates arbitrary units. n = 3 per each treatment group. Bar graphs show mean values + SD. (D) A schematic representation of Mbnl1_e1_5΄UTR2_Luc2 (Ctrl, Δ1, Δ2) used in E-G. Ctrl contains a 3΄ part of e5΄UTR2 and most of the non-coding region of e1 of Mbnl1. Δ1 and Δ2 lack a variable number of YGCY motifs at the 5΄-most part of e1. (E) Co-immunoprecipitation (Co-IP) of EGFP_MBNL1_41.4 and RNA complexes following UV-cross linking of proteins with target RNAs. (F) Subcellular fractionation following co-transfection of Ctrl and Δ1 plasmids into HeLa cells. (G) Luminescence obtained following administration of EGFP_MBNL1 with either Ctrl or Δ1 plasmids. T, total cell extract; N, nuclear fraction; M, membrane fraction; C, cytosolic fraction devoid of polysomes. Bar graphs show mean values + SD. Statistical significance was evaluated by two-tailed Student's t-test; ***P <0.001.
Figure 5.
Figure 5.
Increased content of MBNL1 transcripts containing e1 in muscles showing loss of functional MBNLs. (A and B) Semi-quantitative multiplex RT-PCRs (upper panel) and quantitative RT-PCRs (lower panel) of total and transcription start site-specific (T1–T3) MBNL1 mRNAs in either human (A) or mouse (B) skeletal muscles. n = 3, non-DM and DM1 (upper left panel), WT, HSALR; n = 4, non-DM and DM1 (upper right and lower panels). The signals were related to GAPDH/Gdp2 mRNA and genomic DNA signals as described for data shown in Figure 2B (A) or to GAPDH/Gdp2 mRNA alone (B). AU indicates arbitrary units. Bar graphs show mean values + SD. Statistical significance was evaluated by two-tailed Student's t-test; *P < 0.05, **P < 0.01.
Figure 6.
Figure 6.
Autoregulatory function of MBNL1 expression. (A) Schematic representation of MBNL1 constructs containing EGFP (EGFP_MBNL1). The constructs differ in the presence of e5 and the number of ZnFs. The MBNL1 plasmid sequence corresponds to the coding sequence of MBNL1 mRNA with (41.4/43.4) and without e1 (41.2/43.2), respectively. Green, blue, yellow and grey boxes indicate EGFP, ZnFs, e5 and Flag-tag, respectively. (B) Immunoblotting analysis for EGFP_MBNL1 and endogenous MBNL1 (enMBNL1) in HeLa cell lysates following transfection with EGFP (Ctrl) or EGFP_MBNL1-containing plasmids as indicated. (C) Immunofluorescence microscopy of HeLa cells transfected with EGFP_MBNL1 constructs as indicated. (D) Constructs analogous to the ones in A but devoid of EGFP (EGFPΔ_MBNL1). (E) Immunoblotting assay for MBNL1 using antibody to Flag-tag in lysates from COS7 cells co-transfected with EGFPΔ_MBNL1 constructs as indicated. Note lack of detectable signal of MBNL1 following delivery of 41.2 and 43.2. The lower panel shows quantification of EGFPΔ_MBNL1 relatively to GAPDH (mean values ± SD). n = 3 per each treatment group. (F) Semi-quantitative RT-PCR analyses of EGFPΔ_MBNL1 and GAPDH mRNA following delivery of EGFPΔ_MBNL1 constructs as indicated. cDNA from untreated HeLa cells (Ctrl) or plasmid DNA (41.2 and 41.4; DNA) were used as controls. (G and H) Immunoblotting analyses for MBNL1 following delivery of EGFPΔ_MBNL1_41.2 and 41.4 in HeLa cells (G) or 43.2 and 43.4 in COS7 cells (H). Quantification of enMBNL1 (as the sum of two endogenous MBNL1 bands) relative to GAPDH is shown below the blots (mean values ± SD). Statistical significance was evaluated by two-tailed Student's t-test; * P <0.05, **P <0.01.
Figure 7.
Figure 7.
ZnFs 1 and 2 are essential for optimal MBNL1 splicing activity. (A) RT-PCR analyses of MBNL1 e1, MBNL2 e7, NCOR2 e45a and NFIX e7 distribution in COS7 cells following delivery of EGFPΔ_MBNL1 plasmids. (B) Comparison of splicing activities of MBNL1 proteins with four and two ZnFs in HeLa cells co-transfected with EGFP_MBNL1 constructs and a cTNT minigene. (C) RT-PCR analyses of the distribution of the same alternative exons as in A but in HeLa cells upon administration of EGFP or EGFP_MBNL1 vectors. Constructs were delivered in appropriate amounts to equalize for the reduced stability of EGFP_MBNL1_41.2. Bar graphs show mean values + SD. (D) Splicing activity of MBNL1 on cTNT e5 upon co-delivery of EGFP_MBNL1_41.4 and increasing amounts of EGFP_MBNL1_41.2 in HeLa cells. Mean values ± standard deviation (SD) are shown on the graph. n = 3 per each treatment group. Statistical significance was evaluated by a two-tailed Student's t-test; * P < 0.05, **P < 0.01, ***P < 0.001.
Figure 8.
Figure 8.
Proposed model of MBNL1 autoregulation dependent on e1 exclusion from MBNL1 transcript. During development, elevated content of MBNL1 protein induces skipping of e1 in MBNL1 pre-mRNA, which halts further increase of MBNL1. In myotonic dystrophy, sequestration of MBNLs on DMPK mRNA containing expanded CUG repeats (CUGexp) results in MBNL1 e1-dependent compensatory process: MBNL1 content rises because first, the 5΄UTR containing e1 determines higher translational activity of MBNL1 and second, MBNL1 with four ZnFs is more stable than its truncated counterpart originating from e1-devoid mRNA. With increasing expansion size, the e1-driven compensatory process overcomes MBNL1 sequestration less efficiently. Based on this assumption, condition of patients worsens over time due to somatic expansion of CUG repeats and a resulting drop in cellular activity of MBNL1.

Similar articles

Cited by

References

    1. Batra R., Charizanis K., Manchanda M., Mohan A., Li M., Finn D., Goodwin M., Zhang C., Sobczak K., Thornton C. et al. . Loss of MBNL Leads to Disruption of Developmentally Regulated Alternative Polyadenylation in RNA-Mediated Disease. Mol. Cell. 2014; 56:311–322. - PMC - PubMed
    1. Masuda A., Andersen H., Doktor T., Okamoto T., Ito M., Andresen B., Ohno K.. CUGBP1 and MBNL1 preferentially bind to 3΄ UTRs and facilitate mRNA decay. Sci. Rep. 2012; 2:209. - PMC - PubMed
    1. Rau F., Freyermuth F., Fugier C., Villemin J.-P., Fischer M.-C., Jost B., Dembele D., Gourdon G., Nicole A., Duboc D. et al. . Misregulation of miR-1 processing is associated with heart defects in myotonic dystrophy. Nat. Struct. Mol. Biol. 2011; 18:840–845. - PubMed
    1. Wang E., Cody N., Jog S., Biancolella M., Wang T., Treacy D., Luo S., Schroth G., Housman D., Reddy S. et al. . Transcriptome-wide regulation of pre-mRNA splicing and mRNA localization by muscleblind proteins. Cell. 2012; 150:710–724. - PMC - PubMed
    1. Wang E., Ward A., Cherone J., Giudice J., Wang T., Treacy D., Lambert N., Freese P., Saxena T., Cooper T. et al. . Antagonistic regulation of mRNA expression and splicing by CELF and MBNL proteins. Genome Res. 2015; 25:858–871. - PMC - PubMed

Publication types