. 2017 Feb 28;45(4):1805-1819.
doi: 10.1093/nar/gkw1163.

Role of the chromatin landscape and sequence in determining cell type-specific genomic glucocorticoid receptor binding and gene regulation

Affiliations

Role of the chromatin landscape and sequence in determining cell type-specific genomic glucocorticoid receptor binding and gene regulation

Michael I Love et al. Nucleic Acids Res. .

Abstract

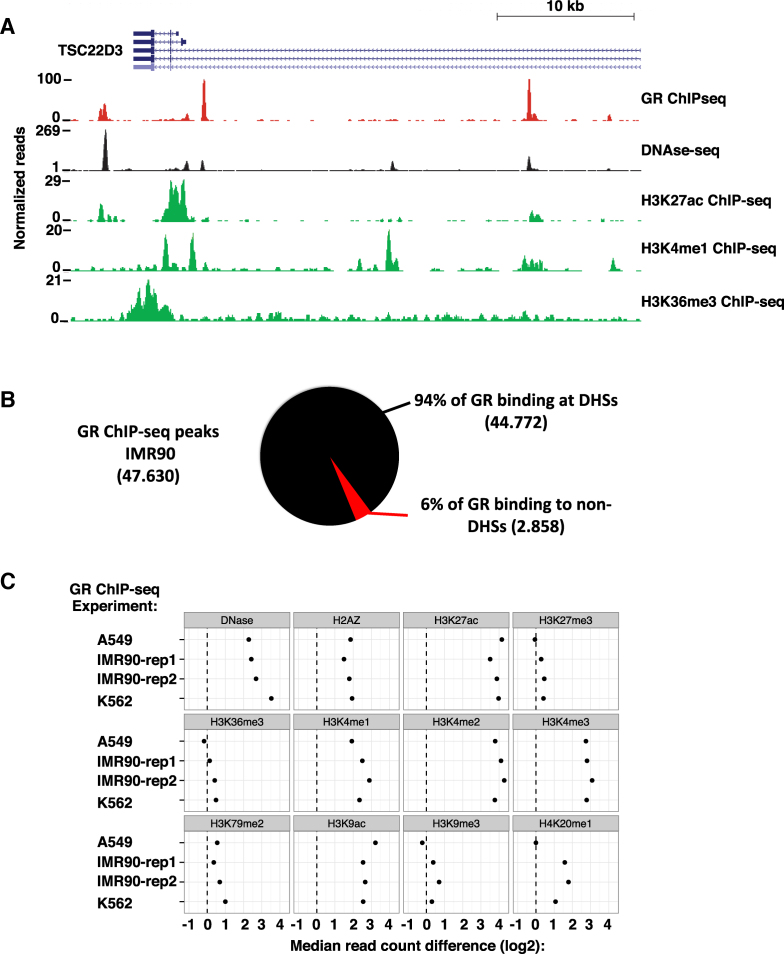
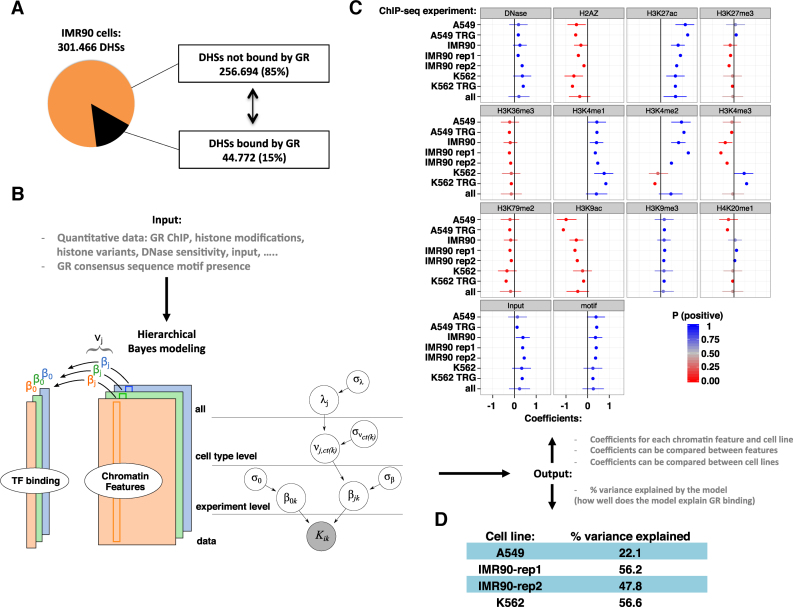
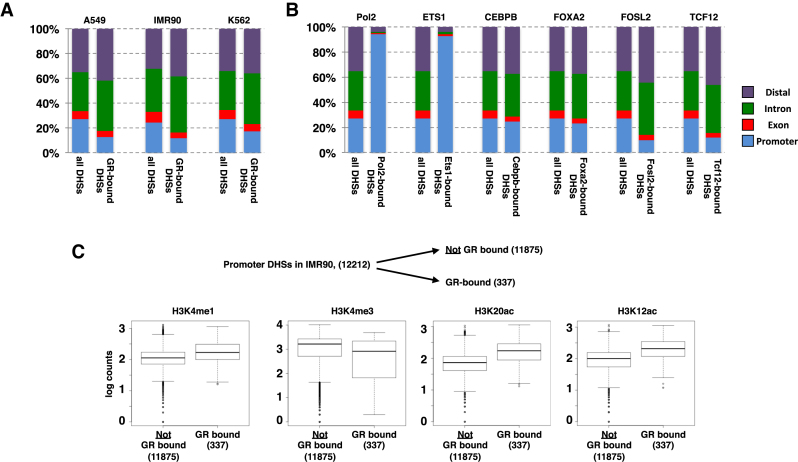
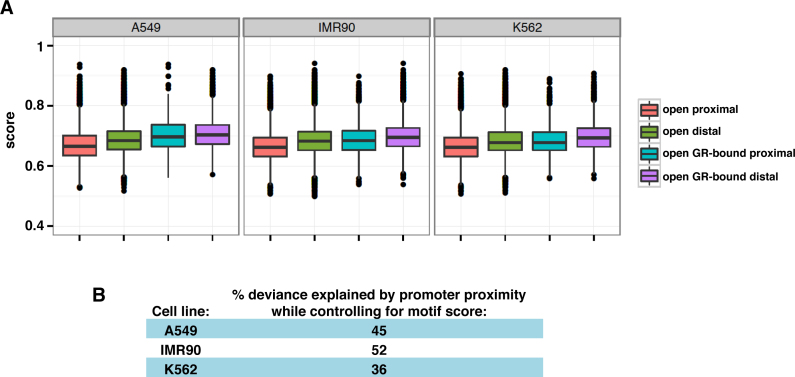
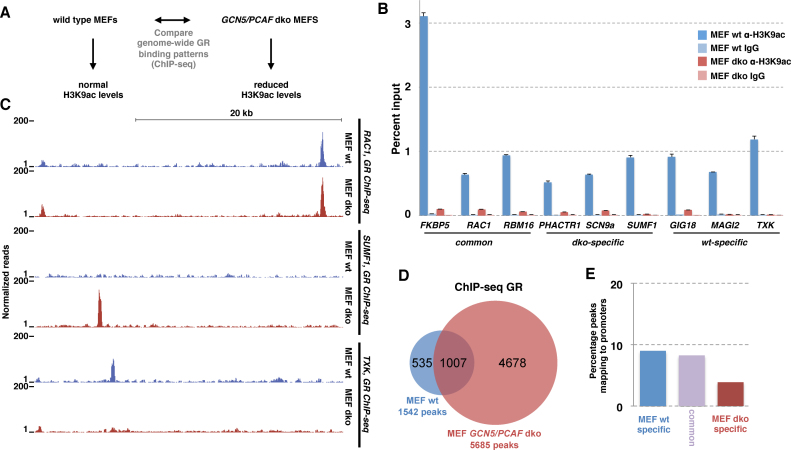
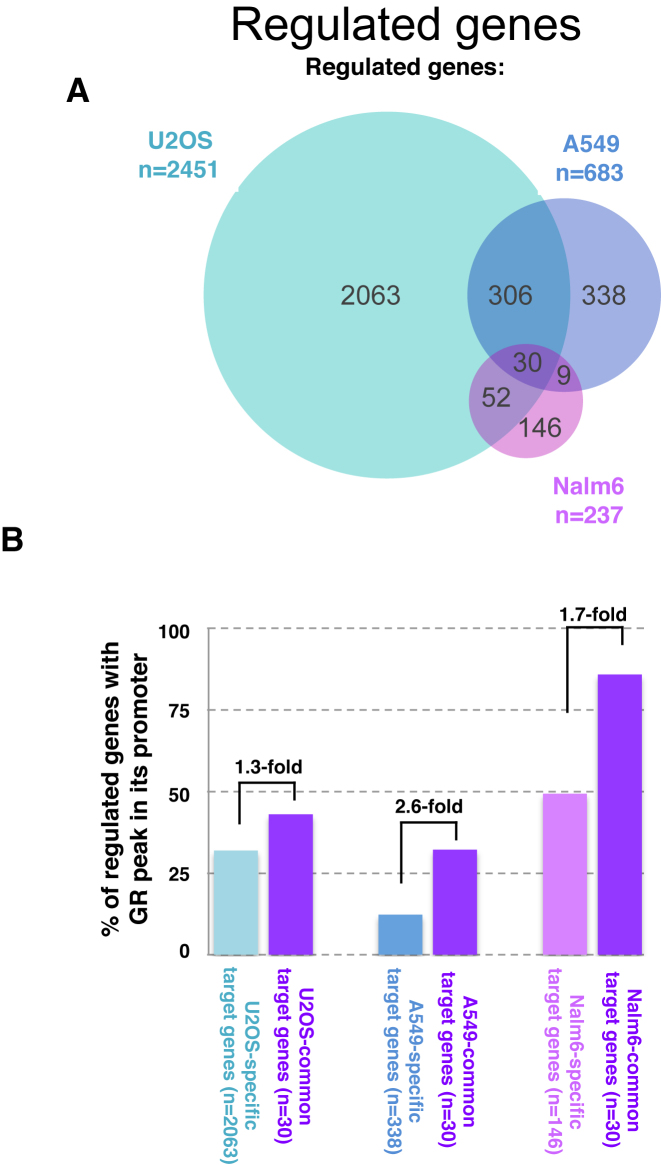
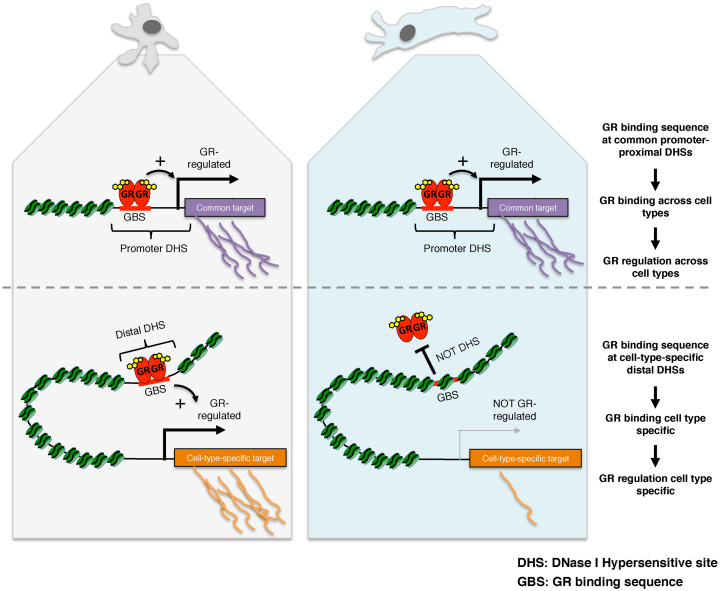
The genomic loci bound by the glucocorticoid receptor (GR), a hormone-activated transcription factor, show little overlap between cell types. To study the role of chromatin and sequence in specifying where GR binds, we used Bayesian modeling within the universe of accessible chromatin. Taken together, our results uncovered that although GR preferentially binds accessible chromatin, its binding is biased against accessible chromatin located at promoter regions. This bias can only be explained partially by the presence of fewer GR recognition sequences, arguing for the existence of additional mechanisms that interfere with GR binding at promoters. Therefore, we tested the role of H3K9ac, the chromatin feature with the strongest negative association with GR binding, but found that this correlation does not reflect a causative link. Finally, we find a higher percentage of promoter-proximal GR binding for genes regulated by GR across cell types than for cell type-specific target genes. Given that GR almost exclusively binds accessible chromatin, we propose that cell type-specific regulation by GR preferentially occurs via distal enhancers, whose chromatin accessibility is typically cell type-specific, whereas ubiquitous target gene regulation is more likely to result from binding to promoter regions, which are often accessible regardless of cell type examined.


Figures

Figure 1.
Figure 1.
Interaction of GR with the chromatin landscape. (A) Normalized tag density from ChIP-seq for GR after hormone treatment and from DNase-seq and H3K27ac, H3K4me1 and H3K36me3 ChIP-seq prior to hormone treatment in IMR90 cells is shown for a region of the X-chromosome around the GR target gene TSC22D3. (B) Distribution of GR ChIP-seq peaks between DNase I hypersensitive sites (DHSs) as annotated by the ENCODE consortium (accessible chromatin) and the rest of the genome (inaccessible chromatin, non-DHS) in IMR90 cells. (C) Median read count difference of chromatin features as indicated between GR ChIP-seq peaks and genomic control regions 5kb away (randomly up- or down-stream of the GR peaks) is shown for three cell lines: A549, IMR90 and K562.
Figure 2.
Figure 2.
GR binding in the universe of open chromatin. (A) Pie chart showing the percentage of all DHSs in IMR90 cells occupied by GR (15%) in black. (B) Left: The hierarchical Bayesian model for a single cell type to model the read density of GR binding (tall colored columns), based on various chromatin features (colored rectangles). Right: The full hierarchical model. The grey node at the bottom indicates the data. As output, the model generates coefficients (β) for each chromatin feature and for each experiment. Experiments on the same cell type share a common effect (ν), and all cell types share a common effect λ. (C) Estimated coefficients for all levels of the model, with cell type, lab and replicate number indicated e.g. A549 TRG. The cell type parameters (ν) are indicated with only the cell type e.g. A549. The parameter λ is labeled ‘all’. Dots mark the posterior mean; whiskers indicate the 95% quantile-based interval. P (positive) from 0 to 1 indicates the posterior probability of the coefficient having a positive impact on GR binding, according to the posterior distributions obtained from the hierarchical Bayesian model. (D) % variance explained by the model for each of the cell lines.
Figure 3.
Figure 3.
Genomic distribution of DHSs and of GR-bound DHSs. (A) Distribution of all DHSs and of GR-bound DHSs in cell lines as indicated relative to annotated genomic features (promoters: ±2.5 kb from TSS; exons, introns and distal (rest)). (B) Same as for a) except that ChIP-seq peaks for TFs as indicated (A549 cells) were analyzed. (C) Comparison of GR-bound and unbound promoter DHSs in IMR90 cells uncovered that GR-bound regions have higher levels of enhancer-associated marks (H3K4me1, H3K12ac and H3K20ac) whereas levels for H3K4me3, a typical promoter mark, are lower when compared to their unbound DHS counterparts.
Figure 4.
Figure 4.
Role of sequence composition in explaining the promoter–proximal depletion of GR binding observed. (A) Distribution of GR motif score (GR motif MA0113.1 from JASPAR, (23)) for the following groups: All promoter–proximal DHSs (salmon), all distal DHSs (green), for GR-bound proximal DHSs (turquoise) and GR-bound distal DHSs (purple) for cell lines as indicated. (B) Percent deviance of GR peak presence at DHSs explained by promoter proximity while controlling for motif score, as a percent of the deviance explained by the motif score alone indicates that motif score distribution explains some, but not all promoter–proximal depletion of GR binding.
Figure 5.
Figure 5.
Functional analysis of the correlation between H3K9ac levels and GR binding: correlation ≠ causation. (A) Schematic diagram depicting the design of the study to test if the correlation between H3K9ac levels and GR binding reflects a causative link. (B) Comparison of % input precipitated by ChIP with an H3K9ac-specific antibody versus IgG control at GR-bound genomic loci as indicated was assayed by qPCR (average enrichment + error from 7 pooled biological replicates) in either wild type MEFs (blue) or in GCN5/PCAF double knock-out (dko) MEFs (salmon). (C) Normalized tag density from ChIP-seq for GR after hormone treatment for wild type MEFs (blue) and dko MEFs (salmon) for genomic region near RAC1 gene: GR-bound in both wt MEFs and dko MEFS; SUMF1: dko-specific GR binding and TXK: wt-specific GR binding. (D) Venn diagram showing the number and overlap of GR-bound loci in wt and dko MEFs. (E) Comparison of the % of GR ChIP-seq peaks mapping to promoter regions for wt-specific, common and dko-specific peaks.
Figure 6.
Figure 6.
Link between promoter–proximal binding and cell type-specific gene regulation by GR. (A) Venn diagram showing the overlap of genes regulated in response to dexamethasone between three cell lines: U2OS stably expressing GR, A549 and Nalm6 cells. (B) % of promoter regions with a GR-peak is higher for genes regulated across cell types than for cell type-specific target genes in all three cell types examined.
Figure 7.
Figure 7.
Cartoon depiction of our model how shared and cell type-specific chromatin accessibility direct gene regulation by GR. (top) Shared regulation of GR targets across cell types preferentially occurs via promoter–proximal DHSs which are accessible regardless of cell type. (bottom) In contrast, the expression of cell type-specific GR target genes preferentially occurs via cell type-specific GR binding to distal DHSs, which are accessible in a cell type-specific manner.

Similar articles

Cited by

References

    1. Mathelier A., Fornes O., Arenillas D.J., Chen C.Y., Denay G., Lee J., Shi W., Shyr C., Tan G., Worsley-Hunt R. et al. . JASPAR 2016: a major expansion and update of the open-access database of transcription factor binding profiles. Nucleic Acids Res. 2016; 44:D110–D115. - PMC - PubMed
    1. Handstad T., Rye M., Mocnik R., Drablos F., Saetrom P.. Cell-type specificity of ChIP-predicted transcription factor binding sites. BMC Genomics. 2012; 13:372. - PMC - PubMed
    1. Siersbaek R., Rabiee A., Nielsen R., Sidoli S., Traynor S., Loft A., La Cour Poulsen L., Rogowska-Wrzesinska A., Jensen O.N., Mandrup S.. Transcription factor cooperativity in early adipogenic hotspots and super-enhancers. Cell Rep. 2014; 7:1443–1455. - PubMed
    1. Jolma A., Yin Y., Nitta K.R., Dave K., Popov A., Taipale M., Enge M., Kivioja T., Morgunova E., Taipale J.. DNA-dependent formation of transcription factor pairs alters their binding specificity. Nature. 2015; 527:384–388. - PubMed
    1. Li X.Y., Thomas S., Sabo P.J., Eisen M.B., Stamatoyannopoulos J.A., Biggin M.D.. The role of chromatin accessibility in directing the widespread, overlapping patterns of Drosophila transcription factor binding. Genome Biol. 2011; 12:R34. - PMC - PubMed

Publication types

MeSH terms