. 2017 Jan 17;8(3):4977-4993.
doi: 10.18632/oncotarget.13636.

CDH1 regulates E2F1 degradation in response to differentiation signals in keratinocytes

Affiliations

CDH1 regulates E2F1 degradation in response to differentiation signals in keratinocytes

Randeep K Singh et al. Oncotarget. .

Abstract

The E2F1 transcription factor plays key roles in skin homeostasis. In the epidermis, E2F1 expression is essential for normal proliferation of undifferentiated keratinocytes, regeneration after injury and DNA repair following UV radiation-induced photodamage. Abnormal E2F1 expression promotes nonmelanoma skin carcinoma. In addition, E2F1 must be downregulated for proper keratinocyte differentiation, but the relevant mechanisms involved remain poorly understood. We show that differentiation signals induce a series of post-translational modifications in E2F1 that are jointly required for its downregulation. Analysis of the structural determinants that govern these processes revealed a central role for S403 and T433. In particular, substitution of these two amino acid residues with non-phosphorylatable alanine (E2F1 ST/A) interferes with E2F1 nuclear export, K11- and K48-linked polyubiquitylation and degradation in differentiated keratinocytes. In contrast, replacement of S403 and T433 with phosphomimetic aspartic acid to generate a pseudophosphorylated E2F1 mutant protein (E2F1 ST/D) generates a protein that is regulated in a manner indistinguishable from that of wild type E2F1. Cdh1 is an activating cofactor that interacts with the anaphase-promoting complex/cyclosome (APC/C) ubiquitin E3 ligase, promoting proteasomal degradation of various substrates. We found that Cdh1 associates with E2F1 in keratinocytes. Inhibition or RNAi-mediated silencing of Cdh1 prevents E2F1 degradation in response to differentiation signals. Our results reveal novel regulatory mechanisms that jointly modulate post-translational modifications and downregulation of E2F1, which are necessary for proper epidermal keratinocyte differentiation.

Keywords: E2F1; epidermis; keratinocytes.


Conflict of interest statement

CONFLICTS OF INTEREST

The authors have no conflict of interest to declare.

Figures

Figure 1
Figure 1. S403 and T433 mediate E2F1 degradation during keratinocyte differentiation
Vectors encoding V5-tagged wild type (WT) or the indicated E2F1 mutants were transfected in undifferentiated keratinocytes. Twenty-four hours after transfection, cells were treated with cycloheximide (CHX, 100 μg/ml), and 30 min later the culture medium was replaced with Low Ca2+ or High Ca2+ medium supplemented with CHX. Cell lysates were prepared 2.5 h later and analyzed by immunoblot for the indicated proteins, using anti-V5 antibodies, or γ-tubulin, as loading control. The histograms represent normalized densitometric quantification of each E2F1 protein (mean + SEM), and are expressed as the percentage of a given E2F1 form relative to its abundance in Low Ca2+ medium, which is set at 100%. The asterisks indicate P<0.05 (ANOVA).
Figure 2
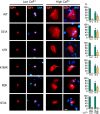
Figure 2. S403 and T433 are required for E2F1 nuclear export during keratinocyte differentiation
Undifferentiated keratinocytes were transfected with vectors encoding V5-tagged wild type (WT) or the indicated E2F1 mutant proteins. Four hours after transfection, the culture medium was replaced with Low Ca2+ or High Ca2+ medium, and the cells were processed for immunofluorescence microscopy 24 h later, using anti-V5 antibodies. DNA was visualized with Hoechst 33342. The values in the histograms represent the percentage of cells (mean + SEM, n=3) that exhibited nuclear (N) or cytoplasmic (C) E2F1 distribution. The asterisks indicate P<0.05 relative to values in the corresponding subcellular compartments in Low Ca2+ medium (ANOVA). Bar, 16 μm.
Figure 3
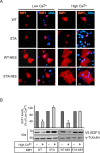
Figure 3. Effect of constitutive nuclear export on E2F1 abundance in differentiating keratinocytes
A. Undifferentiated keratinocytes were transfected with vectors encoding V5-tagged wild type (WT) or the indicated E2F1 mutant proteins. Four hours after transfection, the culture medium was replaced with Low Ca2+ or High Ca2+ medium, and the cells were processed for immunofluorescence microscopy 24 h later, using anti-V5 antibodies. DNA was visualized with Hoechst 33342. B. Cells transfected as described in (A) were cultured for 24 h in Low Ca2+ medium. Cycloheximide was added (100 μg/ml), and 30 min later the cells were cultured for 2.5 h in Low Ca2+ or High Ca2+ medium supplemented with cycloheximide. Cell lysates were prepared and analyzed by immunoblot with antibodies against V5 or γ-tubulin, used as loading control. The histograms represent normalized densitometric quantification of each E2F1 protein (mean + SEM, n=3), and are expressed as the percentage of a given E2F1 form relative to its abundance in Low Ca2+ medium, which is set at 100%. The asterisks indicate P<0.05 (ANOVA).
Figure 4
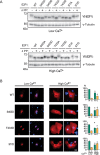
Figure 4. Characterization of pseudophosphorylated E2F1 mutant proteins
A. Undifferentiated keratinocytes were transfected with vectors encoding V5-tagged wild type (WT) or the indicated E2F1 mutant proteins. Four hours after transfection, the culture medium was replaced with Low Ca2+ or High Ca2+ medium. After 24 h, cell lysates were prepared and incubated in the presence or absence of λ phosphatase (λ PP; 4 U/mg of lysate protein), resolved on denaturing polyacrylamide gels, and analyzed by immunoblot, with antibodies against V5 or γ-tubulin, used as loading control. The results shown are representative of three experiments. B. Cells transfected as described in (A) were processed for immunofluorescence microscopy following 24 h of incubation in Low Ca2+ or High Ca2+ medium, using anti-V5 antibodies. DNA was visualized with Hoechst 33342. The values in the histograms represent the percentage of cells (mean + SEM, n=3) that exhibited nuclear (N) or cytoplasmic (C) E2F1 distribution. The asterisks indicate P<0.05 relative to values in the corresponding subcellular compartments in Low Ca2+ medium (ANOVA). Bar, 16 μm.
Figure 5
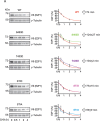
Figure 5. S403 and T433 regulate E2F1 protein half-life in differentiated keratinocytes
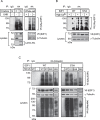
Undifferentiated keratinocytes were transfected with vectors encoding V5-tagged wild type (WT) or the indicated E2F1 mutant proteins. Twenty-four hours after transfection, the culture medium was replaced with Low Ca2+ (panel A) or High Ca2+. Undifferentiated keratinocytes were transfected with vectors encoding V5-tagged wild type (WT) or the indicated E2F1 mutant proteins. Twenty-four hours after transfection, the culture medium was replaced with High Ca2+ (panel B) medium, followed by addition of cycloheximide (100 μg/ml, final). Cell lysates were prepared from replicate samples at the indicated times thereafter, and analyzed by immunoblot using anti-V5 antibodies, to detect E2F1, or γ-tubulin, used as loading control. Representative blots for each E2F1 protein are shown. The graphs represent the densitometric quantification of E2F1 protein levels (mean ± S.D., n=3) calculated from experiments conducted on three independent keratinocyte isolates, and are expressed as a percent of levels measured at t=0, set to 100%. Decay curves were used to calculate the apparent half-life of each E2F1 protein (t½), showed on its corresponding graph. For each plot, the decay curve for wild type E2F1 is shown in red, for comparison. The asterisks indicate P<0.05 relative to t½ of wild type E2F1 (ANOVA).
Figure 6
Figure 6. E2F1 ubiquitylation in keratinocytes
A. Undifferentiated keratinocytes were transfected with vectors encoding wild-type V5-tagged E2F1 and HA-tagged ubiquitin. Twenty-four hours later, MG132 (10 μM, final) was added to the culture medium, followed 3 h later by leptomycin B (LMB, 10 ng/ml, final) or ethanol (vehicle). Cultures were incubated in the presence of both drugs for 30 min, at which time the Ca2+ concentration was adjusted to 1.0 mM. Lysates containing whole-cell, nuclear (N) or cytoplasmic (C) fractions were prepared 2.5 h later, HA-ubiquitin immunecomplexes were isolated, resolved by denaturing gel electrophoresis, and analyzed with anti-V5 antibodies to detect ubiquitylated V5-tagged E2F1. Antibodies against β-tubulin or lamin A/C were used to verify the purity of the fractionated extracts and as loading controls. B. Undifferentiated keratinocytes were transfected with vectors encoding HA-tagged ubiquitin and V5-tagged wild type or ST/A E2F1, cultured in Low (−) or High (+) Ca2+ medium, as indicated, and treated with MG132 as in panel (A). HA or unrelated IgG immunecomplexes were isolated from whole-cell lysates and analyzed by immunoblot with anti-V5 antibodies. The abundance of exogenous E2F1 proteins in the lysates was analyzed by immunoblot, using γ-tubulin as loading control. The asterisk indicates the IgG heavy chain. C. Keratinocytes cultured in Low Ca2+ medium were transfected with vectors encoding the indicated V5-tagged E2F1 and HA-tagged ubiquitin proteins. Twenty-four hours after transfection, cells were incubated in the presence of MG132 (10 μM, final) for 6 h. Cell lysates were prepared and HA or unrelated IgG immunecomplexes were isolated and analyzed by immunoblot with anti-V5 antibodies. The abundance of exogenous E2F1 and HA-ubiquitin-containing proteins in the lysates was analyzed by immunoblot, using γ -tubulin as loading control. Ubn-E2F1 indicates ubiquitylated V5-tagged E2F1 proteins. All results shown are representative of three replicate experiments conducted with independent cell isolates.
Figure 7
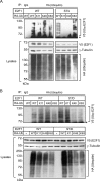
Figure 7. S403 and T433 regulate K11- and K48-linkage ubiquitylation of E2F1 in differentiated keratinocytes
Keratinocytes cultured in Low Ca2+ medium were transfected with vectors encoding wild type or ST/A V5-tagged E2F1 (Panel A), wild type or ST/D V5-tagged E2F1 (Panel B) together with plasmids encoding the indicated HA-tagged ubiquitin proteins. After 4 h, the culture medium was replaced with High Ca2+ medium, and cells were cultured for 18 h, followed by incubation in the presence of MG132 (10 μM, final) for 6 h. Cell lysates were prepared and HA immunecomplexes were isolated and analyzed by immunoblot with anti-V5 antibodies. The abundance of exogenous E2F1 and HA-ubiquitin-containing proteins in the lysates was analyzed by immunoblot, using γ-tubulin as loading control. Ubn-E2F1 signifies ubiquitylated V5-tagged E2F1 proteins, and the asterisk shows the position of the IgG heavy chain. All results shown are representative of at least three replicate experiments conducted with independent cell isolates.
Figure 8
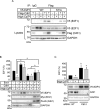
Figure 8. Cdh1 interacts with E2F1 and promotes its degradation in differentiating keratinocytes
A. Keratinocytes cultured in Low Ca2+ medium were transfected with vectors encoding FLAG-tagged Cdh1 and V5-tagged E2F1. After 4 h, the cells were cultured in Low (−) or High Ca2+ (+) medium for 24 h. Cell lysates were prepared and subjected to immunoprecipitation with anti-FLAG antibodies. The immune complexes were analyzed by immunoblot with anti-V5 antibodies, to detect E2F1. Samples of the lysates were also analyzed by immunoblot with the indicated antibodies. B. Keratinocytes were transfected with vectors encoding V5-tagged E2F1, in the presence or absence of vectors encoding FLAG-tagged Cdh1 and myc-tagged hEmi1, as indicated. Twenty-four hours later, the cells were treated with cycloheximide (100 μg/ml, final) and the culture medium was replaced 30 min later with Low Ca2+ (−) or High Ca2+ medium. Keratinocyte lysates were prepared 3 h later and analyzed by immunoblot with the indicated antibodies. The histograms represent quantification of E2F1 proteins (mean + SEM, n=3), relative to E2F1 abundance in Low Ca2+ medium in the absence of exogenous Cdh1 and hEmi1, which is set at 100%. The asterisks indicate P<0.05 relative to E2F1 levels in cells cultured in Low Ca2+ medium without other exogenous proteins, except where otherwise indicated (ANOVA). C. Undifferentiated keratinocytes were sequentially transfected with control, non-targeting (NT) or Cdh1-targeting siRNAs, followed by transfection with vectors encoding V5-tagged E2F1, as described in Materials and Methods. Cells were treated with CHX and harvested for protein analysis as described in (B). The histograms represent E2F1 levels (mean + SEM, n=3), relative to those in cells cultured in Low Ca2+ medium in the presence of NT siRNA, which is set at 100%. Asterisks indicate P<0.05 relative to E2F1 levels in cells cultured in Low Ca2+ medium (ANOVA).

Similar articles

Cited by

References

    1. Poppy Roworth A, Ghari F, La Thangue NB. To live or let die: complexity within the E2F1 pathway. Mol Cell Oncol. 2015;2:e970480. - PMC - PubMed
    1. Ghari F, Quirke AM, Munro S, Kawalkowska J, Picaud S, McGouran J, Subramanian V, Muth A, Williams R, Kessler B, Thompson PR, Fillipakopoulos P, Knapp S, Venables PJ, La Thangue NB. Citrullination-acetylation interplay guides E2F-1 activity during the inflammatory response. Science advances. 2016;2:e1501257. - PMC - PubMed
    1. Zhan L, Huang C, Meng XM, Song Y, Wu XQ, Miu CG, Zhan XS, Li J. Promising roles of mammalian E2Fs in hepatocellular carcinoma. Cell Signal. 2014;26:1075–1081. - PubMed
    1. D’Souza SJ, Pajak A, Balazsi K, Dagnino L. Ca2+ and BMP-6 signaling regulate E2F during epidermal keratinocyte differentiation. J Biol Chem. 2001;276:23531–23538. - PubMed
    1. Dagnino L, Fry CJ, Bartley SM, Farnham P, Gallie BL, Phillips RA. Expression patterns of the E2F family of transcription factors during mouse nervous system development. Mech Dev. 1997;66:13–25. - PubMed

MeSH terms