. 2017 Jan 3;8(1):785-797.
doi: 10.18632/oncotarget.13648.

Novel risk models for early detection and screening of ovarian cancer

Affiliations

Novel risk models for early detection and screening of ovarian cancer

Matthew R Russell et al. Oncotarget. .

Abstract

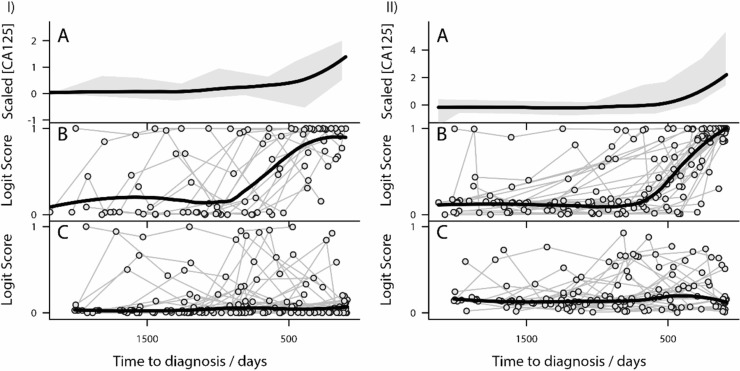
Purpose: Ovarian cancer (OC) is the most lethal gynaecological cancer. Early detection is required to improve patient survival. Risk estimation models were constructed for Type I (Model I) and Type II (Model II) OC from analysis of Protein Z, Fibronectin, C-reactive protein and CA125 levels in prospectively collected samples from the United Kingdom Collaborative Trial of Ovarian Cancer Screening (UKCTOCS).

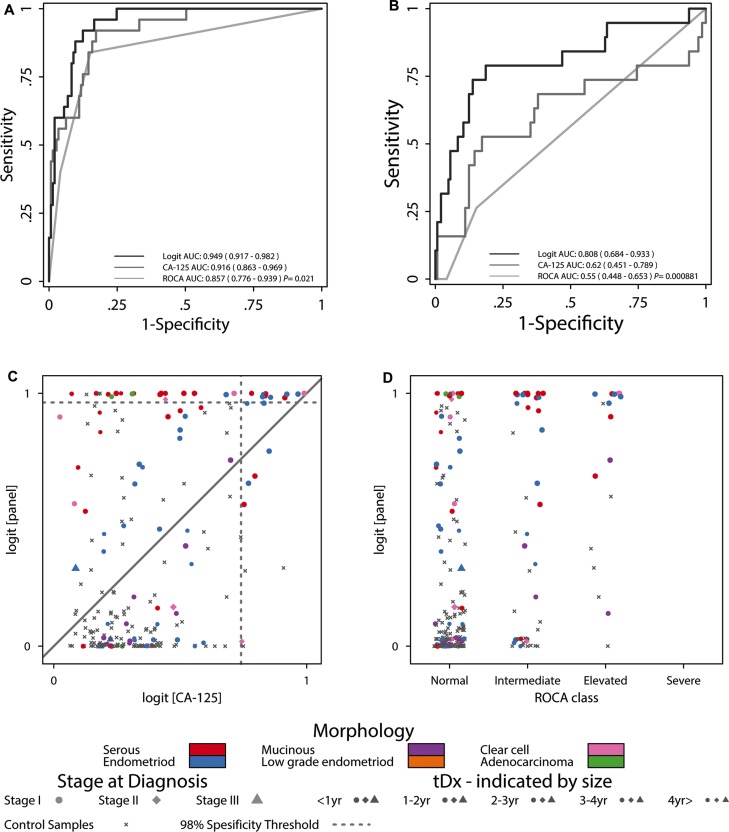
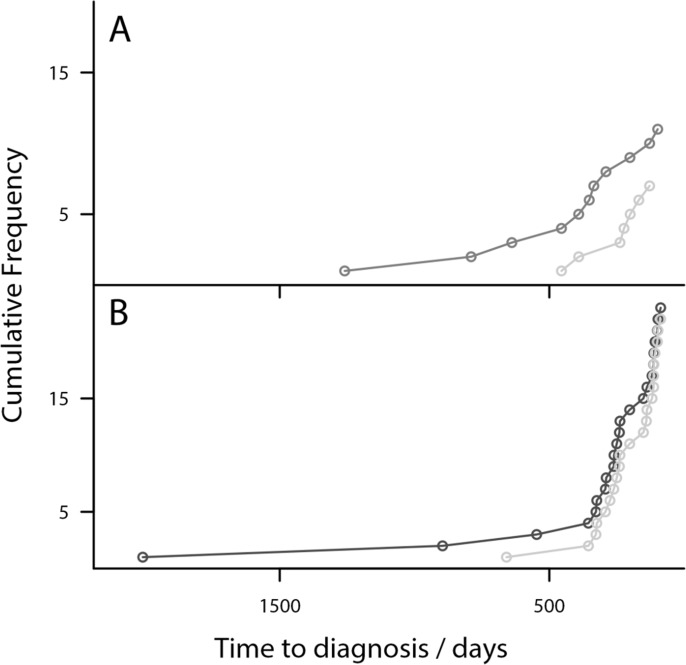
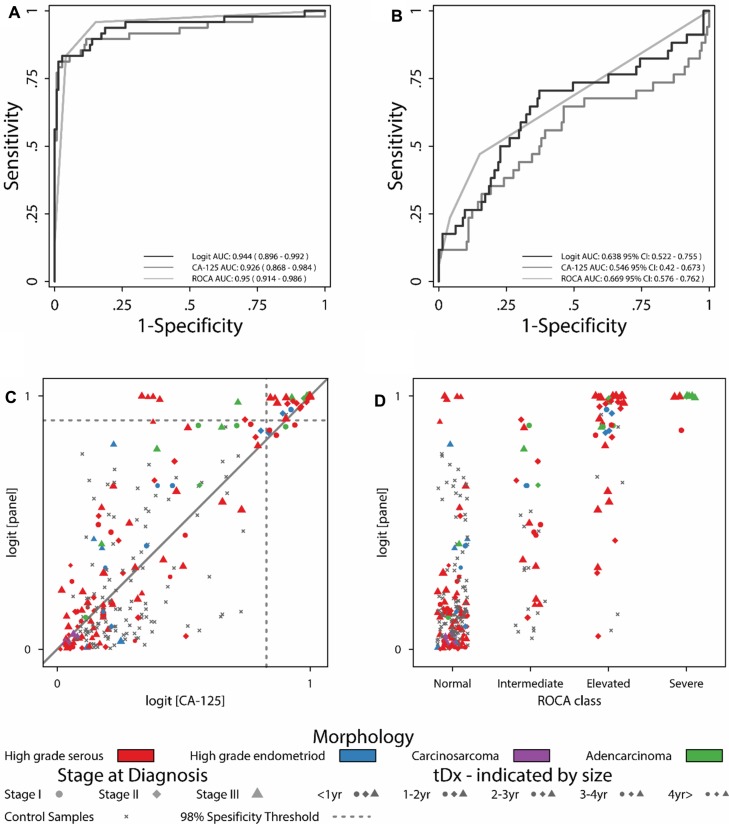
Results: Model I identifies cancers earlier than CA125 alone, with a potential lead time of 3-4 years. Model II detects a number of high grade serous cancers at an earlier stage (Stage I/II) than CA125 alone, with a potential lead time of 2-3 years and assigns high risk to patients that the ROCA Algorithm classified as normal.

Materials and methods: This nested case control study included 418 individual serum samples serially collected from 49 OC cases and 31 controls up to six years pre-diagnosis. Discriminatory logit models were built combining the ELISA results for candidate proteins with CA125 levels.

Conclusions: These models have encouraging sensitivities for detecting pre-clinical ovarian cancer, demonstrating improved sensitivity compared to CA125 alone. In addition we demonstrate how the models improve on ROCA for some cases and outline their potential future use as clinical tools.

Keywords: UKCTOCS; early detection; logit; ovarian cancer; risk estimation.


Conflict of interest statement

CONFLICTS OF INTEREST

The authors declare the following potential conflicts of interest. Both I.J. and U.M. have a financial interest through UCL Business and Abcodia Ltd in the commercial use of UKCTOCS samples. I.J. is a Non-Executive Director and Consultant to Abcodia Ltd and a Director of Women's Health Specialists Ltd. I.J. is a co-inventor of the ROCA algorithm and has rights to a potential royalty stream from the owners of the algorithm MGH and QMUL universities.

Figures

Figure 1
Figure 1. Risk models outperform CA125 for Type I and Type II ovarian cancer
(I) Analysis of Type I ovarian cancer patients (IA) Loess linear regression analysis of trends in CA125 levels in Type I subjects. The grey shaded areas represent a moving estimate of the 80% percentile range of expression. The thick black line represents the trend in the data identified by the Lowess analysis. (IB) Lowess linear regression analysis of the Model I for Type I subjects. Ovarian cancer patients are represented by circles and individual patient levels over time are shown by connected circle. The thick black line represents the trend in the data identified by the Loess analysis. Notice the dramatic and sequential rise in risk estimate as Type I subjects approach diagnosis. (IC) Lowess linear regression analysis of Model I for control subjects. Control patients are represented by circles and individual patient levels over time are shown by connected circle. The thick black line represents the trend in the data identified by the Lowess analysis. (II) Analysis of Type II ovarian cancer patients (IIA) Lowess linear regression analysis of trends in CA125 levels in Type II subjects. The grey shaded area represents a moving estimate of the 80% percentile range of expression. The thick black line represents the trend in the data identified by the Lowess analysis. (IIB) Lowess linear regression analysis of Model II for Type II subjects. Ovarian cancer patients are represented by circles and individual patient levels over time are shown by connected circle. The thick black line represents the trend in the data identified by the Loess analysis. Notice the dramatic and sequential rise in risk estimate as Type II subjects approach diagnosis. (IIC) Lowess linear regression analysis of the Model II for control subjects. Control patients are represented by circles and individual patient levels over time are shown by connected circle. The thick black line represents the trend in the data identified by the Lowess analysis.
Figure 2
Figure 2. Model I performance compared to CA125 and ROCA
(A) Type-I ROC curves for less than one year tDx. (B) Type-I ROC curves for one to two years tDx. (C) Comparisons between Model I scores and logitCA125. (D) Comparisons between Model I scores and ROCA.
Figure 3
Figure 3. Risk Models detect OC earlier than CA125-Plot showing the cumulative diagnosis of OC cases
(A) Model I diagnosis of Type I cases (grey) compared to logitCA125 (light grey). (B) Model II diagnosis of Type II cases (black) compared with logitCA125 (light grey). Model I diagnoses cases substantially earlier than logitCA125. Model II diagnoses several samples earlier than logitCA125.
Figure 4
Figure 4. Model II performance compared to CA125 and ROCA
(A) Type-II ROC curves for less than one year tDx. (B) Type-II ROC curves for one to two years tDx. (C) Comparisons between Model II scores and logitCA125. (D) Comparisons between Model II scores and ROCA.
Figure 5
Figure 5. Risk Models detect OC earlier than CA125 in triage algorithm- Plot of the cumulative diagnosis of OC cases using the triage algorithm
(A) Type I cases only (grey), (B) Type II cases only (grey) and (C) Combined OC cases (grey), plotted against the CA125 > 35 U/mL clinical threshold (light grey). For Type I cases the algorithm identifies many more samples at much earlier time points. For Type II cases the algorithm also detects OC cases much earlier than the CA125 threshold. The patterns continue for combined OC.

Similar articles

Cited by

References

    1. Kurman RJ, Shih I-M. The Origin and Pathogenesis of Epithelial Ovarian Cancer-a Proposed Unifying Theory. Am J Surg Pathol. 2010;34:433–443. - PMC - PubMed
    1. Shih I-M, Kurman RJ. Ovarian Tumorigenesis: A Proposed Model Based on Morphological and Molecular Genetic Analysis. Am J Pathol. 2004;164:1511–1518. - PMC - PubMed
    1. Hüttenhain R, Soste M, Selevsek N, Röst H, Sethi A, Carapito C, Farrah T, Deutsch EW, Kusebauch U, Moritz RL, Niméus-Malmström E, Rinner O, Aebersold R. Reproducible Quantification of Cancer-Associated Proteins in Body Fluids Using Targeted Proteomics. Sci Transl Med. 2012;4:142ra194. - PMC - PubMed
    1. Nolen BM, Lokshin AE. Protein biomarkers of ovarian cancer: the forest and the trees. Future Oncol. 2011;8:55–71. - PMC - PubMed
    1. CRUK Ovarian Cancer Survival statistics

Substances