. 2017 Jan 3;8(1):1508-1528.
doi: 10.18632/oncotarget.13649.

GDF15 contributes to radioresistance and cancer stemness of head and neck cancer by regulating cellular reactive oxygen species via a SMAD-associated signaling pathway

Affiliations

GDF15 contributes to radioresistance and cancer stemness of head and neck cancer by regulating cellular reactive oxygen species via a SMAD-associated signaling pathway

Yan-Liang Li et al. Oncotarget. .

Abstract

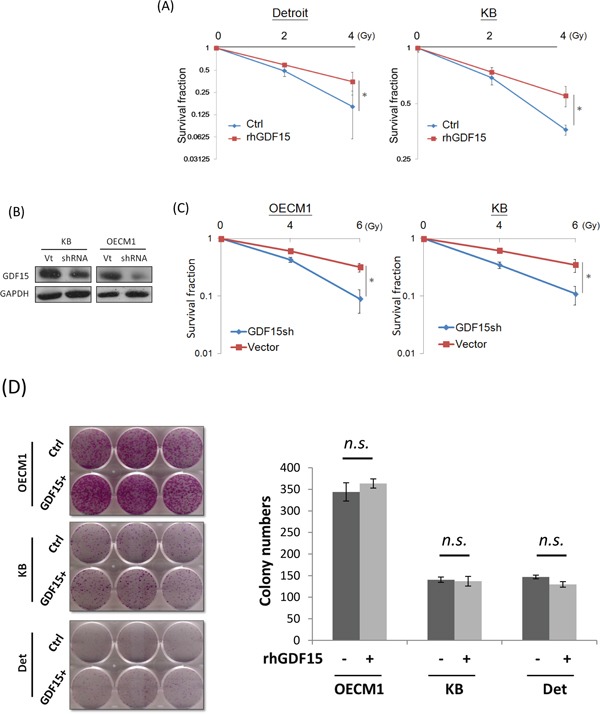
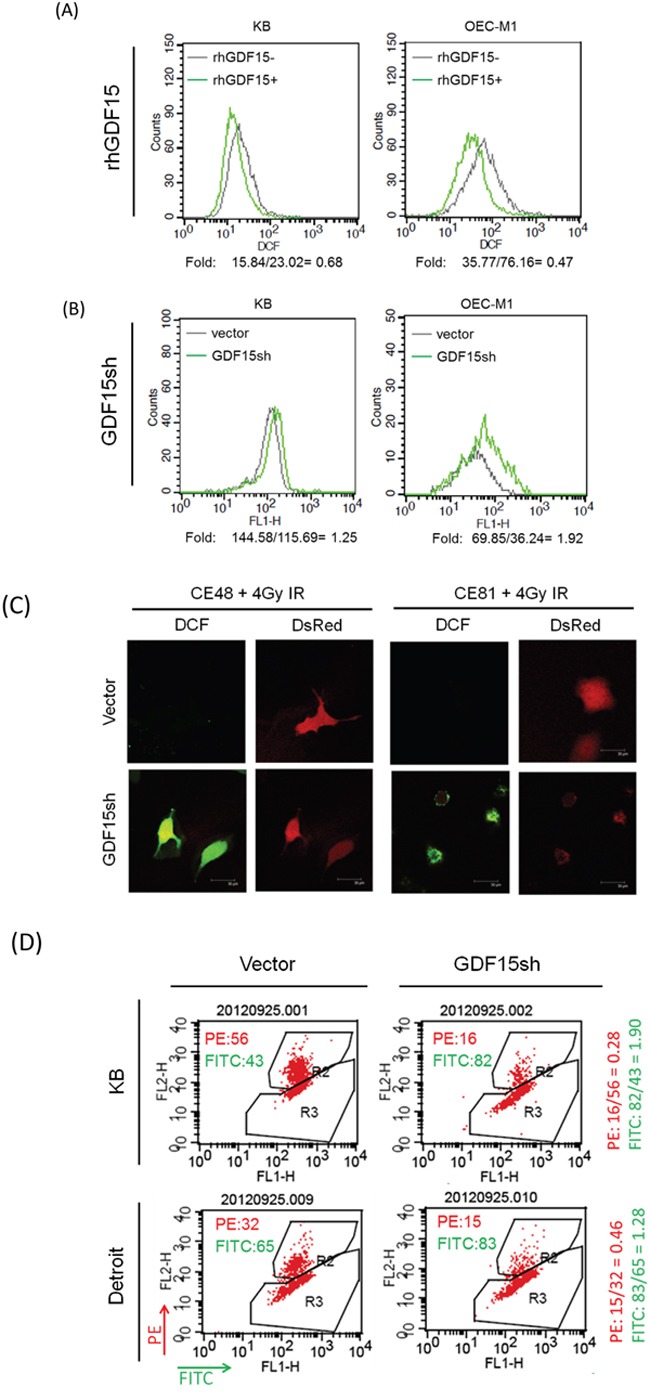
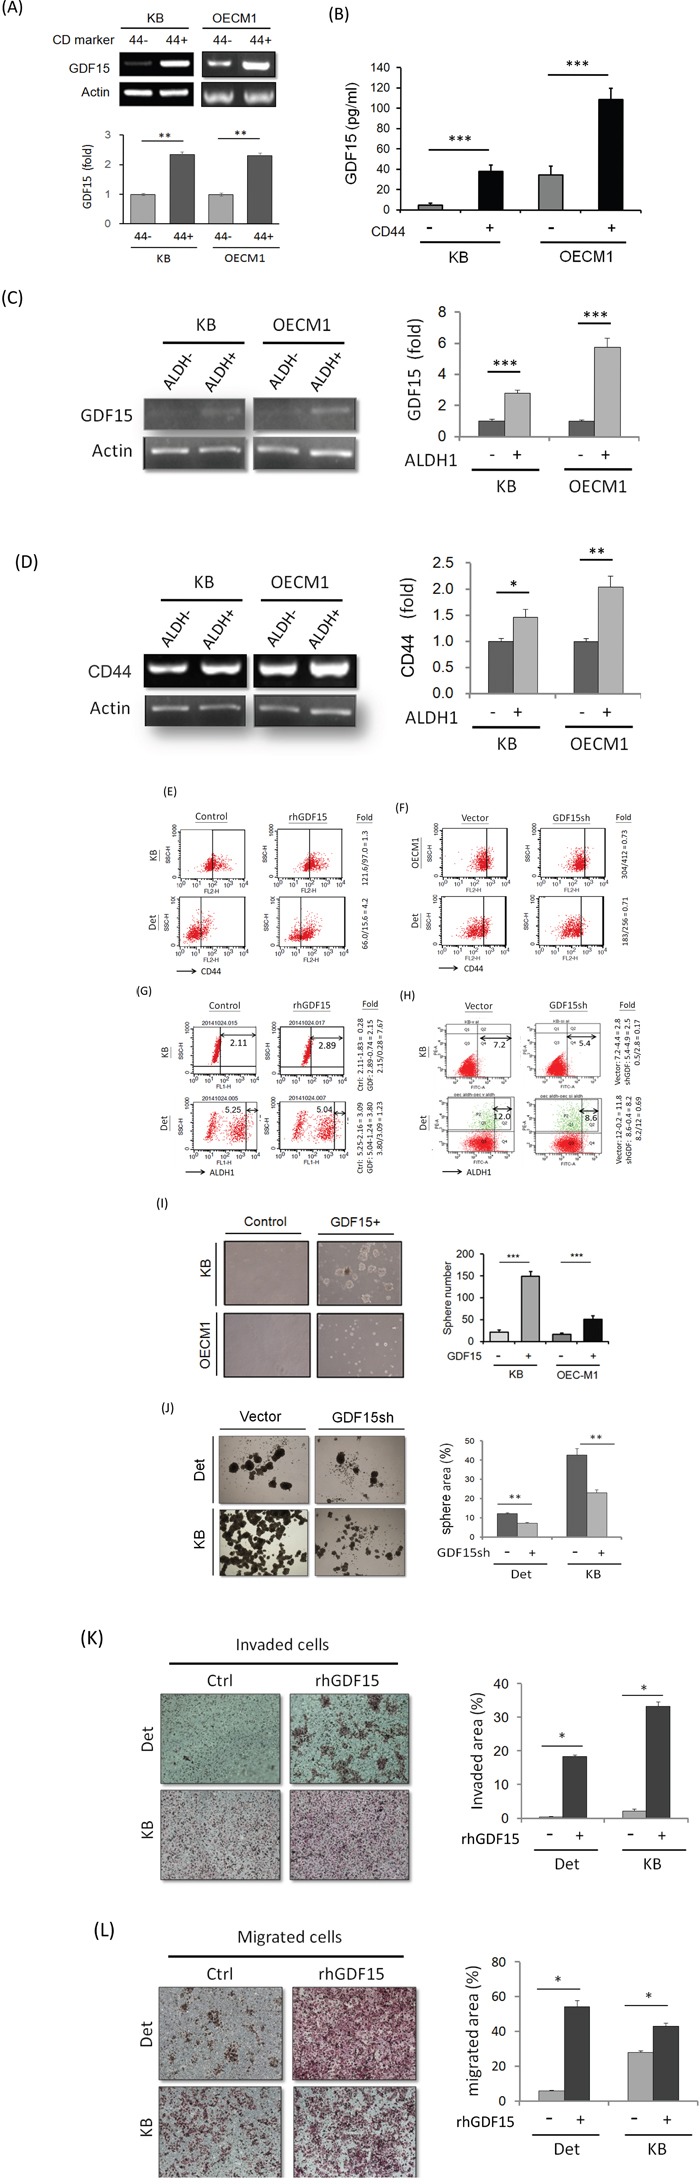
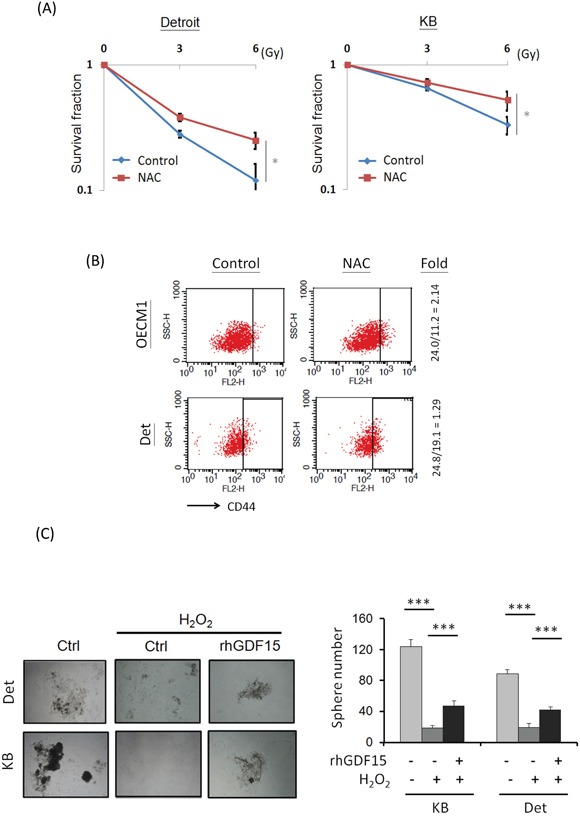
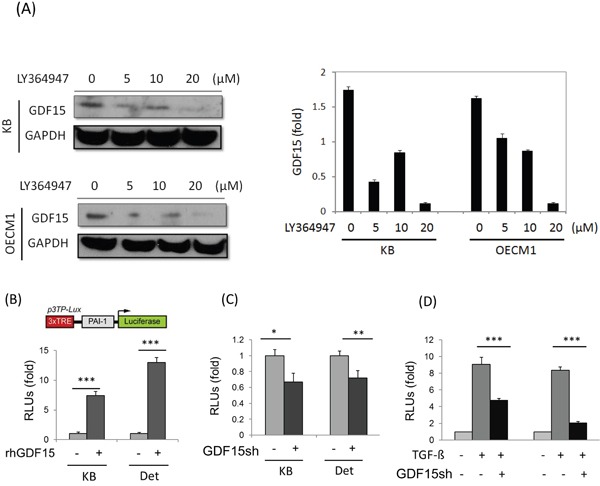
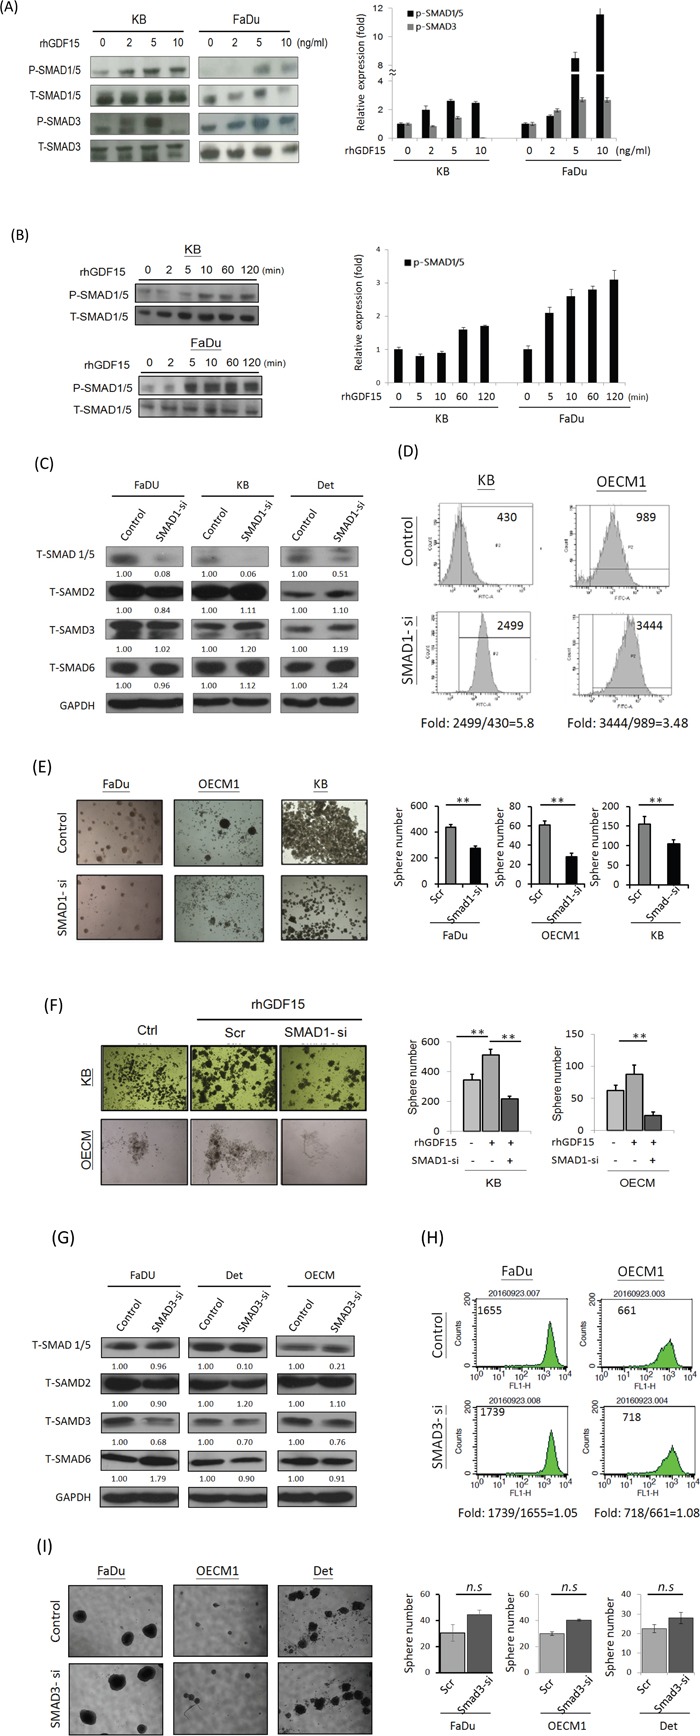
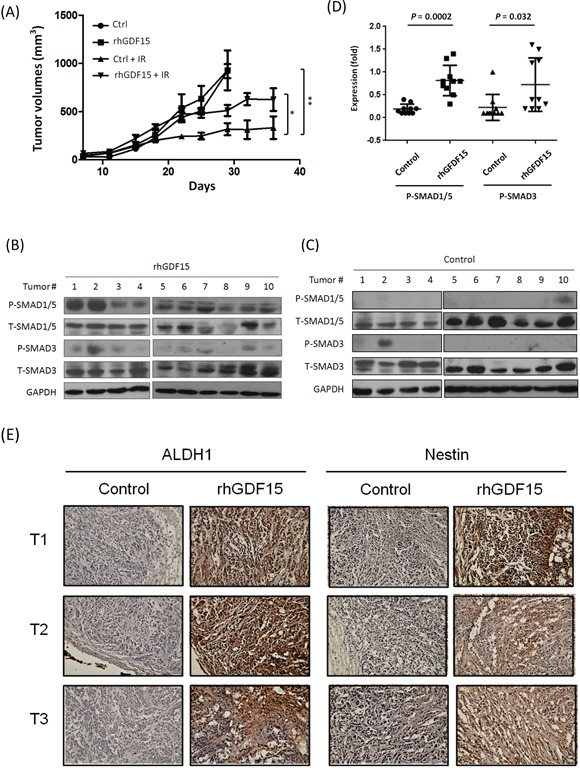
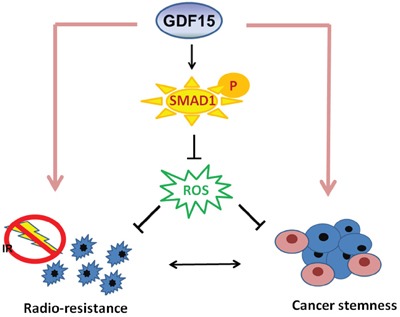
Radiotherapy is an integral part for the treatment of head and neck cancer (HNC), while radioresistance is a major cause leads to treatment failure. GDF15, a member of the TGF-β superfamily, is hypothesized to participate in various types of homeostasis. However, the potential role of this molecule in regulation of radiosensitivity remains unclear. In this study, we demonstrated that GDF15 contributed to radioresistance of HNC, as determined by both gain- and lost-of-functional experiments. These results were achieved by the induction of mitochondrial membrane potential and suppression of intracellular reactive oxygen species (ROS). We further showed that GDF15 facilitated the conversion of cancer stemness, as assessed by the promotion of CD44+ and ALDH1+ cell populations and spheroid cell formation. At molecular level, GDF15 conferred to these cellular functions was through phosphorylated SMAD1 proteins to elite downstream signaling molecules. These cellular results were further confirmed in a tumor xenograft mouse study. Taken together, our results demonstrated that GDF15 contributed to radioresistance and cancer stemness by regulating cellular ROS levels via a SMAD-associated signaling pathway. GDF15 may serve as a prediction marker of radioresistance and a therapeutic target for the development of radio-sensitizing agents for the treatment of refractory HNC.

Keywords: GDF15; cancer stemness; head and neck cancer (HNC); radioresistance; reactive oxygen species (ROS).


Conflict of interest statement

CONFLICTS OF INTEREST

The authors declare no potential conflicts of interest.

Figures

Figure 1
Figure 1. GDF15 contributes to cancer cell radioresistance but not cell growth
A. Administration of rhGDF15 led to radioresistance in two HNC cell lines. Detroit and KB cells were treated with 20 ng/ml rhGDF15 for 5 days and then subjected to various doses of irradiation (0, 2, and 4 Gy). Fourteen days later, the cell colonies were determined by staining with 0.05% crystal violet (n=3). B. GDF15 expression was successfully inhibited after transfection of GDF15-specific shRNA plasmids (GDF15sh) in KB and OECM1 cell lines. After 48 h, cells were harvested for western blot analysis. C. Silencing GDF15 sensitized cells to irradiation in HNC cells. OECM1 and KB cells were transfected with GDF15sh or the vector plasmids and then subjected to irradiation (0 to 6 Gy). After 14 days, the cell colonies were determined (n=3). D. GDF15 had minimal effect on growth regulation in HNC cells. The OECM1, Detroit and KB cells were treated with or without rhGDF15 (20 ng/ml for 5 days). After 14 days, the cell colonies were determined (n=3). (*: p <0.05, n.s.: non-significance, t-test).
Figure 2
Figure 2. GDF15 suppresses the intracellular reactive oxygen species levels by altering the mitochondrial membrane potential
A. Administration of rhGDF15 suppressed intracellular ROS level in HNC cells. KB and OECM1 cells were treated with 20 ng/ml of rhGDF15 for 5 days. After staining with DCF dye, the cells were subjected to flow cytometric analysis to determine the intracellular ROS levels. All values are presented as fluorescence intensity. B. GDF15 silencing increased ROS production in HNC cells. After transfection with GDF15sh or the vector plasmids, the KB and OECM1 cells were stained with DCF dye and subjected to flow cytometric analysis. C. GDF15 silencing increased ROS production in esophageal cancer cells. CE48T/VGH and CE81T/VGH cells were co-transfected with DsRed and GDF15sh/vector plasmids and then subjected to 4 Gy of irradiation. After staining with DCF dye, the cells were subjected to confocal microscopy. D. GDF15 silencing reduced mitochondrial membrane potential and led to apoptosis in HNC cells. KB or Detroit cells were transfected with the GDF15sh or the vector plasmids for 48 h. After incubating with MitoCapture reagents, the cells were subjected to flow cytometry analysis. The PE fluorescence fraction represents healthy cells, and the FITC fraction represents apoptotic cells.
Figure 3
Figure 3. GDF15 promotes cancer stemness via facilitation of CD44+ and ALDH1+ cell populations
A. Elevation of GDF15 mRNA expressions in CD44+ sorted cells compared to the CD44- cells in both KB and OECM1 cell lines, as determined by RT-PCR method (n=3). B. Elevation of GDF15 protein levels in the conditional medium of CD44+ sorted cells compared to the CD44- cells in both KB and OECM1 cell lines, as determined by ELISA method (n=3). C. Elevation of GDF15 mRNA expressions in ALDH1+ sorted cells compared to the ALDH1- cells in both KB and OECM1 cell lines, as determined by RT-PCR method (n=3). D. Elevation of CD44 mRNA expressions in ALDH1+ sorted cells compared to the ALDH1- cells in both KB and OECM1 cell lines, as determined by RT-PCR method (n=3). E. Elevation of CD44+ population in rhGDF15 treated cells compared to non-treated cells in both KB and Detroit cell lines, as determined by FACS method. F. Reduction of CD44+ population in GDF15sh transfected cells in both KB and Detroit cell lines, as determined by FACS method. G. Elevation of ALDH1+ population in rhGDF15 treated cells in both KB and Detroit cell lines, as determined by FACS method. H. Reduction of ALDH1+ population in GDF15sh transfected cells in both KB and Detroit cell lines, as determined by FACS method. I. Enhancement of spheroid cell formation in the GDF15+ sorted cells compared to GDF15- cells in both KB and OECM1 cell lines (n=3). J. Reduction of spheroid cell formation in GDF15sh transfected cells in both Detroit and KB cell lines (n=3). K. Increase of invasion ability in the rhGDF15 treated cells compared to non-treated cells (control) in both Detroit and KB cell lines (n=3). L. Increase of migration ability in the rhGDF15 treated cells compared to non-treated cells (control) in both Detroit and KB cell lines (n=3). (*: p<0.05, **: p<0.01, ***: p<0.001, n.s.: non-significance, t-test).
Figure 4
Figure 4. GDF15 modulates cellular ROS levels to promote cancer stemness
A. Treatment of antioxidant agent led to radioresistance in HNC cells. After treatment of 10 μM N-acetylcysteine (NAC) for 48 h, Detroit or KB cells were subjected to serial dose of irradiation (0 to 6 Gy). Fourteen days later, the numbers of surviving cell colonies were determined (n=3). B. Treatment of antioxidant agent increase CD44+ cell population. After treatment of 10 μM NAC for 48 h, the OECM1 or KB cells were subjected to flow cytometry analysis for CD44+ populations. C. GDF15 reversed the effects of ROS in the suppression of spheroid cell formation. Detroit or KB cells were treated with H2O2 (5 μM) with or without addition of rhGDF15 (20 ng/ml) for 48 h. These cells were then incubated in the spheroid cell culture condition and assessed after 14 days (n=3). (*: p < 0.05, **: p < 0.01, ***: p < 0.001, t-test).
Figure 5
Figure 5. GDF15 regulates cellular functions through similar downstream pathway of TGF-β
A. GDF15 expression was reduced after treatment of TGF-β inhibitor. KB and OECM1 cells were treated with serial doses of LY364947 (5 to 20 μM) for 24 h. Cellular protein was extracted and subjected to western blot analysis to assess GDF15 protein expression. B. Administration of rhGDF15 increased TGF-β downstream molecule PAI-1 luciferase reporter activity. KB or Detroit cells were transfected with luciferase reporter plasmid carrying PAI-1 gene, with or without addition of rhGDF15 (20 ng/ml). After 48 h, cells were harvested for measurements of luciferase activity (n=3). C. Silencing rhGDF15 suppressed PAI-1 luciferase reporter activity. KB or Detroit cells were transfected with luciferase reporter plasmid carrying PAI-1 gene, with or without co-transfection of GDF15sh plasmid. After 48 h, cells were harvested for measurements of luciferase activity (n=3). D. PAI-1 expression induced by TGF-β was suppressed following GDF15 silencing. KB or Detroit cells were transfected with luciferase reporter plasmid carrying PAI-1 gene, with or without addition of rhGDF15 (20 ng/ml), or with or without co-transfection of GDF15sh plasmid. After 48 h, cells were harvested for measurements of luciferase activity (n=3). (*: p < 0.05, **: p < 0.01, ***: p < 0.001, t-test).
Figure 6
Figure 6. GDF15 regulates cellular functions via a SMAD-associated signaling pathway
A, B. Administration of rhGDF15 increased the phosphorylated forms of SMAD family proteins in HNC cells. KB or FaDu cells were treated with serial doses of rhGDF15 (0-10 ng/ml) for 15 min (A) or 5 ng/ml rhGDF15 for various times (0-120 min) (n=3). (B) The cellular proteins were extracted and subjected to western blot analysis for SMAD family protein expressions (n=3). C. Effects of SMAD1-siRNA on the expressions of SMAD family proteins. After transfection of SMAD1-specific siRNA or the scramble oligonucleotides in HNC cells for 48h, cellular proteins were extracted for western blot analysis. GAPDH protein was used as an internal control (n=3). D. Silencing SMAD1 increased ROS level in HNC cells. KB or OECM1 cells were transfected SMAD1 specific siRNA or the scramble oligonucleotides for 48 h. After treating cells with 10 μM H2O2 for 20 min, the Intracellular ROS levels were determined by DCF dye staining and analyzed with flow cytometry. E. Silencing SMAD1 suppressed spheroid cell formation in HNC cells. Fadu, OECM1 or KB cells were transfected SMAD1 specific siRNA or the scramble oligonucleotides for 48 h. These cells were then incubated in the spheroid cell culture condition and assessed after 14 days (n=3). F. The spheroid cell formation promoted by GDF15 was inhibited in SMAD knockdown HNC cells. KB or OECM1 cells were transfected SMAD1 specific siRNA or the scramble oligonucleotides for 48 h, with the addition of rhGDF15 (20 ng/ml). These cells were then incubated in the spheroid cell culture condition and assessed after 14 days (n=3). G. Effects of SMAD3-siRNA on the expressions of SMAD family proteins. After transfection of SMAD3-specific siRNA or the scramble oligonucleotides in HNC cells for 48h, cellular proteins were extracted for western blot analysis. GAPDH protein was used as an internal control (n=3). H. Silencing SMAD3 had no effect on ROS level in HNC cells. Fadu or OECM1 cells were transfected SMAD3-specific siRNA or the scramble oligonucleotides for 48 h. After treating cells with 10 μM H2O2 for 20 min, the Intracellular ROS levels were determined by DCF dye staining and analyzed with flow cytometry. I. Silencing SMAD3 had no significant effect on spheroid cell formation in HNC cells. Fadu, OECM1 or Detroit cells were transfected SMAD3 specific siRNA or the scramble oligonucleotides for 48 h, with the addition of rhGDF15 (20 ng/ml). After 14 days of incubation in the spheroid cell culture condition, cells were assessed for spheroid formation (n=3). (*: p < 0.05, **: p < 0.01, ***: p < 0.001, n.s.: non-significance, t-test).
Figure 7
Figure 7. GDF15 promotes radioresistant tumors in mice, along with SMAD activation and stemness conversion
A total of 4×106 KB cells, with or without pre-treatment with the rhGDF15 protein (20 ng/ml for 5 days), were subcutaneously injected into BALB/c mice (10 mice each group) in the upper portion of the hind limb. At day 14, each group was randomly divided into two groups (5 mice per group), with or without receiving 2 Gy of irradiation, followed by repeated irradiation of the same dose twice a week for a total of 8 Gy. A. Tumor volume was measured twice a week and calculated as (length x width x height) for 36 days. B-D. The tumors in the group of irradiation, either with or without pre-treatment of rhGDF15, were dissected. The protein expression levels of SMAD family molecules in the rhGDF15 treatment tumor group (B) or the control groups (C) were determined by using western blot analysis, and quantified the relative expression levels after normalized with GAPDH (D). E. The expression levels of ALDH1 and Nestin in tumor tissues were determined by using IHC analysis. Three tumor sections of IHC staining were shown for examples (*: p < 0.05, **: p < 0.01, ***: p < 0.001, t-test).
Figure 8
Figure 8. Diagram of the mechanism by which GDF15 contributes to radioresistance and cancer stemness through regulating ROS levels via a SMAD-associated pathway

References

    1. Saman DM. A review of the epidemiology of oral and pharyngeal carcinoma: update. Head Neck Oncol. 2012;4:1. - PMC - PubMed
    1. Chen YJ, Chang JT, Liao CT, Wang HM, Yen TC, Chiu CC, Lu YC, Li HF, Cheng AJ. Head and neck cancer in the betel quid chewing area: recent advances in molecular carcinogenesis. Cancer Sci. 2008;99:1507–14. - PMC - PubMed
    1. Stucken E, Weissman J, Spiegel JH. Oral cavity risk factors: experts' opinions and literature support. J Otolaryngol Head Neck Surg. 2010;39:76–89. - PubMed
    1. Higgins GS1, O'Cathail SM2, Muschel RJ3, McKenna WG. Drug radiotherapy combinations: Review of previous failures and reasons for future optimism. Cancer Treat Rev. 2015;41:105–13. - PubMed
    1. Klein J, Livergant J, Ringash J. Health related quality of life in head and neck cancer treated with radiation therapy with or without chemotherapy: a systematic review. Oral Oncol. 2014;50:254–62. - PubMed