

Mapping heterogeneity in patient-derived melanoma cultures by single-cell RNA-seq
- PMID: 27903987
- PMCID: PMC5352202
- DOI: 10.18632/oncotarget.13666
Mapping heterogeneity in patient-derived melanoma cultures by single-cell RNA-seq
Abstract
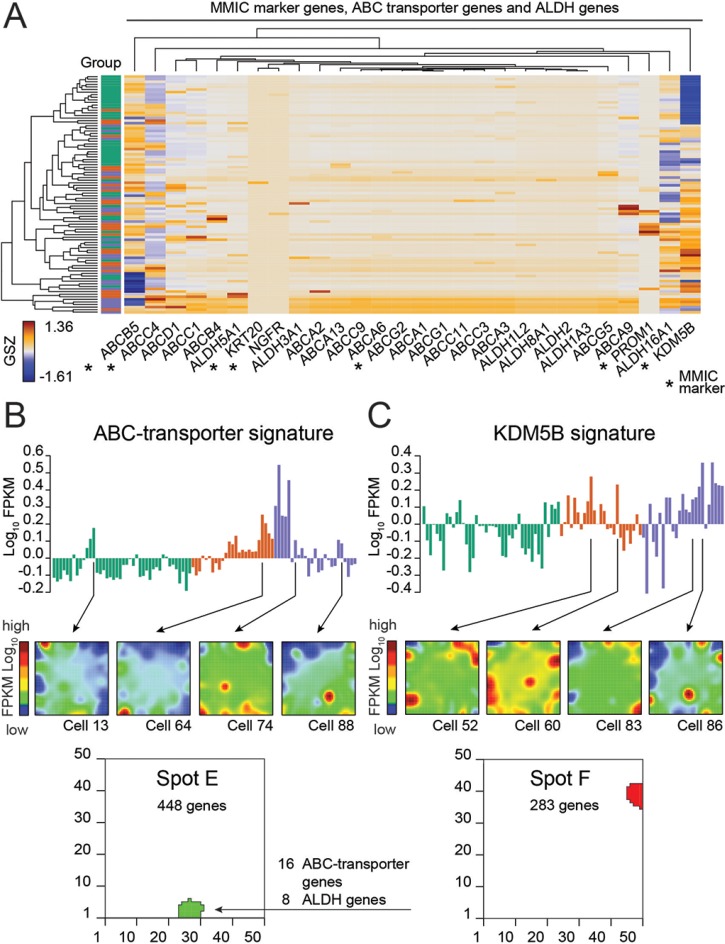
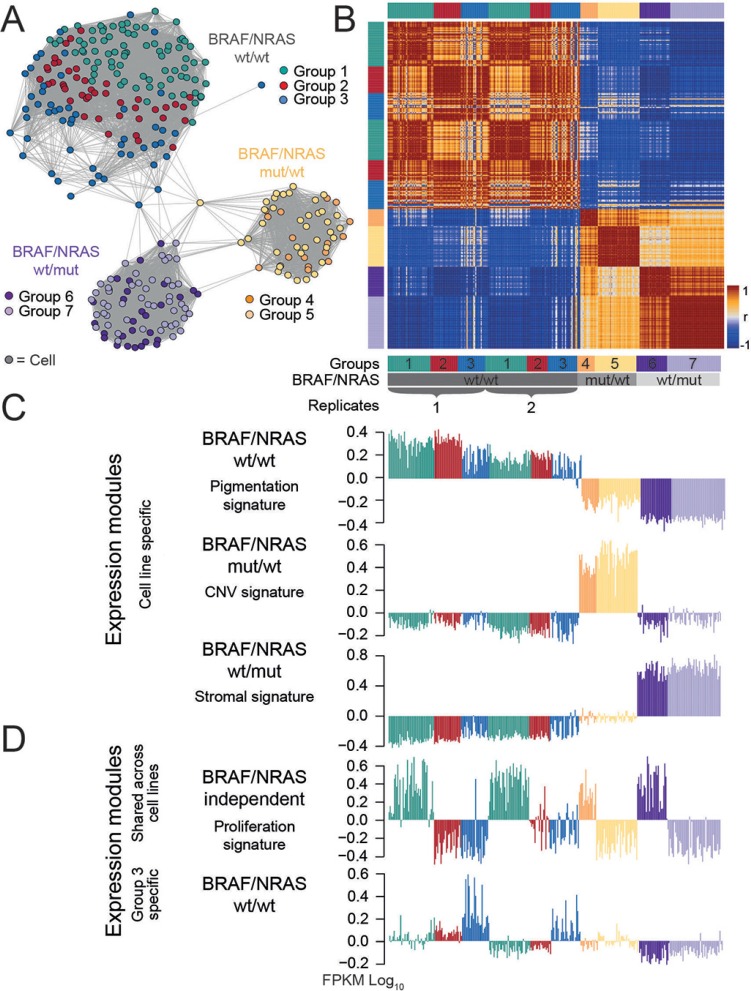
Recent technological advances in single-cell genomics make it possible to analyze cellular heterogeneity of tumor samples. Here, we applied single-cell RNA-seq to measure the transcriptomes of 307 single cells cultured from three biopsies of three different patients with a BRAF/NRAS wild type, BRAF mutant/NRAS wild type and BRAF wild type/NRAS mutant melanoma metastasis, respectively. Analysis based on self-organizing maps identified sub-populations defined by multiple gene expression modules involved in proliferation, oxidative phosphorylation, pigmentation and cellular stroma. Gene expression modules had prognostic relevance when compared with gene expression data from published melanoma samples and patient survival data. We surveyed kinome expression patterns across sub-populations of the BRAF/NRAS wild type sample and found that CDK4 and CDK2 were consistently highly expressed in the majority of cells, suggesting that these kinases might be involved in melanoma progression. Treatment of cells with the CDK4 inhibitor palbociclib restricted cell proliferation to a similar, and in some cases greater, extent than MAPK inhibitors. Finally, we identified a low abundant sub-population in this sample that highly expressed a module containing ABC transporter ABCB5, surface markers CD271 and CD133, and multiple aldehyde dehydrogenases (ALDHs). Patient-derived cultures of the BRAF mutant/NRAS wild type and BRAF wild type/NRAS mutant metastases showed more homogeneous single-cell gene expression patterns with gene expression modules for proliferation and ABC transporters. Taken together, our results describe an intertumor and intratumor heterogeneity in melanoma short-term cultures which might be relevant for patient survival, and suggest promising targets for new treatment approaches in melanoma therapy.
Keywords: melanoma; single cell transcriptome sequencing; stem cells.
Conflict of interest statement
M. Kunz has received honoraria from the Speakers Bureau of Roche Pharma and travel support from Novartis Pharma GmbH and Bristol-Myers Squibb GmbH. D. Schadendorf has received personal fees from Roche, Novartis, GSK, Merck and Bristol-Myers Squibb, Amgen, Boehringer Ingelheim and Leo Pharma. All other authors declare no conflict of interest.
Figures


Similar articles
-
MAPK Pathway and TERT Promoter Gene Mutation Pattern and Its Prognostic Value in Melanoma Patients: A Retrospective Study of 2,793 Cases.Clin Cancer Res. 2017 Oct 15;23(20):6120-6127. doi: 10.1158/1078-0432.CCR-17-0980. Epub 2017 Jul 18. Clin Cancer Res. 2017. PMID: 28720667
-
The clinical significance of BRAF and NRAS mutations in a clinic-based metastatic melanoma cohort.Br J Dermatol. 2013 Nov;169(5):1049-55. doi: 10.1111/bjd.12504. Br J Dermatol. 2013. PMID: 23855428
-
Kinase inhibitor screening identifies CDK4 as a potential therapeutic target for melanoma.Int J Oncol. 2015 Sep;47(3):900-8. doi: 10.3892/ijo.2015.3097. Epub 2015 Jul 21. Int J Oncol. 2015. PMID: 26201960 Free PMC article.
-
BRAF Heterogeneity in Melanoma.Curr Treat Options Oncol. 2021 Feb 8;22(3):20. doi: 10.1007/s11864-021-00818-3. Curr Treat Options Oncol. 2021. PMID: 33558987 Review.
-
Targeting NRAS in melanoma.Cancer J. 2012 Mar-Apr;18(2):132-6. doi: 10.1097/PPO.0b013e31824ba4df. Cancer J. 2012. PMID: 22453013 Review.
Cited by
-
What are the applications of single-cell RNA sequencing in cancer research: a systematic review.J Exp Clin Cancer Res. 2021 May 11;40(1):163. doi: 10.1186/s13046-021-01955-1. J Exp Clin Cancer Res. 2021. PMID: 33975628 Free PMC article.
-
Cell type identification from single-cell transcriptomes in melanoma.BMC Med Genomics. 2021 Nov 17;14(Suppl 5):263. doi: 10.1186/s12920-021-01118-3. BMC Med Genomics. 2021. PMID: 34784909 Free PMC article.
-
Immune contexture defined by single cell technology for prognosis prediction and immunotherapy guidance in cancer.Cancer Commun (Lond). 2019 Apr 18;39(1):21. doi: 10.1186/s40880-019-0365-9. Cancer Commun (Lond). 2019. PMID: 30999966 Free PMC article. Review.
-
The current landscape of single-cell transcriptomics for cancer immunotherapy.J Exp Med. 2021 Jan 4;218(1):e20201574. doi: 10.1084/jem.20201574. J Exp Med. 2021. PMID: 33601414 Free PMC article. Review.
-
Fate mapping melanoma persister cells through regression and into recurrent disease in adult zebrafish.Dis Model Mech. 2022 Sep 1;15(9):dmm049566. doi: 10.1242/dmm.049566. Epub 2022 Sep 16. Dis Model Mech. 2022. PMID: 35929478 Free PMC article.
References
-
- Sullivan RJ, Flaherty KT. Major therapeutic developments and current challenges in advanced melanoma. Br J Dermatol. 2014;170:36–44. - PubMed
-
- Grimaldi AM, Simeone E, Ascierto PA. The role of MEK inhibitors in the treatment of metastatic melanoma. Curr Opin Oncol. 2014;26:196–203. - PubMed
-
- Long GV, Fung C, Menzies AM, Pupo GM, Carlino MS, Hyman J, Shahheydari H, Tembe V, Thompson JF, Saw RP, Howle J, Hayward NK, Johansson P, et al. Increased MAPK reactivation in early resistance to dabrafenib/trametinib combination therapy of BRAF-mutant metastatic melanoma. Nat Commun. 2014;5:5694. - PubMed
MeSH terms
Substances
LinkOut - more resources
Full Text Sources
Other Literature Sources
Medical
Molecular Biology Databases
Research Materials
Miscellaneous
