

Biostatistics Series Module 6: Correlation and Linear Regression
- PMID: 27904175
- PMCID: PMC5122272
- DOI: 10.4103/0019-5154.193662
Biostatistics Series Module 6: Correlation and Linear Regression
Abstract
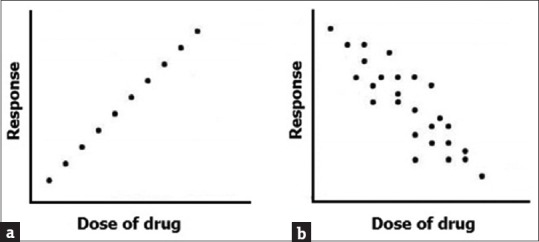
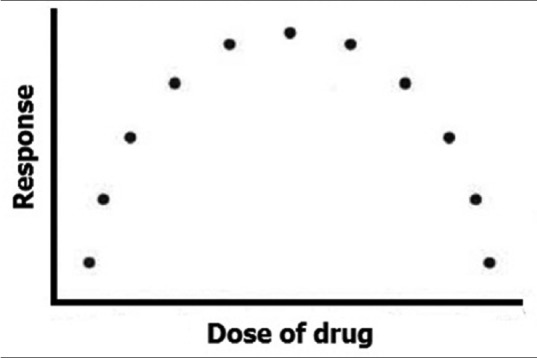
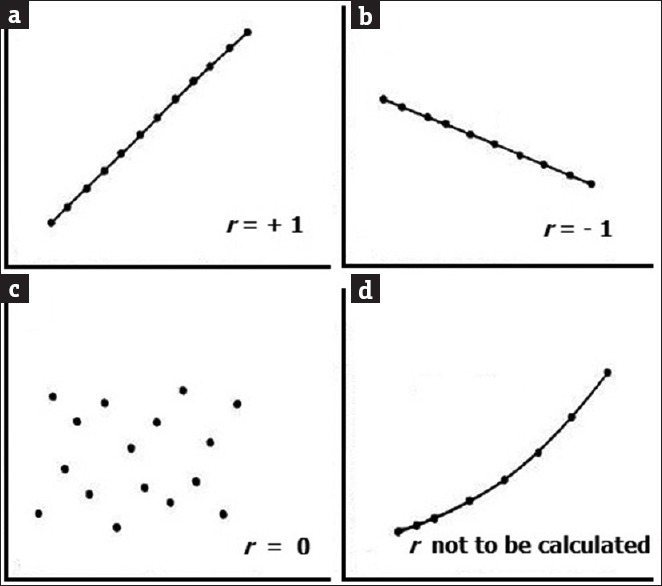
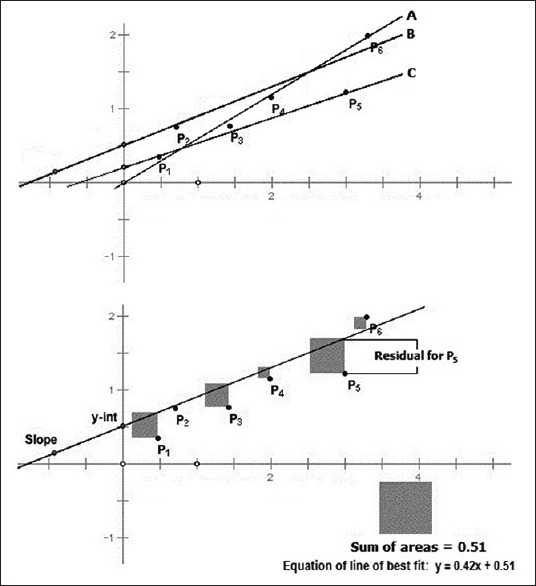
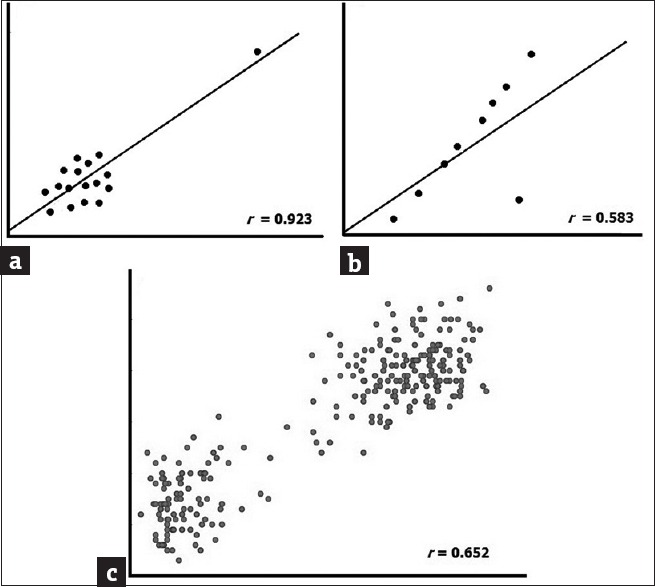
Correlation and linear regression are the most commonly used techniques for quantifying the association between two numeric variables. Correlation quantifies the strength of the linear relationship between paired variables, expressing this as a correlation coefficient. If both variables x and y are normally distributed, we calculate Pearson's correlation coefficient (r). If normality assumption is not met for one or both variables in a correlation analysis, a rank correlation coefficient, such as Spearman's rho (ρ) may be calculated. A hypothesis test of correlation tests whether the linear relationship between the two variables holds in the underlying population, in which case it returns a P < 0.05. A 95% confidence interval of the correlation coefficient can also be calculated for an idea of the correlation in the population. The value r2 denotes the proportion of the variability of the dependent variable y that can be attributed to its linear relation with the independent variable x and is called the coefficient of determination. Linear regression is a technique that attempts to link two correlated variables x and y in the form of a mathematical equation (y = a + bx), such that given the value of one variable the other may be predicted. In general, the method of least squares is applied to obtain the equation of the regression line. Correlation and linear regression analysis are based on certain assumptions pertaining to the data sets. If these assumptions are not met, misleading conclusions may be drawn. The first assumption is that of linear relationship between the two variables. A scatter plot is essential before embarking on any correlation-regression analysis to show that this is indeed the case. Outliers or clustering within data sets can distort the correlation coefficient value. Finally, it is vital to remember that though strong correlation can be a pointer toward causation, the two are not synonymous.
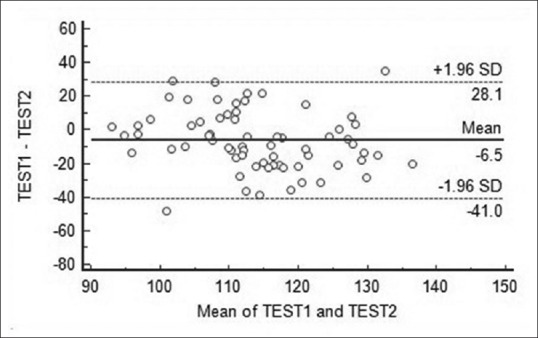
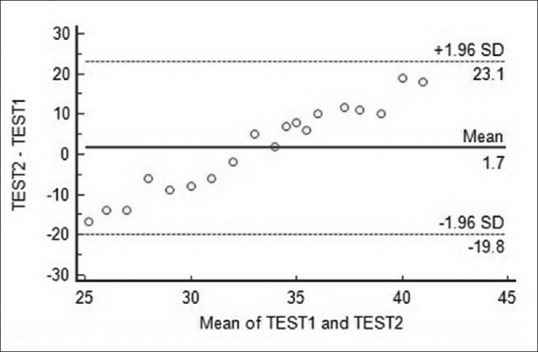
Keywords: Bland–Altman plot; Pearson's r; Spearman's rho; correlation; correlation coefficient; intraclass correlation coefficient; method of least squares; point biserial correlation coefficient; regression.
Conflict of interest statement
There are no conflicts of interest.
Figures
References
-
- Samuels MA, Witmer JA, Schaffner AA, editors. Statistics for the life sciences. 4th ed. Boston: Pearson Education; 2012. Linear regression and correlation; pp. 493–549.
-
- Kirk RE, editor. Statistics: An introduction. 5th ed. Belmont: Thomson Wadsworth; 2008. Correlation; pp. 123–57.
-
- Kirk RE, editor. Statistics: An introduction. 5th ed. Belmont: Thomson Wadsworth; 2001. Regression; pp. 159–81.
-
- Glaser AN, editor. High-yield biostatistics. Baltimore: Lippincott Williams and Wilkins; 2001. Correlational techniques; pp. 50–7.
LinkOut - more resources
Full Text Sources
Other Literature Sources
Miscellaneous