

Comparison of MRI, CT and 18F-FDG PET/CT in the diagnosis of local and metastatic of nasopharyngeal carcinomas: an updated meta analysis of clinical studies
- PMID: 27904660
- PMCID: PMC5126302
Comparison of MRI, CT and 18F-FDG PET/CT in the diagnosis of local and metastatic of nasopharyngeal carcinomas: an updated meta analysis of clinical studies
Abstract
Background: A meta-analysis was conducted to evaluate the accuracy of MRI, CT and FDG PET/CT in TNM stage of nasopharyngeal carcinoma patients (NPC).
Methods: Through a search of studies from 1996 to April 2015, pooled estimated sensitivity, specificity, pooled diagnostic odds ratio (DOR), summary receiver operating characteristic (SROC) curves and Q*-index were calculated.
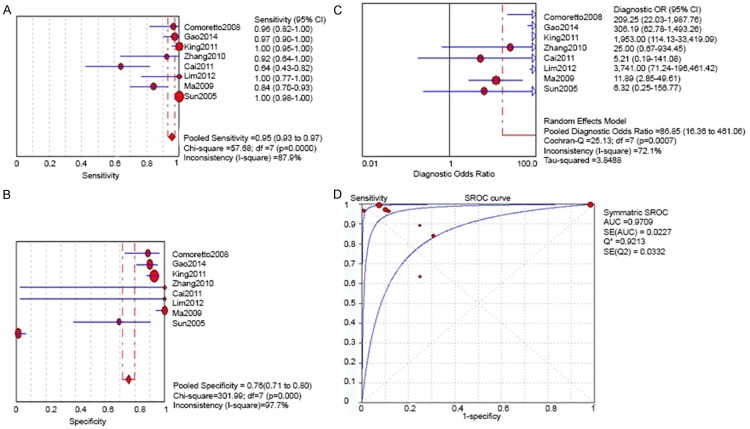
Results: Totally 23 studies were included for analysis. In T stage, the pooled sensitivity, specificity, DOR and SROC of MRI were 0.95 (95% CI 0.93-0.97), 0.76 (95% CI 0.71-0.80), 86.85 (16.36-461.06) and 0.9213 (SE 0.0372) respectively. The pooled sensitivity, specificity, DOR and SROC of CT were 0.84 (95% CI 0.79 to 0.88), 0.80 (95% CI 0.71 to 0.88), 6.32 (1.17 to 34.02) and 0.7215 (SE 0.054) respectively. The pooled sensitivity, specificity, DOR and SROC of FDG PET/CT were 0.85 (95% CI 0.76 to 0.91), 0.91 (95% CI 0.84 to 0.96) and 0.8673 (SE 0.0311). In N stage, the pooled sensitivity, specificity, DOR and SROC of MRI were 0.88 (95% CI 0.85-0.90), 0.95 (95% CI 0.93-0.97), 93.68 (23.21-379.69) and 0.9153 (SE 0.099) respectively. The pooled sensitivity, specificity, DOR and SROC of CT were 0.92 (95% CI 0.88-0.95), 0.93 (0.76-0.99), 93.81 (22.39-393.03) and 0.8872 (SE 0.0520) respectively. The pooled sensitivity, specificity, DOR and SROC of FDG PET/CT were 0.88 (95% CI 0.85-0.90), 0.95 (95% CI 0.93-0.97), 93.88 (23.21-379.69) and 0.9153 (SE 0.0299) respectively. In M stage, the pooled sensitivity and specificity of MRI were 0.53 (95% CI 0.35-0.70) and 0.99 (95% 0.95-1.00). The pooled sensitivity and specificity of CT were 0.80 (95% CI 0.44-0.97) and 0.93 (95% CI 0.86-0.97) respectively. The pooled sensitivity, specificity and SROC of FDG PET/CT were 0.82 (95% 0.74-0.88), 0.98 (95% CI 0.96-0.99) and 0.9002 (SE 0.075) respectively.
Conclusion: The analysis suggested that MRI had good accuracy in diagnosis of T stage. Whereas CT is currently a good performance in diagnosis of N stage, FDG PET/CT shows good accuracy in diagnosis of M stage.
Keywords: CT; FDG PET/CT; MRI; Meta-analysis; nasopharyngeal carcinoma.
Figures


References
-
- Jemal A, Bray F, Center MM, Ferlay J, Ward E, Forman D. Global Cancer statistics. CA Cancer J Clin. 2011;61:69–90. - PubMed
-
- Sham JS, Choy D, Choi PH. Nasopharyngeal carcinoma: the significance of neck node involvement in relation to the pattern of distant failure. Br J Radiol. 1990;63:108–13. - PubMed
-
- Edge SB, Byrd DR, Compton CC, Fritz AG, Green FL, Trotti AM 3rd. AJCC Cancer Staging Manual. 7th ed. New York: Springer; 2009.
-
- NCCN guideline for treatment of cancer by site. Head and neck cancer. http://www.nccn.org/professionals/physician_gls/f_guidelines.asp#site.
-
- Berlin JA. Does blinding of readers affect the results of meta-analyses? University of Pennsylvania Meta-analysis Blinding Study Group. Lancet. 1997;350:85–6. - PubMed
LinkOut - more resources
Full Text Sources
Miscellaneous