

Echo Chambers: Emotional Contagion and Group Polarization on Facebook
- PMID: 27905402
- PMCID: PMC5131349
- DOI: 10.1038/srep37825
Echo Chambers: Emotional Contagion and Group Polarization on Facebook
Abstract
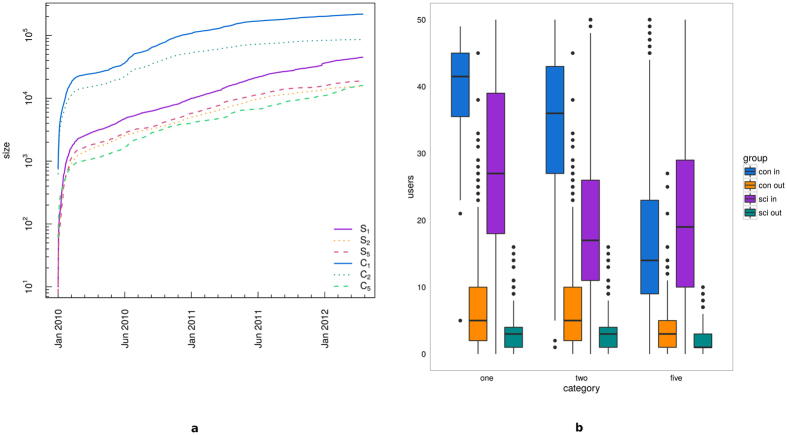
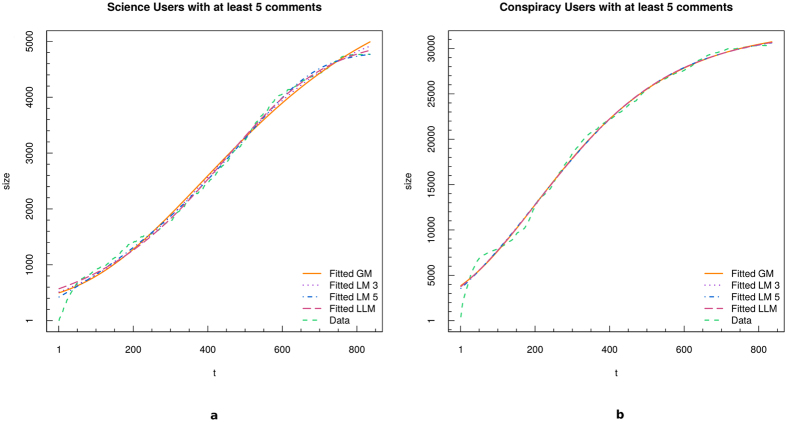
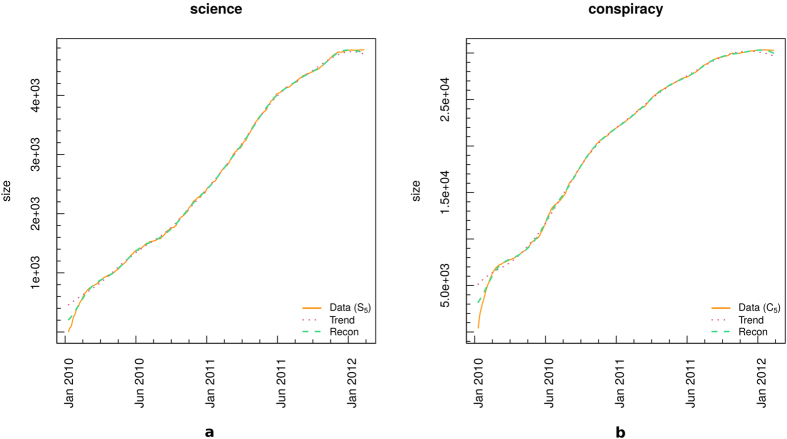
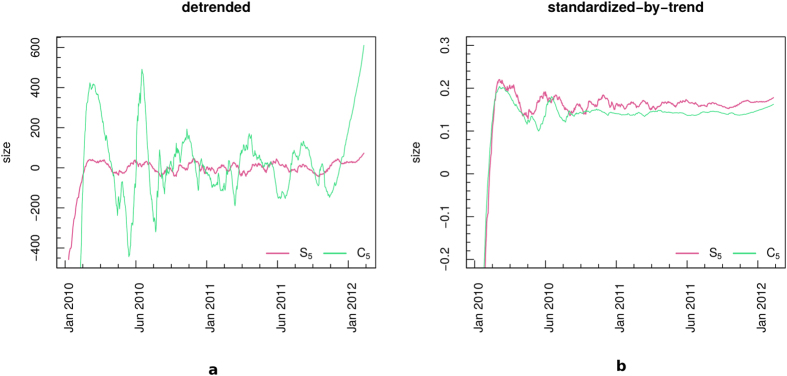
Recent findings showed that users on Facebook tend to select information that adhere to their system of beliefs and to form polarized groups - i.e., echo chambers. Such a tendency dominates information cascades and might affect public debates on social relevant issues. In this work we explore the structural evolution of communities of interest by accounting for users emotions and engagement. Focusing on the Facebook pages reporting on scientific and conspiracy content, we characterize the evolution of the size of the two communities by fitting daily resolution data with three growth models - i.e. the Gompertz model, the Logistic model, and the Log-logistic model. Although all the models appropriately describe the data structure, the Logistic one shows the best fit. Then, we explore the interplay between emotional state and engagement of users in the group dynamics. Our findings show that communities' emotional behavior is affected by the users' involvement inside the echo chamber. Indeed, to an higher involvement corresponds a more negative approach. Moreover, we observe that, on average, more active users show a faster shift towards the negativity than less active ones.
Figures
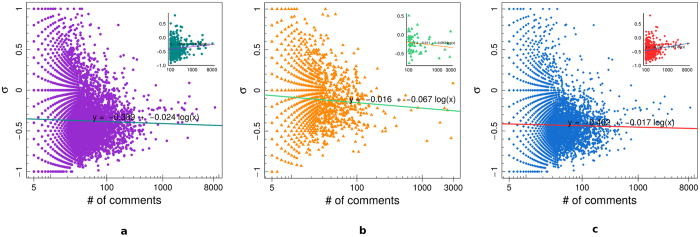
 as a function of the daily community activity for science users (a,c) and conspiracy users (b,d), for all users (a,b) and users with at least 100 comments (c,d).
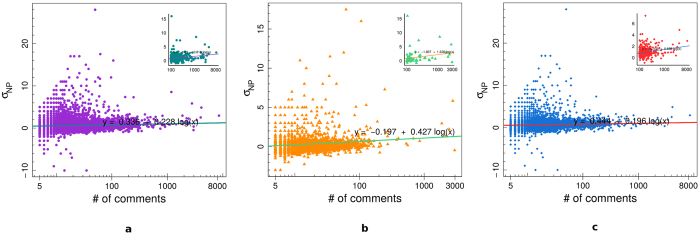
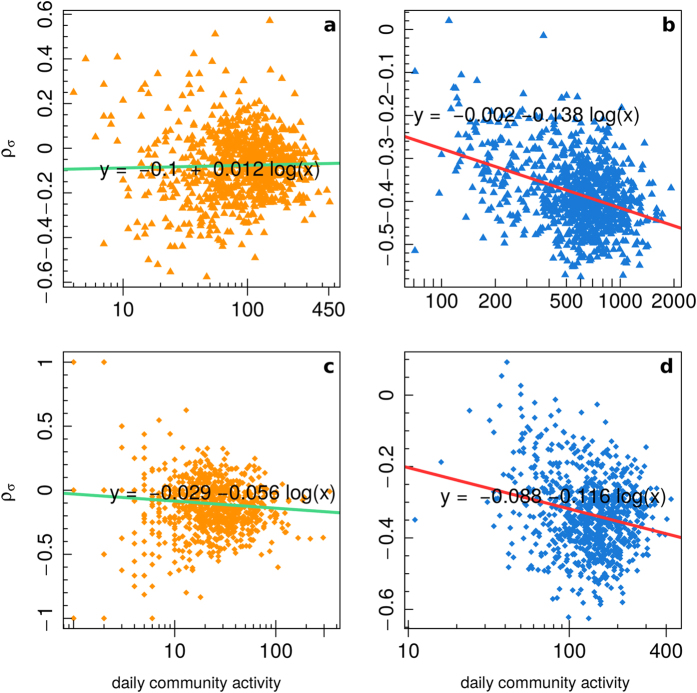
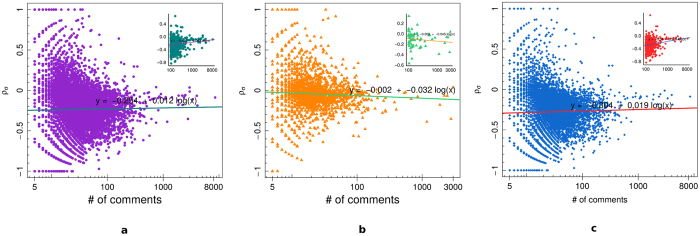
 as a function of the daily community activity for science users (a,c) and conspiracy users (b,d), for all users (a,b) and users with at least 100 comments (c,d).
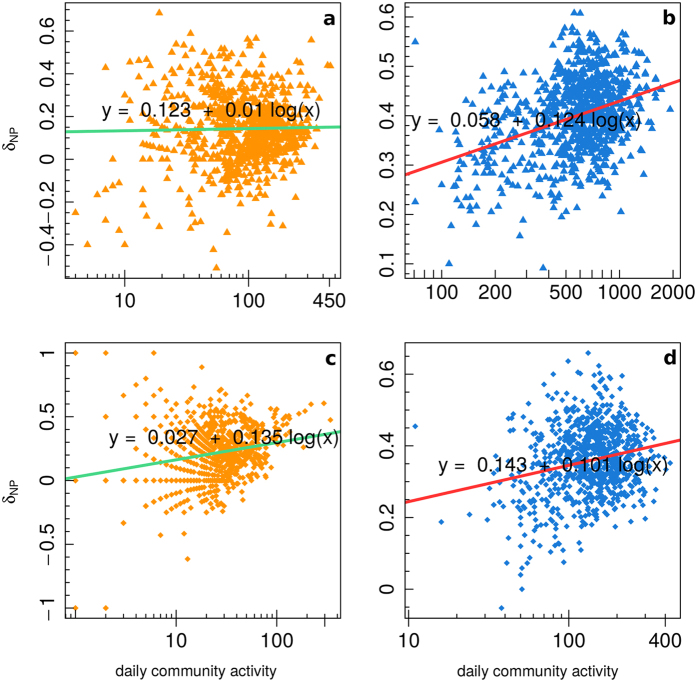
References
-
- Quattrociocchi W. How does misinformation spread online? In WEF Agenda (World Economic Forum, 2016).
-
- Cacciatore M. A., Scheufele D. A. & Iyengar S. The end of framing as we know it… and the future of media effects. Mass Communication and Society 19, 7–23 (2016).
-
- Brown J., Broderick A. J. & Lee N. Word of mouth communication within online communities: Conceptualizing the online social network. Journal of interactive marketing 21, 2–20 (2007).
-
- Kahn R. & Kellner D. New media and internet activism: From the ‘battle of seattle’ to blogging. New media & society 6, 87–95 (2004).
-
- Quattrociocchi W., Conte R. & Lodi E. Opinions manipulation: Media, power and gossip. Advances in Complex Systems 14, 567–586 (2011).
Publication types
MeSH terms
LinkOut - more resources
Full Text Sources
Other Literature Sources
