

Cost and cost-effectiveness of tuberculosis treatment shortening: a model-based analysis
- PMID: 27905897
- PMCID: PMC5131398
- DOI: 10.1186/s12879-016-2064-3
Cost and cost-effectiveness of tuberculosis treatment shortening: a model-based analysis
Abstract
Background: Despite improvements in treatment success rates for tuberculosis (TB), current six-month regimen duration remains a challenge for many National TB Programmes, health systems, and patients. There is increasing investment in the development of shortened regimens with a number of candidates in phase 3 trials.
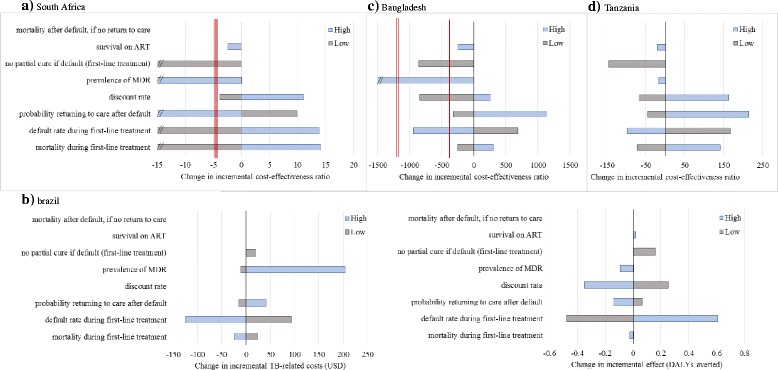
Methods: We developed an individual-based decision analytic model to assess the cost-effectiveness of a hypothetical four-month regimen for first-line treatment of TB, assuming non-inferiority to current regimens of six-month duration. The model was populated using extensive, empirically-collected data to estimate the economic impact on both health systems and patients of regimen shortening for first-line TB treatment in South Africa, Brazil, Bangladesh, and Tanzania. We explicitly considered 'real world' constraints such as sub-optimal guideline adherence.
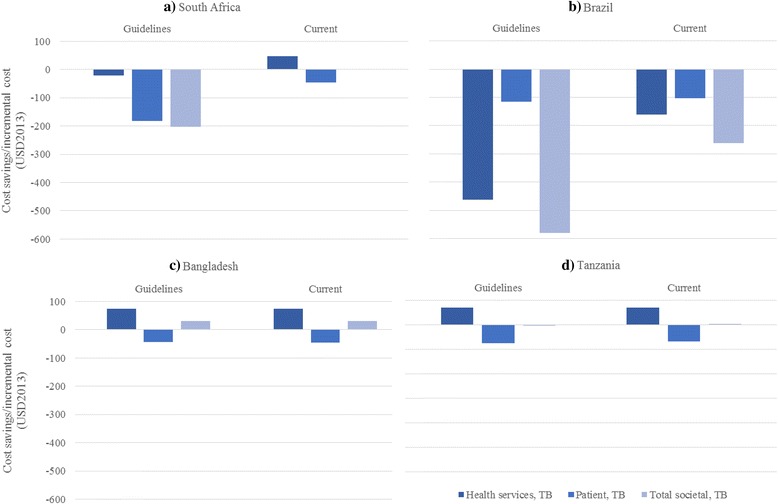
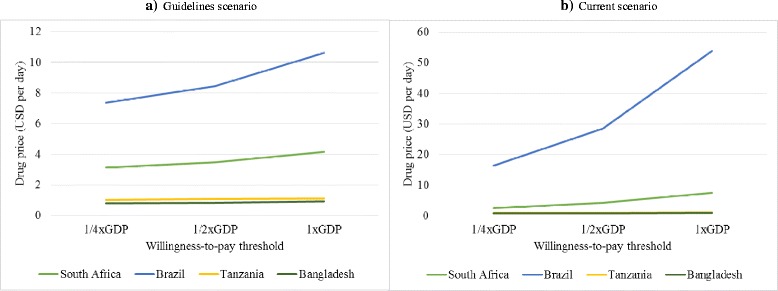
Results: From a societal perspective, a shortened regimen, priced at USD1 per day, could be a cost-saving option in South Africa, Brazil, and Tanzania, but would not be cost-effective in Bangladesh when compared to one gross domestic product (GDP) per capita. Incorporating 'real world' constraints reduces cost-effectiveness. Patient-incurred costs could be reduced in all settings. From a health service perspective, increased drug costs need to be balanced against decreased delivery costs. The new regimen would remain a cost-effective option, when compared to each countries' GDP per capita, even if new drugs cost up to USD7.5 and USD53.8 per day in South Africa and Brazil; this threshold was above USD1 in Tanzania and under USD1 in Bangladesh.
Conclusion: Reducing the duration of first-line TB treatment has the potential for substantial economic gains from a patient perspective. The potential economic gains for health services may also be important, but will be context-specific and dependent on the appropriate pricing of any new regimen.
Keywords: Cost-effectiveness; Economic evaluation; New technologies; Tuberculosis.
Figures
Similar articles
-
The Impact and Cost-Effectiveness of a Four-Month Regimen for First-Line Treatment of Active Tuberculosis in South Africa.PLoS One. 2015 Dec 30;10(12):e0145796. doi: 10.1371/journal.pone.0145796. eCollection 2015. PLoS One. 2015. PMID: 26717007 Free PMC article.
-
Patient and provider costs of the new BPaL regimen for drug-resistant tuberculosis treatment in South Africa: A cost-effectiveness analysis.PLoS One. 2024 Oct 21;19(10):e0309034. doi: 10.1371/journal.pone.0309034. eCollection 2024. PLoS One. 2024. PMID: 39432463 Free PMC article.
-
Cost-effectiveness of novel first-line treatment regimens for tuberculosis.Int J Tuberc Lung Dis. 2013 May;17(5):590-6. doi: 10.5588/ijtld.12.0776. Int J Tuberc Lung Dis. 2013. PMID: 23575322 Free PMC article.
-
Economic and modeling evidence for tuberculosis preventive therapy among people living with HIV: A systematic review and meta-analysis.PLoS Med. 2021 Sep 14;18(9):e1003712. doi: 10.1371/journal.pmed.1003712. eCollection 2021 Sep. PLoS Med. 2021. PMID: 34520463 Free PMC article.
-
Tuberculosis.In: Holmes KK, Bertozzi S, Bloom BR, Jha P, editors. Major Infectious Diseases. 3rd edition. Washington (DC): The International Bank for Reconstruction and Development / The World Bank; 2017 Nov 3. Chapter 11. In: Holmes KK, Bertozzi S, Bloom BR, Jha P, editors. Major Infectious Diseases. 3rd edition. Washington (DC): The International Bank for Reconstruction and Development / The World Bank; 2017 Nov 3. Chapter 11. PMID: 30212088 Free Books & Documents. Review.
Cited by
-
Recent Progress and Challenges for Drug-Resistant Tuberculosis Treatment.Pharmaceutics. 2021 Apr 21;13(5):592. doi: 10.3390/pharmaceutics13050592. Pharmaceutics. 2021. PMID: 33919204 Free PMC article. Review.
-
A systematic review of economic evaluations of pharmacological treatments for active tuberculosis.Front Public Health. 2024 Apr 16;12:1201512. doi: 10.3389/fpubh.2024.1201512. eCollection 2024. Front Public Health. 2024. PMID: 38689771 Free PMC article.
-
Cost-effectiveness of one month of daily isoniazid and rifapentine versus three months of weekly isoniazid and rifapentine for prevention of tuberculosis among people receiving antiretroviral therapy in Uganda.J Int AIDS Soc. 2020 Oct;23(10):e25623. doi: 10.1002/jia2.25623. J Int AIDS Soc. 2020. PMID: 33073520 Free PMC article.
-
Cost-Effectiveness Analysis of BCG Vaccination against Tuberculosis in Indonesia: A Model-Based Study.Vaccines (Basel). 2020 Nov 26;8(4):707. doi: 10.3390/vaccines8040707. Vaccines (Basel). 2020. PMID: 33256143 Free PMC article.
-
Fourteen-day PET/CT imaging to monitor drug combination activity in treated individuals with tuberculosis.Sci Transl Med. 2021 Feb 3;13(579):eabd7618. doi: 10.1126/scitranslmed.abd7618. Sci Transl Med. 2021. PMID: 33536283 Free PMC article.
References
-
- World Health Organization . Global tuberculosis report 2014. Geneva: World Health Organization; 2014.
-
- Lienhardt C, Vernon A, Raviglione MC. New drugs and new regimens for the treatment of tuberculosis: review of the drug development pipeline and implications for national programmes. Curr Opin Pulm Med. 2010;16(3):186–93. - PubMed
-
- Gospodarevskaya E, Tulloch O, Bunga C, Ferdous S, Jonas A, Islam S, et al. Patient costs during tuberculosis treatment in Bangladesh and Tanzania: the potential of shorter regimens. Int J Tuberc Lung Dis Off J Int Union Tuberc Lung Dis. 2014;18(7):810–7. - PubMed
MeSH terms
Substances
Grants and funding
LinkOut - more resources
Full Text Sources
Other Literature Sources
Medical
