. 2017 Jan 3;8(1):1613-1627.
doi: 10.18632/oncotarget.13693.

Nuclear localization of the CK2α-subunit correlates with poor prognosis in clear cell renal cell carcinoma

Affiliations

Nuclear localization of the CK2α-subunit correlates with poor prognosis in clear cell renal cell carcinoma

Maj Rabjerg et al. Oncotarget. .

Abstract

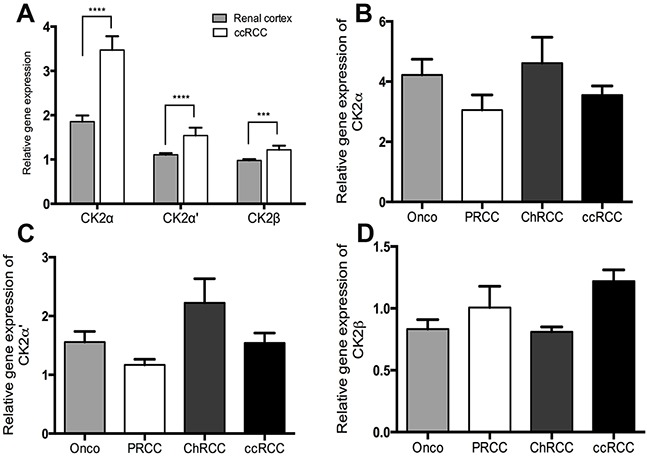
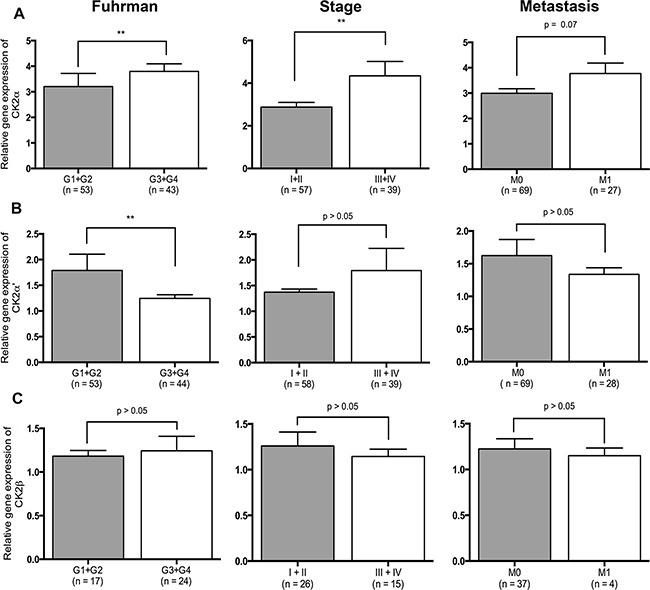
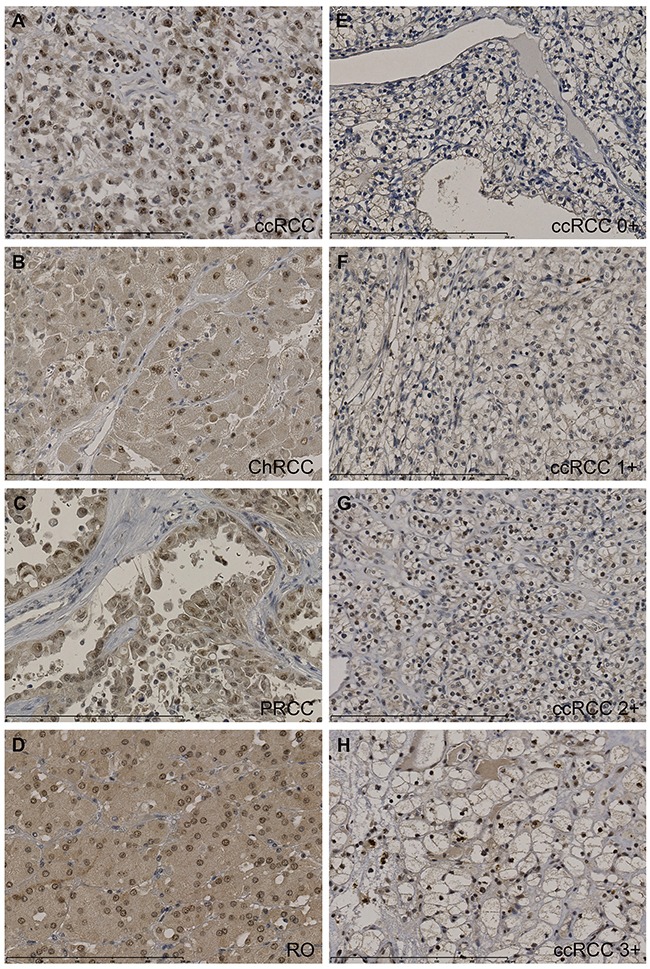
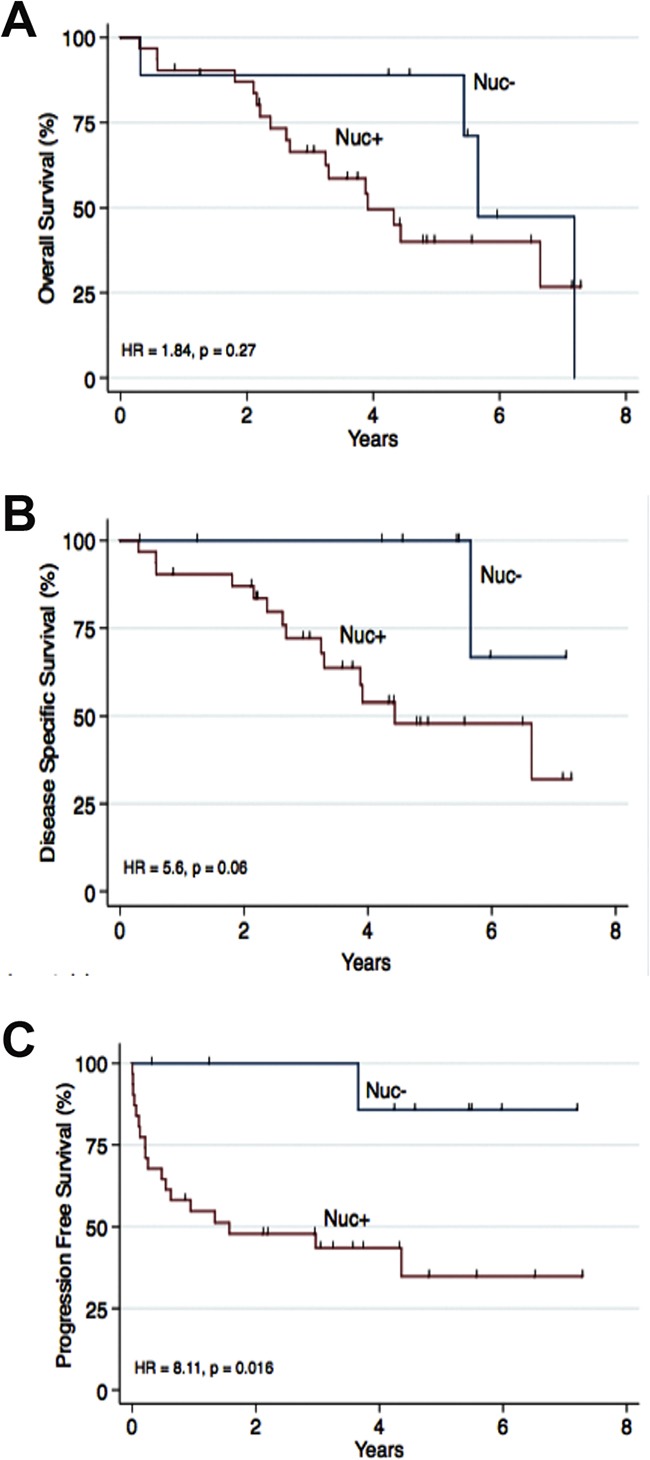
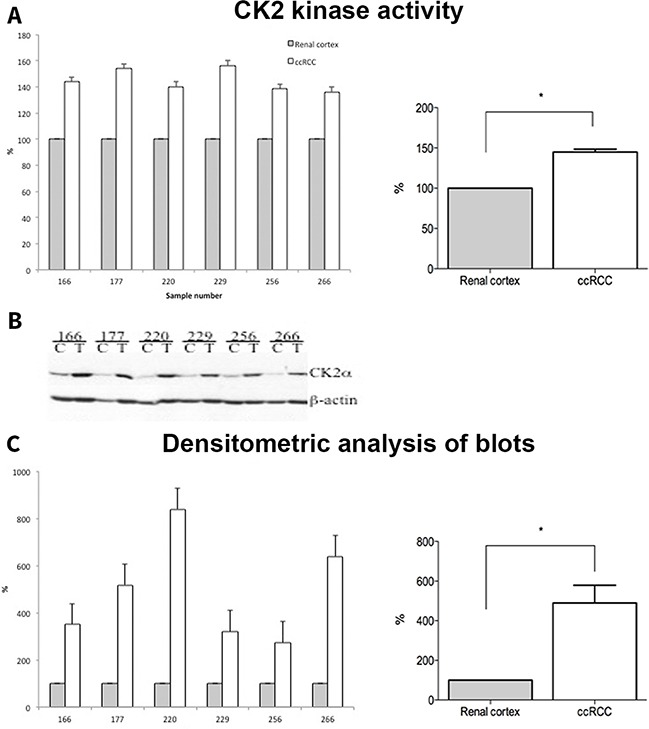
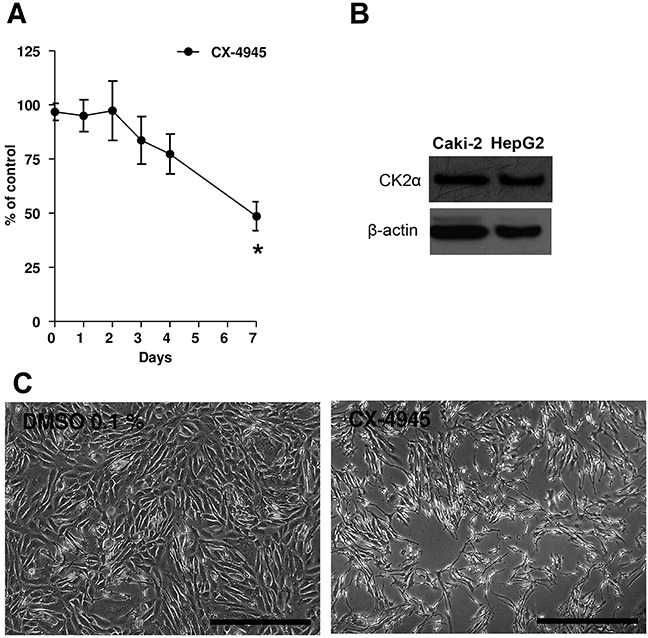
Protein kinase CK2α, one of the two catalytic isoforms of the protein kinase CK2 has been shown to contribute to tumor development, tumor proliferation and suppression of apoptosis in various malignancies. We conducted this study to investigate CK2 expression in different subtypes of Renal Cell Carcinoma (RCC) and in the benign oncocytoma. qRT-PCR, immunohistochemistry and Western blot analyses revealed that CK2α expression was significantly increased at the mRNA and protein levels in clear cell RCC (ccRCC). Also the kinase activity of CK2 was significantly increased in ccRCC compared to normal renal cortex. Nuclear protein expression of CK2α correlated in univariate analysis with poor Progression Free Survival (HR = 8.11, p = 0.016). Functional analyses (cell proliferation assay) revealed an inhibitory effect of Caki-2 cell growth following CK2 inhibition with CX-4945. Our results suggest that CK2α promotes migration and invasion of ccRCC and therefore could serve as a novel prognostic biomarker and molecular therapeutic target in this type of cancer.

Keywords: CK2 subunits; CK2-targeted therapy; CX-4945; protein kinase CK2; renal cancer.


Conflict of interest statement

CONFLICTS OF INTEREST

The authors declare no competing interests.

Figures

Figure 1
Figure 1
A. Relative gene expression levels of the CK2 subunits α, α' and β by qRT-PCR showing a significantly higher expression in ccRCC than matched normal renal cortex. B-C. Gene expression levels of the three CK2 subunits in different subtypes of RCC (ccRCC, clear cell renal cell carcinoma; PRCC, papillary renal cell carcinoma; ChRCC, chromophobe renal cell carcinoma) and in the benign oncocytoma (Onco). No significant difference was found.*** p< 0.001, ****p< 0.000.
Figure 2
Figure 2. Relative gene expression levels of the three CK2 subunits and their correlation to clinicopathological factors
A. High expression of CK2α correlates to high Fuhrman grade (p=0.001), high stage (p=0.007) and distant metastasis (p=0.07). B. High expression of CK2α' correlates to low Fuhrman grade (p=0.01). C. Expression of CK2β did not correlate to any of the clinicopathological factors.
Figure 3
Figure 3. Tissue micro arrays including ccRCC (n=105), PRCC (n=27), ChRCC (n=8), UcRCC (n=2), RO (n=13) and normal renal cortex (n=146) were immunohistochemically stained for CK2α
Stainings were evaluated semi-quantitatively with the following scores: the extent of staining of moderate to strong intensity in the nuclei was scored as 0 (0%), 1+ (1-25%), 2+(26-50%), 3+(51-75%) or 4+(76-100%) according to the percentages of the positive staining areas relative to the entire core area. The cytoplasm was scored as 0 or 1+, when more than 10% of the cytoplasm area showed positivity. The sum of nuclei and cytoplasm was used as the final CK2α score (0-5+). A-D. High protein expression of CK2α (3-5+) in ccRCC (5+), ChRCC (4+), PRCC (3+) and oncocytoma (4+). E-H. Representative stainings of CK2α in ccRCC. Scalebar indicates 0-250 μm. 400x magnification.
Figure 4
Figure 4. Nuclear staining of CK2α was correlated to overall survival (OS), disease specific survival (DSS) and progression free survival (PFS) in 40 patients with ccRCC high stage disease (pT3-4)
Nuc- was defined as 0 (0%) positive nuclei. Nuc+ was defined as 1-4 (1-100%) positive nuclei. A. No association to OS was found. B. A tendency towards a poor DSS was seen (HR = 5.6, p = 0.06). C. A positive nuclear staining of CK2α was associated to a poor PFS (HR = 8.11, p=0.016).
Figure 5
Figure 5
A. Whole cell lysates from normal (Renal cortex) and tumor (ccRCC) tissue samples (30 μg) were subjected to CK2 kinase activity assay as described in the materials and methods. The activity is expressed as percentage of control (Renal cortex). B. 30 μg of whole cell lysates from control (C, renal cortex) and tumor (T, ccRCC) were subjected to SDS-polyacrylamide gel electrophoresis (PAGE). Separated proteins were transferred to polyvinylidene difluoride (PVDF) membrane by western blot. Proteins were visualized by probing the membranes with antibodies against CK2α and β-actin, respectively. C. Densitometric analysis of protein bands is expressed as percentage of control.
Figure 6
Figure 6
A. Caki-2 cells were treated with CX-4945 (10 μM) for 7 days. Experiments were repeated three times and data (absorption, ABS) were expressed as the means ± SEM of 3 replicates for each condition. Absorbance values were normalized to vehicle (DMSO). Student's T-test was used for statistical comparison of data sets at any given time point. *p< 0.01 vs. Control (vehicle). B. Western blot analyses of CK2α in Caki-2 cell lysates and HepG2 not treated with CX-4945. HepG2 served as a positive control. Actin expression served as a loading control. C. Pictures showing Caki-2 cells at the seventh day of the proliferation assay. At day 7, vehicle (DMSO 0.1%) was confluent, while cells in the presence of CX-4945 (10 μM, right picture) show a reduction to 49%. The scale bar in each picture corresponds to 500 μm.

References

    1. Ferlay J, Soerjomataram I, Dikshit R, Eser S, Mathers C, Rebelo M, Parkin DM, Forman D, Bray F. Cancer incidence and mortality worldwide: sources, methods and major patterns in GLOBOCAN 2012. International journal of cancer. 2015;136:E359–386. - PubMed
    1. Eble JN, Sauter G., Epstein J.I., Sesterhenn I. WHO Classification of Tumours: Tumours of the Urinary System and Male Genital Organs. Lyon: IARCPress; 2004. pp. 9–88.
    1. Moch H. An overview of renal cell cancer: pathology and genetics. Semin Cancer Biol. 2013;23:3–9. - PubMed
    1. Lam JS, Leppert JT, Figlin RA, Belldegrun AS. Role of molecular markers in the diagnosis and therapy of renal cell carcinoma. Urology. 2005;66:1–9. - PubMed
    1. Mickley A, Kovaleva O, Kzhyshkowska J, Gratchev A. Molecular and immunologic markers of kidney cancer-potential applications in predictive, preventive and personalized medicine. EPMA J. 2015;6:20. - PMC - PubMed

MeSH terms

Supplementary concepts