. 2016 Dec 1;11(12):e0166135.
doi: 10.1371/journal.pone.0166135. eCollection 2016.

In Vitro Variant Surface Antigen Expression in Plasmodium falciparum Parasites from a Semi-Immune Individual Is Not Correlated with Var Gene Transcription

Affiliations

In Vitro Variant Surface Antigen Expression in Plasmodium falciparum Parasites from a Semi-Immune Individual Is Not Correlated with Var Gene Transcription

Ellen Inga Bruske et al. PLoS One. .

Abstract

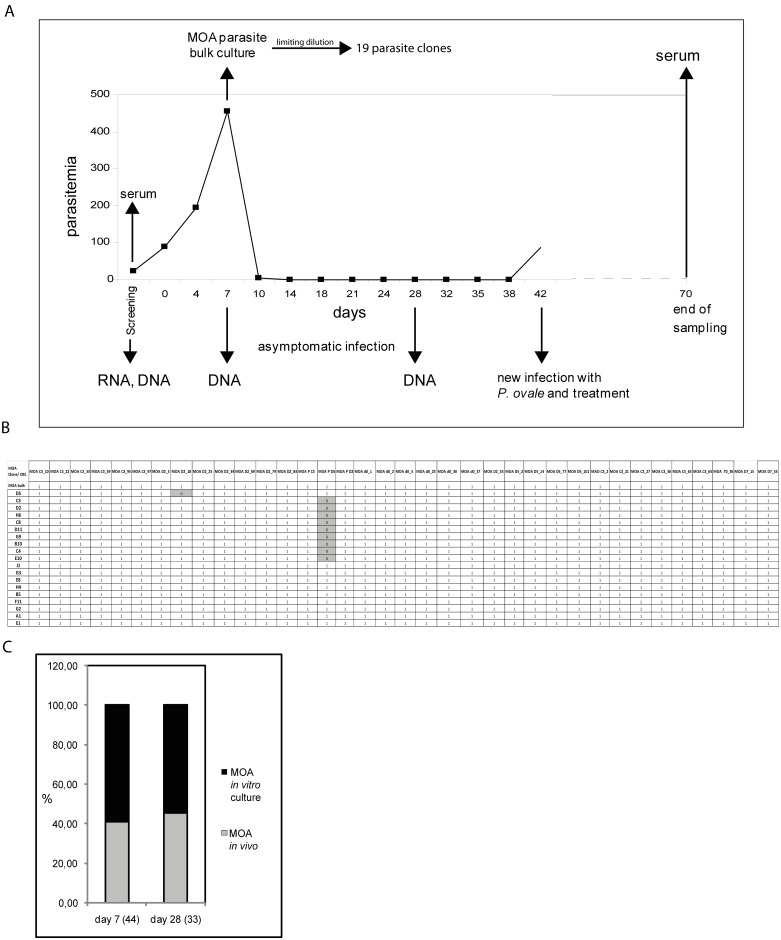
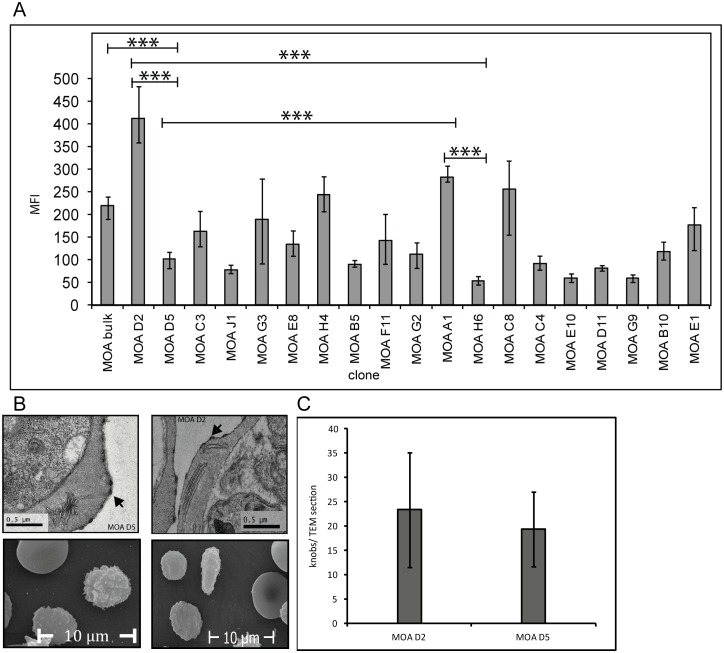
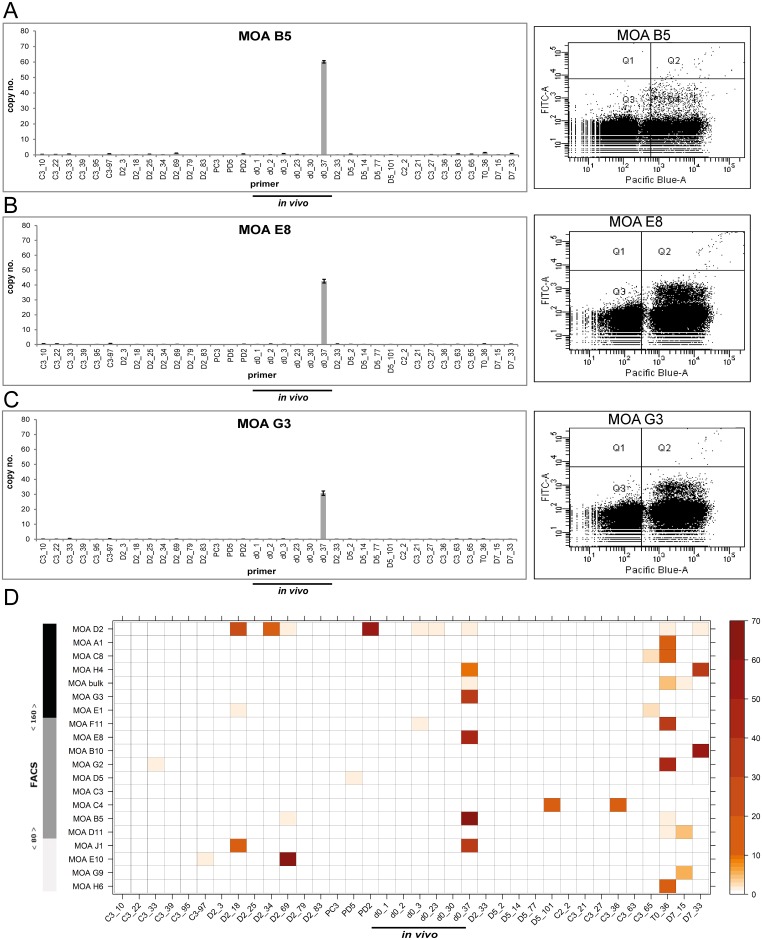
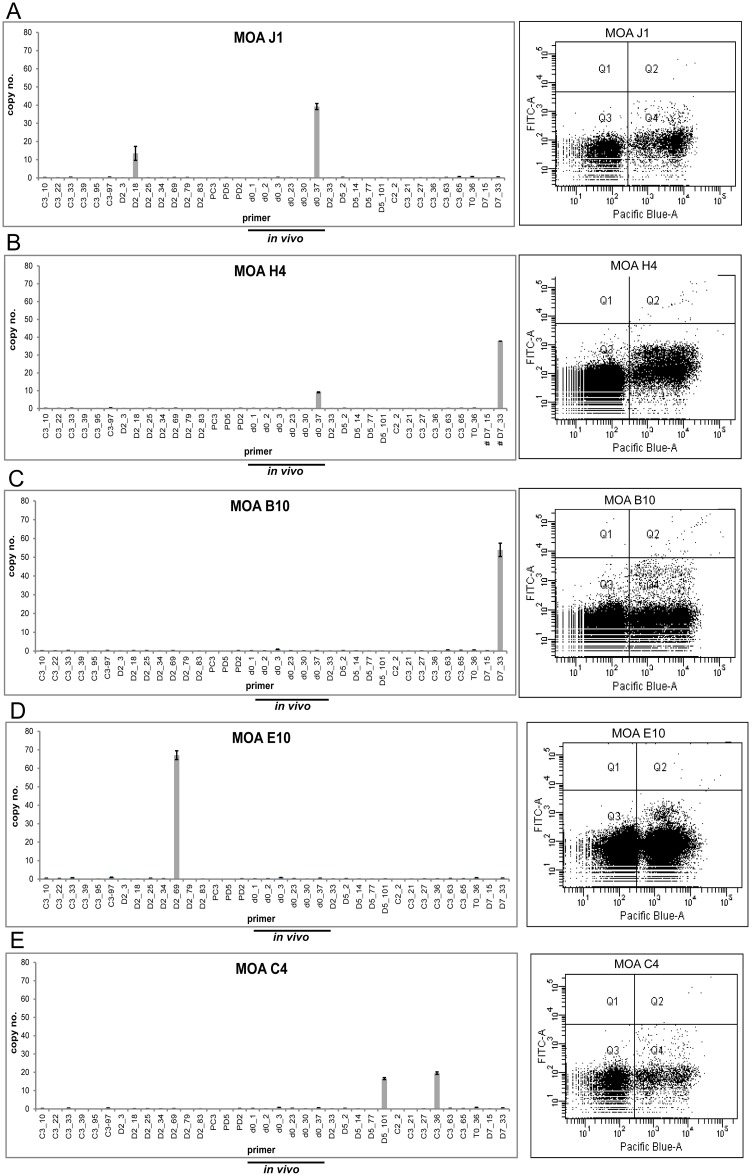
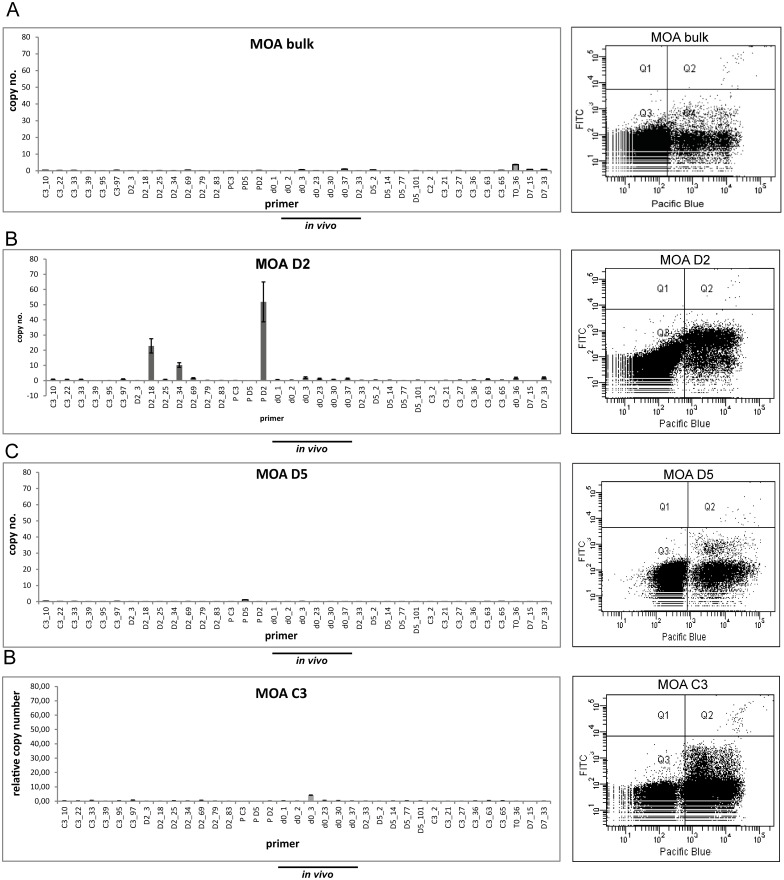
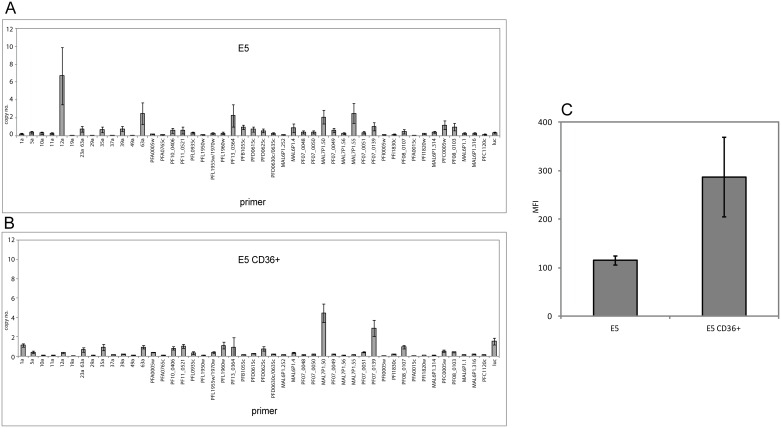
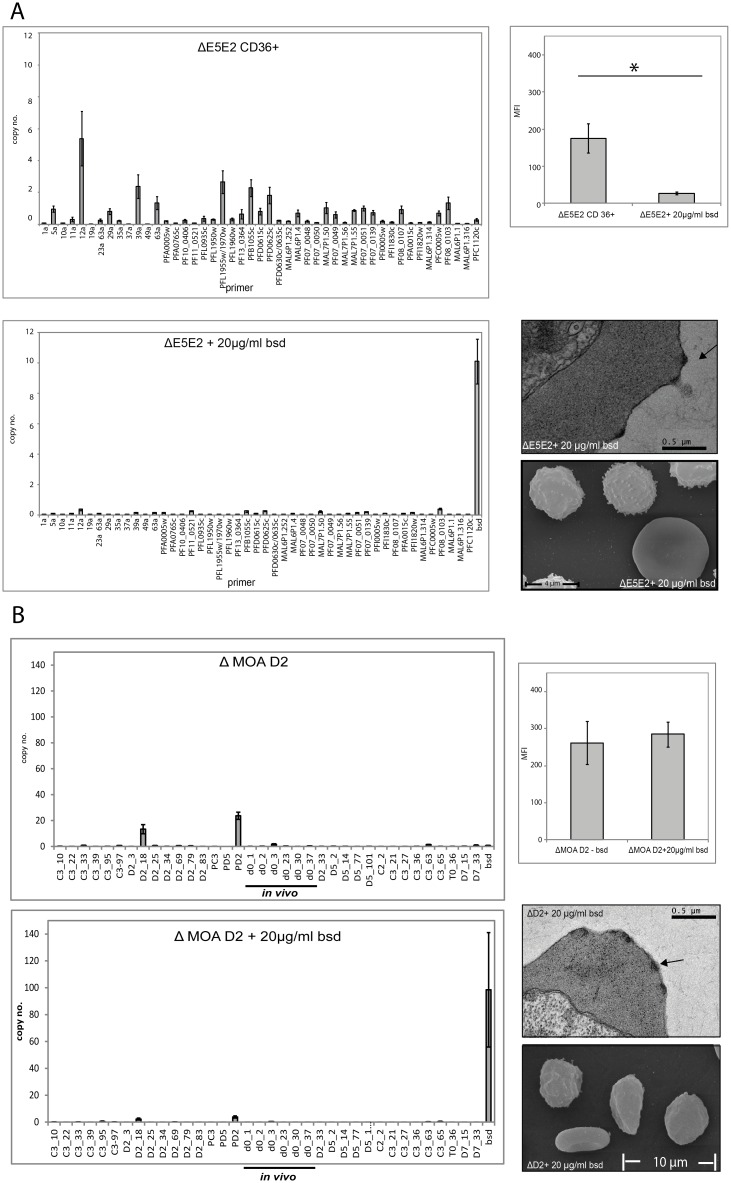
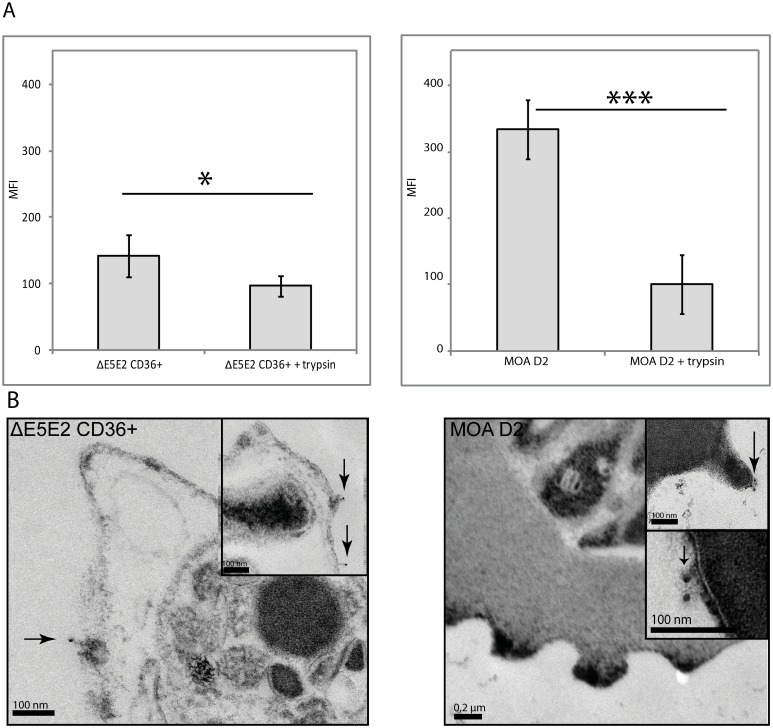
Plasmodium falciparum erythrocyte membrane protein 1 (PfEMP1) is considered to be the main variant surface antigen (VSA) of Plasmodium falciparum and is mainly localized on electron-dense knobs in the membrane of the infected erythrocyte. Switches in PfEMP1 expression provide the basis for antigenic variation and are thought to be critical for parasite persistence during chronic infections. Recently, strain transcending anti-PfEMP1 immunity has been shown to develop early in life, challenging the role of PfEMP1 in antigenic variation during chronic infections. In this work we investigate how P. falciparum achieves persistence during a chronic asymptomatic infection. The infected individual (MOA) was parasitemic for 42 days and multilocus var gene genotyping showed persistence of the same parasite population throughout the infection. Parasites from the beginning of the infection were adapted to tissue culture and cloned by limiting dilution. Flow cytometry using convalescent serum detected a variable surface recognition signal on isogenic clonal parasites. Quantitative real-time PCR with a field isolate specific var gene primer set showed that the surface recognition signal was not correlated with transcription of individual var genes. Strain transcending anti-PfEMP1 immunity of the convalescent serum was demonstrated with CD36 selected and PfEMP1 knock-down NF54 clones. In contrast, knock-down of PfEMP1 did not have an effect on the antibody recognition signal in MOA clones. Trypsinisation of the membrane surface proteins abolished the surface recognition signal and immune electron microscopy revealed that antibodies from the convalescent serum bound to membrane areas without knobs and with knobs. Together the data indicate that PfEMP1 is not the main variable surface antigen during a chronic infection and suggest a role for trypsin sensitive non-PfEMP1 VSAs for parasite persistence in chronic infections.


Conflict of interest statement

The authors have declared that no competing interests exist.

Figures

Fig 1
Fig 1. In vitro and in vivo analysis of a chronic P. falciparum infection in a semi-immune individual.
(A) Parasitemia curve of the asymptomatic chronic P. falciparum infection of an adult semi-immune Gabonese individual over 70 days and timeline of the in vivo investigation. The patient was asymptomatic from day 0 to day 42, at which point a new infection with P. ovale was diagnosed and treated according to local guidelines. DNA, RNA, cryopreserved parasites and sera employed in this analysis are indicated by arrows. Blood parasitemia is quantified on the y-axis. P. falciparum parasites were detected from day 0 to day 10 by light microscopy. From day 7 to day 38 sub microscopic parasitemia was documented by PCR twice per week. For in vitro analysis parasites from day 7 were brought into tissue culture (MOA bulk) and 19 in vitro clones were generated by limiting dilution in two independent cloning experiments. (B) Matrix of PCR results with 36 DBL specific primers on DNA of in vitro MOA bulk culture and 19 MOA clones. 1 indicates amplification of the target sequence, 0 indicates absence of a reaction product. All 36 DBLs were amplified from MOA bulk and the clones MOA J1, G3, E8, H4, B5, F11, G2, A1 and E1. In the remaining clones 35 DBLs were successfully amplified. In the clone MOA D5 the DBL MOA D2_18 could not be amplified. In the clones MOA C3, D2, H6, C8, D11, G9, B10, C4, E10 the DBL MOA P D5 could not be amplified (grey). (C) Results of DBL shotgun cloning of DNA from patient blood of day 7 and day 28. Numbers in brackets shown below the x-axis refer to the total number of var DBL sequences identified on these days. Sequences that were identified exclusively in DNA from patient blood are designated as "in vivo" MOA (grey). The proportion of MOA “in vitro” DBLs is represented by the black part of the bars. MOA in vitro var DBLs were detected at the same proportion (59% (26 of 44)) on day 7 and day 28 (55% (18 of 33)).
Fig 2
Fig 2. Flow cytometry signals with day 70 serum on MOA bulk and MOA clones are variable.
(A) Mean fluorescence intensities (MFI) obtained with MOA serum of day 70 followed by staining with a secondary antibody attached to FITC shows variable surface recognition signals ranging from low (< 80 MFI) to medium (81–160 MFI) and high (> 160 MFI) in MOA bulk and in the MOA clones. Error bars reflect the mean error of at least three independent experiments (Student´s t-test: MOA bulk vs. D5: p = 0.008, A1 vs. H6: p = 0.0003, D2 vs. D5: p = 0.0001, D2 vs. H6: p = 0.008, D5 vs. A1: p = 0.0002). (B) and (C) show transmission and scanning electron microscopy graphs of two representative clones with a highly significant difference in surface recognition signal (MOA D2 and MOA D5) and the presence of knobs (arrows) in equal numbers. Knobs were quantified per TEM cut of each clone.
Fig 3
Fig 3. No correlation of var gene transcription and flow cytometry signals in clonal parasite populations.
(A) Left panel: var gene transcription profile of the clone B5 transcribing the MOA in vivo transcript d0_37 with the highest transcription signal. The transcription signal is quantified as relative copy number (RCN) of the housekeeping gene arginyl-tRNA synthetase (PFL0900 c) (n = 3, standard errors are given) on the y-axis. The 36 primer pairs are depicted on the x-axis. The 6 primer pairs quantifying in vivo transcripts are underlined. Right panel: The corresponding dot plot after incubation with MOA serum of day 70. DNA signals by staining with Hoechst-33342 are depicted on the x-axis ("Pacific Blue-A"), the antibody recognition signal is depicted at the y-axis ("FITC-A"). Uninfected red blood cells are shown in area Q3, infected erythrocytes with both strong (upper cloud) and weak (lower cloud) signals accumulate in Q4. (B) and (C) var gene transcription profiles of clones MOA E8 and MOA G3 transcribing d0_37 at lower transcription signals but exhibiting higher surface signals than clone B5. (D) Heat map correlating var gene transcription and flow cytometry signal in 19 MOA clones and the MOA bulk culture. The FACS signal is quantified by the left bar with a colour code ranging from black (high: MFI > 160) to dark grey (medium: MFI 81–159) to light grey (weak: MFI < 80). All MOA clones and MOA bulk are sorted according to their corresponding flow cytometry signal and depicted on the y-axis. The MOA specific primer set for 36 var loci is listed on the x-axis. var gene transcription is colour coded as indicated by the bar on the right. var genes marked in red are those with the highest transcription signal and var genes in white are those with very low (<3%) or no transcription. Note that clones transcribing d0_37 and T0_36 are evenly distributed from high to low flow cytometry signals.
Fig 4
Fig 4. No correlation of FACS signal and switching or transcription strength at 35 generations after cloning.
(A) Clone J 1 transcribes the in vivo transcript d0_37 and additionally DBL D2_18 but exhibits a low surface signal (MFI of 71). (B) and (C) Transcription of d0_37 and DBL D7_33 in Clone H4 is associated with a high surface signal (MFI of 223.67), but exclusive transcription of DBL D7_33 in clone B10 has a medium surface signal (MFI 109). (D) The exclusive transcription of D2_69 in clone E10 (at the highest individual transcription signal of all clones) is associated with low surface signal (MFI of 55.33). (E) Clone C4 Transcription of D5_101 and C3_36 at close to identical copy numbers. The clone has a medium MFI of 84.
Fig 5
Fig 5. No correlation of FACS and var signals in MOA bulk and clones at >65 generations.
(A) The MOA bulk culture exhibits low var gene transcription signals, but a high MFI (201). (B) Clone D2 exhibits the highest MFI (489) in the entire population and high var gene transcription signals for transcripts P_D2 and D2_18. (C) and (D) Clones D5 and C3 display low var gene transcription signals but show MFIs in the medium range (MFI of 63.67 and 139.67 respectively).
Fig 6
Fig 6. FACS signal with MOA day 70 serum of the laboratory strain E5 increases after CD36 selection.
(A) var gene transcription profile of the laboratory clone E5 prior to CD36 receptor binding selection. Transcription was quantified with an E5-specific primer set (x-axis) (n = 3, standard errors are given). (B) E5 var gene transcription after 3 consecutive rounds of selection for binding to the CD36+ receptor. (C) Surface antigen recognition measured by flow cytometry with serum of MOA d70 shows a stronger signal for the CD36-selected E5 lab strain (standard errors given, n = 3).
Fig 7
Fig 7. var knock-down removes the FACS signal in NF 54 E5 but not in MOA D2.
(A) var gene transcription profiles of the transgenic ΔE5E2 strain. The upper panel shows the var gene transcription profile of the ΔE5E2 cell line after CD36 receptor binding selection without blasticidin pressure. The lower panel depicts the same cell line after var gene knock-down. The corresponding flow cytometry signals (serum of day 70) are shown in the upper bar graph on the right. The mean fluorescence (MFI) is significantly reduced in the knock-down cell line (standard errors are given, p = 0.02, n = 4). The transmission electron microscopy (TEM) picture and the scanning electron microscopy picture (SEM) show that the E5 var knock-down cell line has intact knobs. (B) var gene transcription profile of transgenic MOA ΔD2 cell line without (upper graph) and with (lower graph) blasticidin pressure. Flow cytometry with serum of day 70 does not reveal any difference in their surface recognition signals of the two cell lines (standard errors are given, n = 3). The TEM and SEM pictures of MOA ΔD2 also clearly identify knobs in the erythrocyte surface membrane.
Fig 8
Fig 8. The MOA D2 surface recognition signal is trypsin sensitive.
(A) Surface recognition signal with day 70 sera before and after trypsinisation of CD36-selected ΔE5E2 (left panel) and of MOA D2 (right panel). Both ΔE5E2 and MOA D2 were incubated with MOA serum of day 70 and labelled with a secondary FITC antibody for detection in flow cytometry. Trypsinisation resulted in a significant decrease of the antibody recognition signal (standard errors are given, p = 0.05 for ΔE5E2 (n = 4) and p = 0.003 (n = 3) for D2) in both cell lines. (B) Immuno-TEM after MOA day 70 serum labelling on CD36 selected ΔE5E2 parasites and MOA D2 parasites. A secondary, 12 nm gold-labelled anti-human IgG antibody was added. In ΔE5E2 and MOA D2, gold particles (marked with arrows) could be detected on membrane areas with knobs as well as on the membrane areas without knobs.

References

    1. WHO | World Malaria Report 2014. In: WHO [Internet]. [cited 1 Dec 2015]. http://www.who.int/malaria/publications/world_malaria_report_2014/en/
    1. Cohen S, McGREGOR IA, Carrington S. Gamma-globulin and acquired immunity to human malaria. Nature. 1961;192: 733–737. - PubMed
    1. Edozien JC, Gilles HM, Udeozo IOK. ADULT AND CORD-BLOOD GAMMA-GLOBULIN AND IMMUNITY TO MALARIA IN NIGERIANS. The Lancet. 1962;280: 951–955.
    1. Marsh K, Howard RJ. Antigens induced on erythrocytes by P. falciparum: expression of diverse and conserved determinants. Science. 1986;231: 150–153. - PubMed
    1. Bull PC, Lowe BS, Kortok M, Molyneux CS, Newbold CI, Marsh K. Parasite antigens on the infected red cell surface are targets for naturally acquired immunity to malaria. Nat Med. 1998;4: 358–360. - PMC - PubMed

MeSH terms

Substances