. 2016 Dec 1;12(12):e1006022.
doi: 10.1371/journal.ppat.1006022. eCollection 2016 Dec.

CD8+ T Cells Induce Fatal Brainstem Pathology during Cerebral Malaria via Luminal Antigen-Specific Engagement of Brain Vasculature

Affiliations

CD8+ T Cells Induce Fatal Brainstem Pathology during Cerebral Malaria via Luminal Antigen-Specific Engagement of Brain Vasculature

Phillip A Swanson 2nd et al. PLoS Pathog. .

Abstract

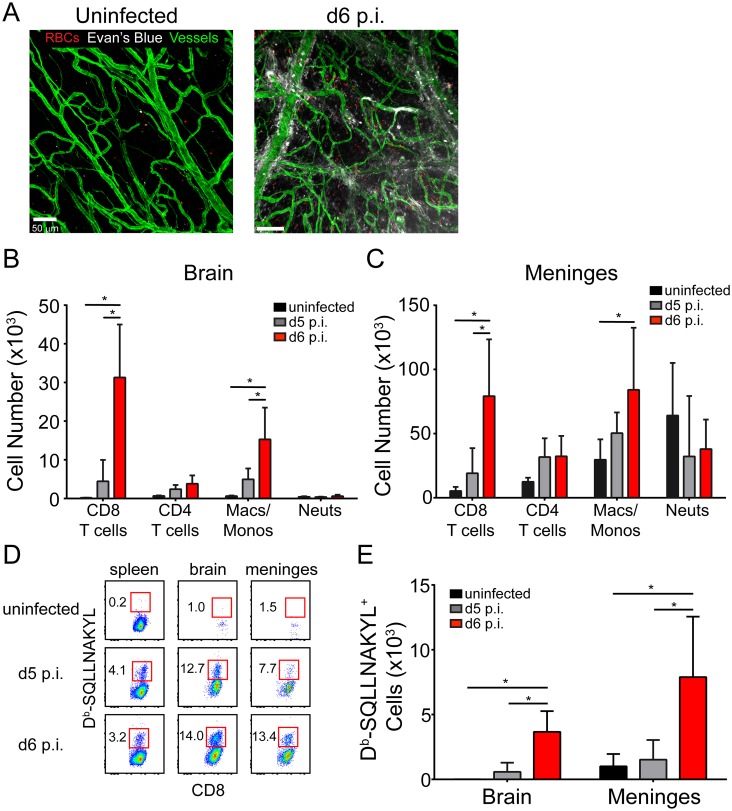
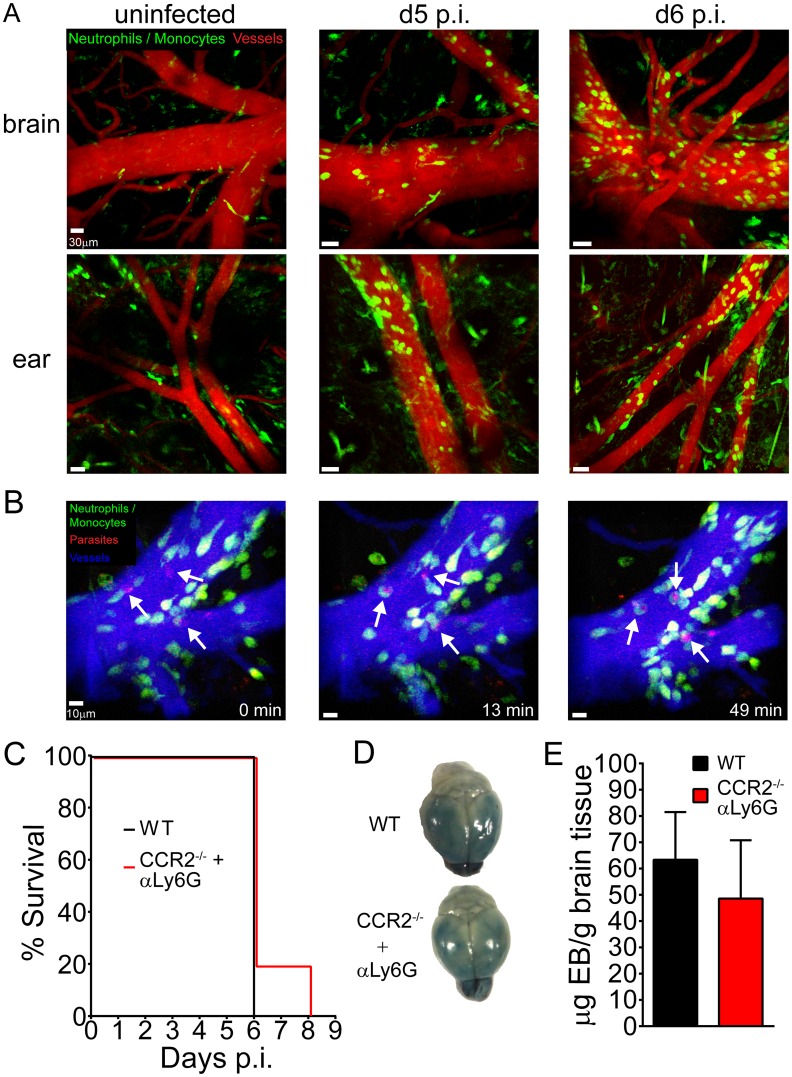
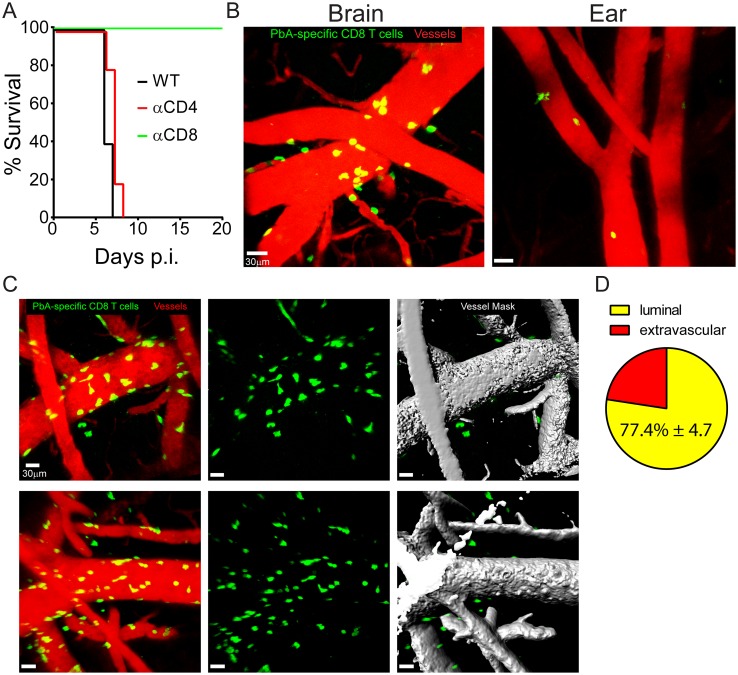
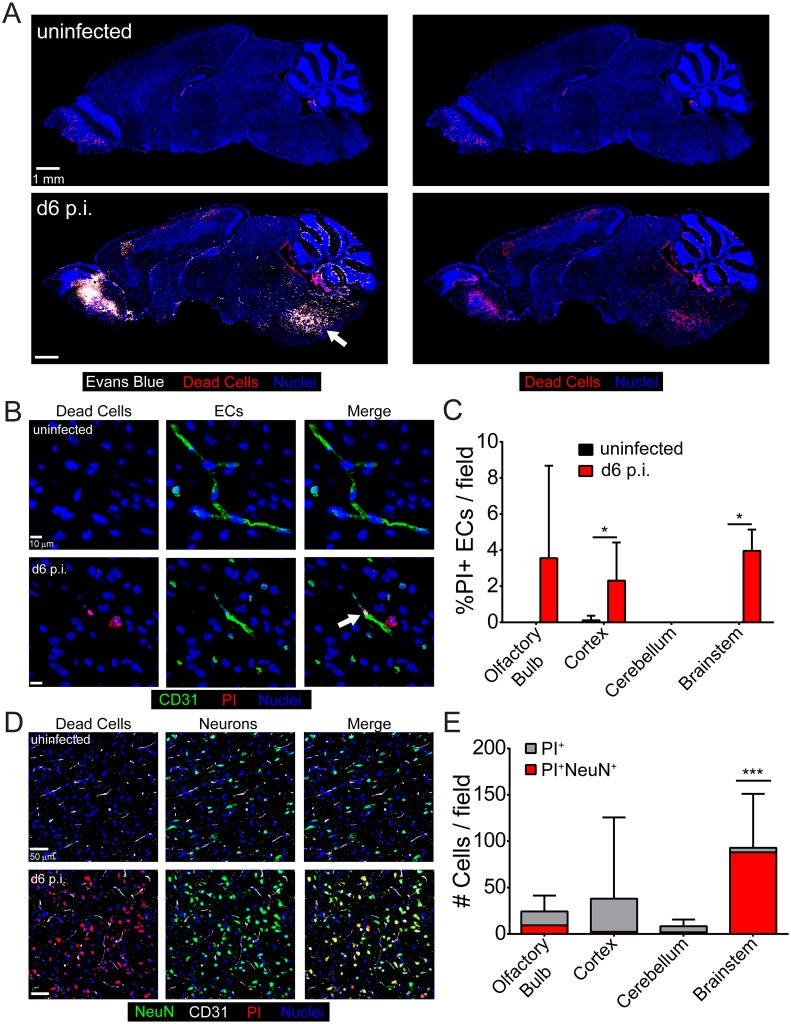
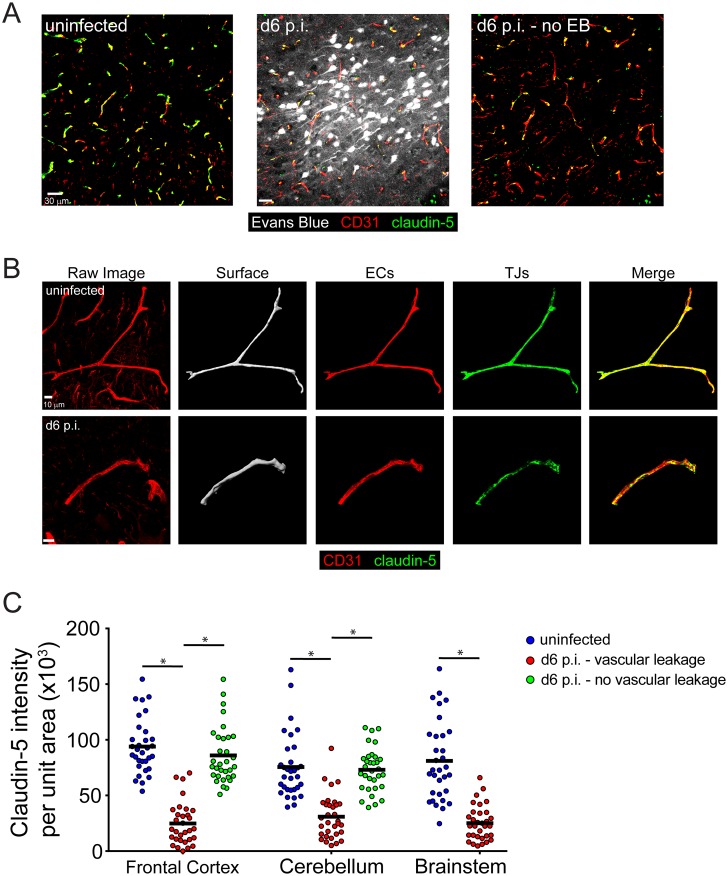
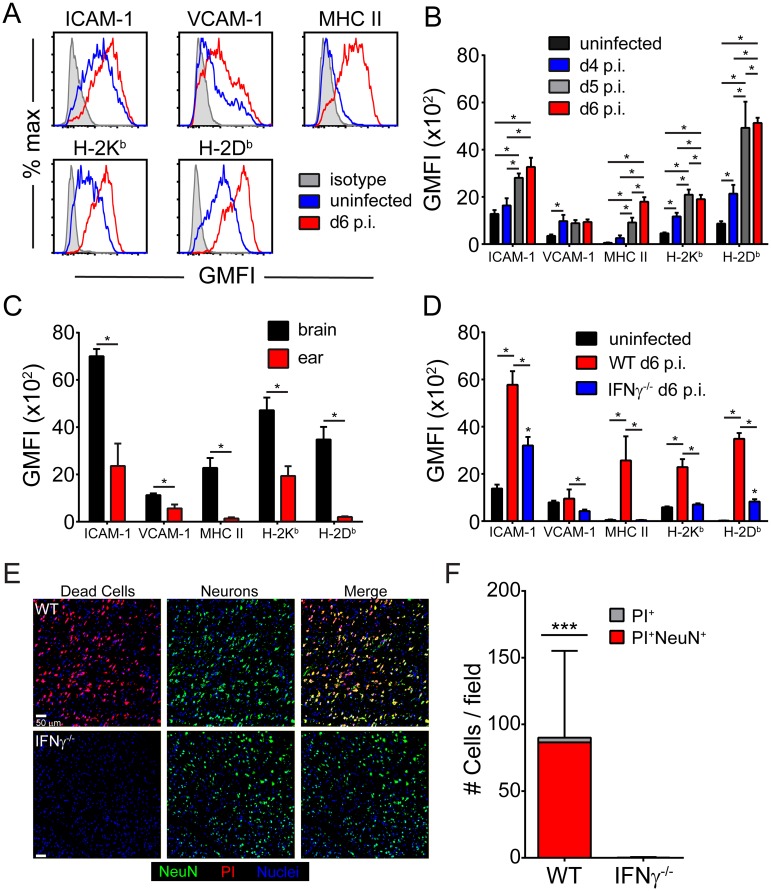
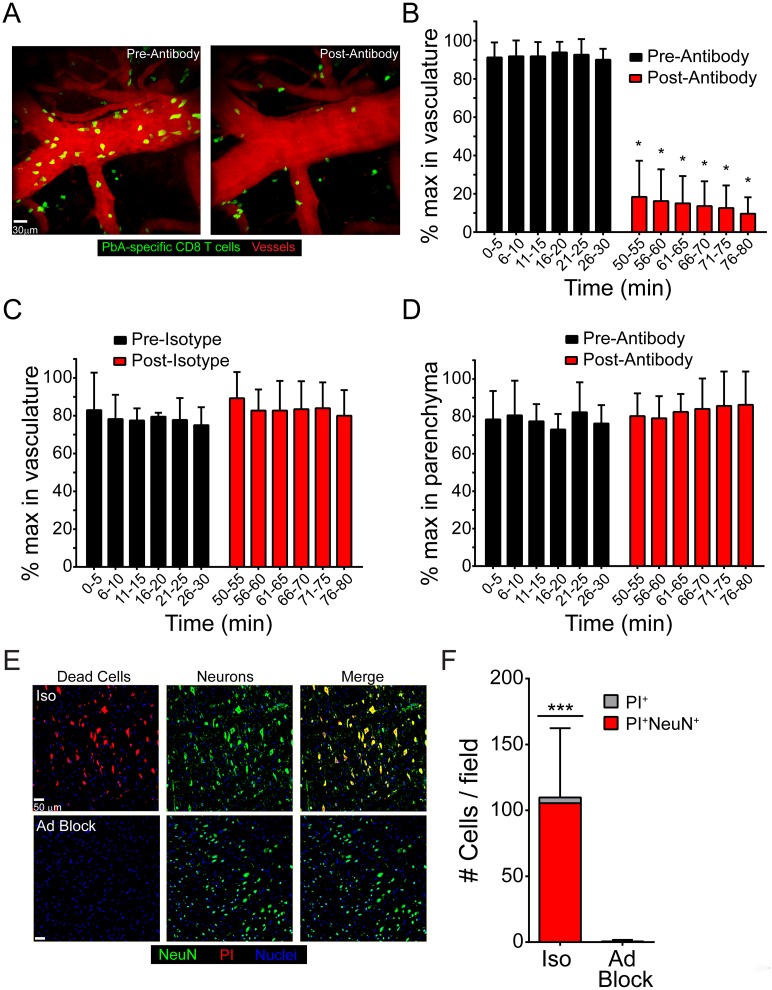
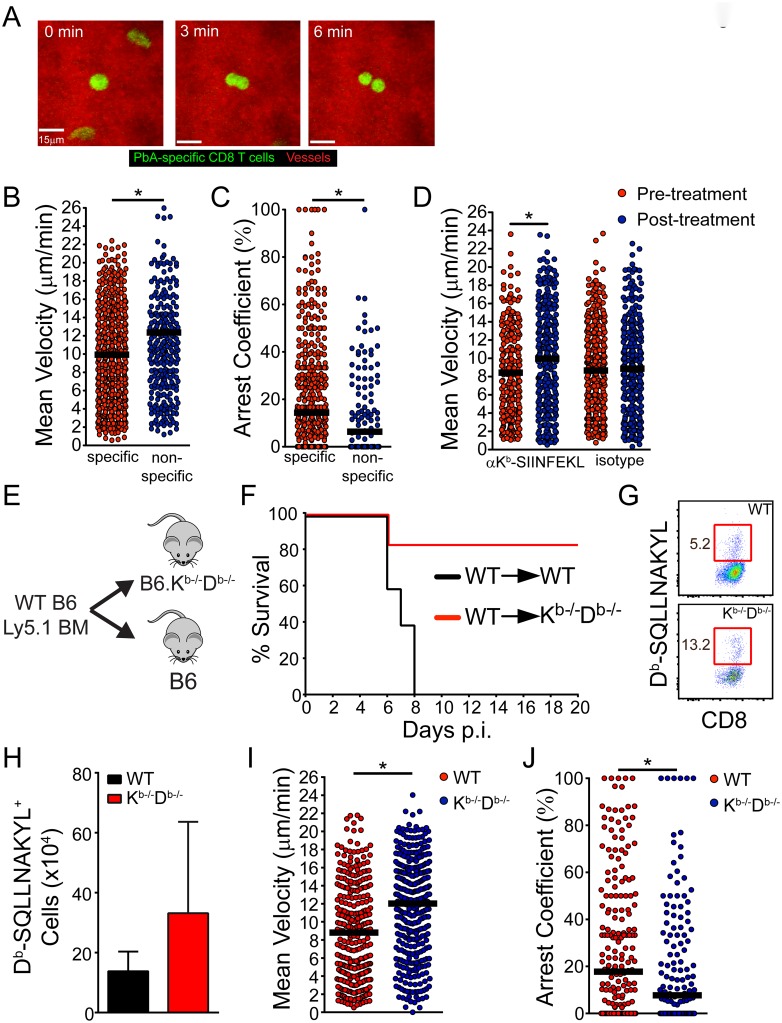
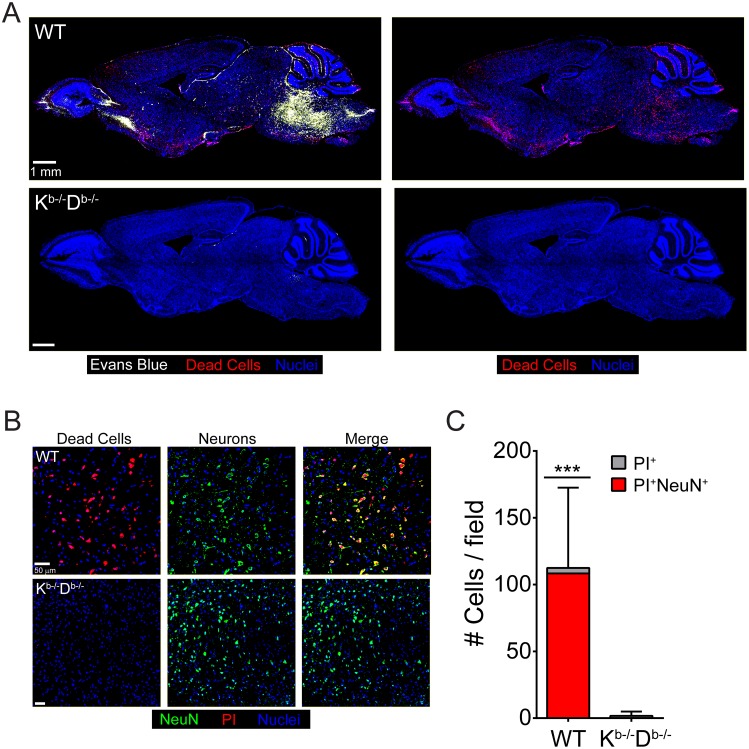
Cerebral malaria (CM) is a severe complication of Plasmodium falciparum infection that results in thousands of deaths each year, mostly in African children. The in vivo mechanisms underlying this fatal condition are not entirely understood. Using the animal model of experimental cerebral malaria (ECM), we sought mechanistic insights into the pathogenesis of CM. Fatal disease was associated with alterations in tight junction proteins, vascular breakdown in the meninges / parenchyma, edema, and ultimately neuronal cell death in the brainstem, which is consistent with cerebral herniation as a cause of death. At the peak of ECM, we revealed using intravital two-photon microscopy that myelomonocytic cells and parasite-specific CD8+ T cells associated primarily with the luminal surface of CNS blood vessels. Myelomonocytic cells participated in the removal of parasitized red blood cells (pRBCs) from cerebral blood vessels, but were not required for the disease. Interestingly, the majority of disease-inducing parasite-specific CD8+ T cells interacted with the lumen of brain vascular endothelial cells (ECs), where they were observed surveying, dividing, and arresting in a cognate peptide-MHC I dependent manner. These activities were critically dependent on IFN-γ, which was responsible for activating cerebrovascular ECs to upregulate adhesion and antigen-presenting molecules. Importantly, parasite-specific CD8+ T cell interactions with cerebral vessels were impaired in chimeric mice rendered unable to present EC antigens on MHC I, and these mice were in turn resistant to fatal brainstem pathology. Moreover, anti-adhesion molecule (LFA-1 / VLA-4) therapy prevented fatal disease by rapidly displacing luminal CD8+ T cells from cerebrovascular ECs without affecting extravascular T cells. These in vivo data demonstrate that parasite-specific CD8+ T cell-induced fatal vascular breakdown and subsequent neuronal death during ECM is associated with luminal, antigen-dependent interactions with cerebrovasculature.


Conflict of interest statement

The authors have declared that no competing interests exist.

Figures

Fig 1
Fig 1. Meningeal pathology and kinetics of the CNS inflammatory response during ECM.
(A) Representative confocal images of a meningeal whole mount from a naïve and d6 p.i. mouse following i.v. injection of Evans blue (white) (n = 4 mice per group). Evans blue and TER119+ red blood cells (red) leak from CD31+ vessels (green) into the meningeal space at d6 p.i. (B and C) Flow cytometric quantification of CD8+ T cells (CD45+Thy1.2+CD8+), CD4+ T cells (CD45+Thy1.2+CD8-), monocytes / macrophages (CD45+Thy1.2-CD11b+Ly6C+Ly6G-), and neutrophils (CD45+Thy1.2-CD11b+Ly6G+) in the brain (B) and meninges (C) of naïve, d5 p.i., and d6 p.i. mice. Bar graphs show mean ± SD (n = 5 mice per group). Data are representative of five independent experiments. (D) Representative flow cytometric dot plots show the frequency of Db-SQLLNAKYL-specific CD8+ T cells (red boxes and adjacent numbers) in the spleen, brain, and meninges naïve, d5 p.i., and d6 p.i. mice. Plots are gated on live CD45+ Thy1.2+ CD8+ cells. (E) Quantification of the data shown in (D). Bar graphs show mean ± SD (n = 5 mice per group). Data are representative of two independent experiments. Asterisks denote statistical significance (*P < 0.05).
Fig 2
Fig 2. In vivo myelomonocytic cell dynamics and their contribution to ECM-mediated pathology.
(A) Representative maximal projections of 3D time lapses were obtained from the thinned skull window (top) and corresponding ear (bottom) of naïve, d5 p.i., and d6 p.i. LysMgfp/+ mice. Note the accumulation of myelomonocytic cells (green) along brain and ear vessels (red) visualized with quantum dots (n = 3–4 mice per group). See corresponding S1 Movie. (B) A representative 3D time lapse of the brain was obtained from a LysMgfp/+ mouse infected with PbA-OVA-mCherry at d6 p.i. Myelomonocytic cells (green) were observed phagocytosing parasites (red) attached to the lumen of cerebral blood vessels (blue) (denoted with white arrows). Time points in the image series are denoted in minutes. See corresponding S3 Movie. (C) Survival curve for PbA-infected wild type mice (black line) and CCR2-/- mice that were depleted of neutrophils following i.p. injection of anti-Ly6G at day -1 (red line) (n = 4–5 mice per group). (D) Representative brains from wild type (top) and CCR2-/- (bottom) mice depleted of neutrophils at d-1. Mice were injected i.v. with Evans Blue dye at d6 p.i. (E) Fluorometric quantification of data shown in (D). Data are represented as mean ± SD (n = 5 mice per group). All data in this figure are representative of two independent experiments. Asterisks denote statistical significance (*P < 0.05).
Fig 3
Fig 3. CD8+ T cells localize preferentially to cerebral vasculature and promote fatal vascular breakdown during ECM.
(A) Survival curve showing PbA-infected wild type (black line), CD4+ T cell depleted (red line), and CD8+ T cell depleted (green line) mice over time (n = 4–5 mice per group). CD8+ or CD4+ T cells were depleted by injecting anti-CD8 or CD4 antibodies, respectively, at d4 p.i. (B) Representative maximal projections of 3D time lapses captured through a thinned skull window and the corresponding ear of a wild type mouse seeded i.v. with 104 naïve mCerulean+ OT-I cells (green) and then infected one day later PbA-OVA-mCherry. Time lapses were captured at d6 p.i. Blood vessels are shown red (n = 7 mice per group). See corresponding S5–S7 Movies. (C) Maximal projections captured through a thinned skull window depicting OT-I cells (green), blood vessels (red), and a volumetric mask corresponding to the vascular quantum dot signal (gray). Each row represents a different mouse. See corresponding S8 Movie. (D) Pie graph showing the percentage of luminal vs. extravascular OT-I cells at day 6 p.i. (mean ±SD; n = 5 mice). All data in this figure are representative of two independent experiments. Asterisks denote statistical significance (*P < 0.05).
Fig 4
Fig 4. Vascular leakage and severe brainstem pathology during ECM.
(A) Representative confocal images of sagittal brain sections from an uninfected mouse (top) or a symptomatic mouse at d6 p.i. following simultaneous i.v. injection of Evans blue (white) and propidium iodide (red) to visualize vascular leakage and cell death, respectively (n = 5 mice per group). Cell nuclei are shown in blue. Note the presence of severe brainstem pathology (white arrow) in the d6 p.i. mouse. (B) Representative confocal images of brain sections from a naïve (top) or a symptomatic mouse at d6 p.i. following propidium iodide (red) injection and immunohistochemical staining for CD31+ ECs (green). Cell nuclei are shown in blue. (C) The bar graph depicts quantification of data shown in (B). Data are represented as the percentage of PI+ CD31+ ECs of total CD31+ ECs per brain region (mean ± SD; n = 5 mice per group; 1 brain section per mouse; 10 images per brain section; 2–3 images per brain region). Asterisks denote statistical significance (*P < 0.05). (D) Representative confocal images of brain sections from an uninfected (top) or a symptomatic mouse at d6 p.i. following propidium iodide (red) injection and immunohistochemical staining for NeuN+ neurons (green). Cell nuclei are shown in blue. (E) The bar graph shows quantification of data shown in (D). Each bar represents the total number of PI+ cells in each brain region (gray), and within the bar, the red coloration shows the proportion that are also NeuN+ (mean ± SD; n = 4 mice per group; 1 brain section per mouse; 12 images per brain section; 3 images per brain region). Asterisks denote a statistically significant difference from all other groups (***P < 0.05).
Fig 5
Fig 5. TJ protein expression is reduced in areas of vascular breakdown.
(A) Representative confocal images from the frontal cortex of an uninfected mouse (left) or a symptomatic mouse at d6 p.i. (middle, right) following i.v. injection of Evans blue dye (white) to visualize vascular leakage. (n = 4 mice per group). (B) Representative confocal images of cerebral blood vessels from an uninfected mouse (top) or a symptomatic mouse at d6 p.i. (bottom) following immunohistochemical staining for CD31+ ECs (red) and the TJ protein claudin-5 (green). The volumetric mask of the blood vessel generated from the CD31 signal is shown in the second panel. (C) The bar graph shows quantification of the data in (B) plus areas of no vascular hemorrhage from the same symptomatic mice at d6 p.i. Each symbol represents one blood vessel. (n = 4 mice per group, 1 section per mouse, 3–4 images per brain region). Asterisks denote statistical significance (*P<0.05).
Fig 6
Fig 6. Cerebral ECs upregulate antigen presenting and adhesion molecules in an IFNγ-dependent manner.
(A) Representative histograms from naïve (blue) and d6 p.i. (red) mice show the expression antigen presenting (Db, Kb, MHC II) and adhesion molecules (ICAM-1, VCAM-1) on live CD45- CD31+ ECs. Isotype control antibody staining is shown in gray. (B) The bar graph depicts the geometric mean fluorescent intensity of the denoted molecules on cerebral ECs extracted from naïve, d4 p.i., d5 p.i., and d6 p.i. mice (mean ± SD; n = 5 mice per group). (C) The bar graphs shows expression of the same molecules on ECs extracted from the brain vs. ear of mice at d6 p.i. (mean ± SD; n = 5 mice per group). (D) Expression of antigen-presenting and adhesion molecules on cerebral ECs were quantified for naïve, wild type d6 p.i., and IFNγ-/- d6 p.i mice (mean ± SD; n = 5 mice per group). Note that IFNγ deficiency restores expression to near baseline levels. Data in this figure are representative of two independent experiments. (E) Representative confocal images of the brainstem from a symptomatic wild type mouse (top) or an IFNγ-/- mouse at d6 p.i. following propidium iodide (red) injection and immunohistochemical staining for NeuN+ neurons (green). Cell nuclei are shown in blue. (F) The bar graph shows quantification of data in (E). Each bar represents the total number of brainstem cells that are PI+ (gray), and within the bar, the red coloration shows the proportion that are also NeuN+ (mean ± SD; n = 4 mice per group; 1 brain section per mouse; 4 images per brain section). Asterisks denote a statistically significant difference from all other groups (***P < 0.05).
Fig 7
Fig 7. Adhesion molecule blockade displaces PbA-specific CD8+ T cell from cerebral blood vessels and promotes survival.
(A) Representative maximal projections of 3D time lapses captured through the thinned skull window of a mouse seeded i.v. with 104 naïve mCerulean+ OT-I cells (green) and then infected with PbA-OVA-mCherry. Images were captured at d6 p.i. The left panel shows the distribution of OT-I cells along cerebral blood vessels (red) before antibody blockade and the right panel depicts the same vessel after treatment. See corresponding S9 Movie. (B and C) The bar graphs show quantification of luminal PbA-specific CD8+ T cells as a percentage of maximum number in brain vasculature at the denoted time points before and after i.v. treatment with anti-LFA-1 / VLA-4 (B) or isotype control antibodies (C). Data are representative of 4–5 independent experiments. (D) Quantification of PbA-specific CD8+ T cells in the brain parenchyma as a percentage of the maximum number after i.v. treatment with anti-LFA-1/VLA-4 antibodies. Data are representative of 5 independent experiments. (E) Representative confocal images of the brainstem from mice at d6 p.i. following propidium iodide (red) injection and immunohistochemical staining for NeuN+ neurons (green). Mice were treated with either isotype control antibody (top) or anti-LFA-1/VLA-4 blocking antibodies (Ad block) at d5.5 p.i. Cell nuclei are shown in blue. (F) The bar graph shows quantification of data shown in (E). Each bar represents the total number of brainstem cells that are PI+ (gray), and within the bar, the red coloration shows the proportion that are also NeuN+ (mean ± SD; n = 4 mice per group; 1 brain section per mouse; 4 images per brain section). Asterisks denote a statistically significant difference from all other groups (***P < 0.05).
Fig 8
Fig 8. Fatal PbA-specific CD8+ T cell interactions with cerebrovascular ECs are cognate peptide MHC I dependent.
(A) Representative maximal projections of a 3D time lapse shows a PbA-specific CD8+ T cell (green) dividing along the luminal surface of a cerebral blood vessel (red) at d6 p.i. The mouse was seeded with 104 naïve mCerulean+ OT-I cells and infected with PbA-OVA-mCherry. See corresponding S10 Movie. (B and C) Quantification of PbA-specific CD8+ T cell velocities (B) and arrest coefficients (C) within the cerebral vasculature of d6 p.i. mice seeded with 104 mCerulean+ OT-I cells and infected with PbA-OVA-mCherry. Intravenously injected YFP+ P14 cells served as the non-specific bystander control CD8+ T cells for this experiment. Each dot represents an individual T cell, and horizontal black bars denote the group mean. Data are representative of 7 independent experiments. (D) Quantification of PbA-specific CD8+ T cell velocities within the cerebral vasculature of d6 p.i. mice before and after i.v. injection of anti-Kb-SIINFEKL or isotype control antibodies. Each dot represents an individual T cell, and horizontal black bars denote the group mean. Data are representative of 4 independent experiments. (E) Design of bone marrow (BM) chimeras used to collect the data shown in (F-J). (F) Survival curves of PbA-infected wild type (WT) into WT and WT into Kb-/-Db-/- BM chimeras (n = 5 per group; 2 independent experiments). (G) Representative flow cytometric plots depicting the frequency (red boxes and adjacent numbers) of Db-SQLLNAKYL-specific CD8 T cells in the spleens WT→WT and WT→Kb-/-Db-/- BM chimeras. Plots are gated CD45+ Thy1.2+ CD8+ cells. (H) Quantification of data from (G) (n = 3 per group; 2 independent experiments). (I and J) Quantification of PbA-specific CD8+ T cell velocities (I) and arrest coefficients (J) within the cerebral vasculature of WT→WT and WT→Kb-/-Db-/- BM chimeras at d6 p.i. Mice were seeded with 104 naïve mCerulean+ OT-I cells and infected with PbA-OVA-mCherry. Each dot represents an individual T cell, and horizontal black bars denote the group mean. Data are representative of 7 independent experiments. Asterisks denote statistical significance (*P < 0.05).
Fig 9
Fig 9. Brainstem pathology is absent in Kb-/-Db-/- BM chimeras.
(A) Representative confocal images of sagittal brain sections from a wild type BM chimera mouse (top) or a Kb-/-D-/- BM chimera (bottom) at d6 p.i. following simultaneous i.v. injection of Evans blue (white) and propidium iodide (red) to visualize vascular leakage and cell death, respectively (n = 4 mice per group). Cell nuclei are shown in blue. (B) Representative confocal images of the brainstem from a wild type BM chimera mouse (top) or a Kb-/-D-/- BM chimera (bottom) at d6 p.i. following propidium iodide (red) injection and immunohistochemical staining for NeuN+ neurons (green). Cell nuclei are shown in blue. (C) The bar graph shows quantification of data shown in (B). Each bar represents the total number of brainstem cells that are PI+ (gray), and within the bar, the red coloration shows the proportion that are also NeuN+ (mean ± SD; n = 4 mice per group; 1 brain section per mouse; 4 images per brain section). Asterisks denote a statistically significant difference from all other groups (***P < 0.05).

Similar articles

Cited by

References

    1. World Health Organization. (2013) World malaria report 2013 (World Health Organization, Geneva: ) pp xxviii, 253 p.
    1. Milner DA Jr., Lee JJ, Frantzreb C, Whitten RO, Kamiza S, et al. (2015) Quantitative Assessment of Multiorgan Sequestration of Parasites in Fatal Pediatric Cerebral Malaria. J Infect Dis 212(8):1317–1321. 10.1093/infdis/jiv205 - DOI - PMC - PubMed
    1. Haldar K, Murphy SC, Milner DA, & Taylor TE (2007) Malaria: mechanisms of erythrocytic infection and pathological correlates of severe disease. Annu Rev Pathol 2:217–249. 10.1146/annurev.pathol.2.010506.091913 - DOI - PubMed
    1. Newton PN, Stepniewska K, Dondorp A, Silamut K, Chierakul W, et al. (2013) Prognostic indicators in adults hospitalized with falciparum malaria in Western Thailand. Malar J 12:229 10.1186/1475-2875-12-229 - DOI - PMC - PubMed
    1. Murphy SC & Breman JG (2001) Gaps in the childhood malaria burden in Africa: cerebral malaria, neurological sequelae, anemia, respiratory distress, hypoglycemia, and complications of pregnancy. Am J Trop Med Hyg 64(1–2 Suppl):57–67. - PubMed