

Prevalence, Profile, and Prognosis of Severe Obesity in Contemporary Hospitalized Heart Failure Trial Populations
- PMID: 27908391
- PMCID: PMC6693578
- DOI: 10.1016/j.jchf.2016.09.013
Prevalence, Profile, and Prognosis of Severe Obesity in Contemporary Hospitalized Heart Failure Trial Populations
Abstract
Objectives: This study evaluated the prevalence, profile, and prognosis of severe obesity in a large contemporary acute heart failure (AHF) population.
Background: Better prognosis has been reported for obese heart failure (HF) patients than nonobese HF patients, but in other cardiovascular populations, this effect has not been demonstrated for severely obese patients.
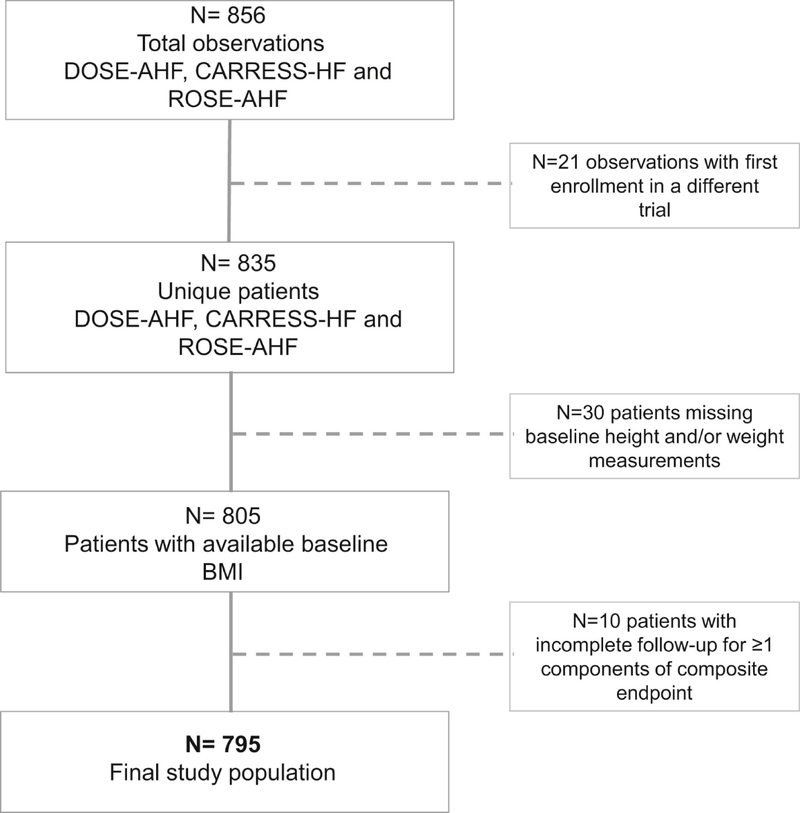
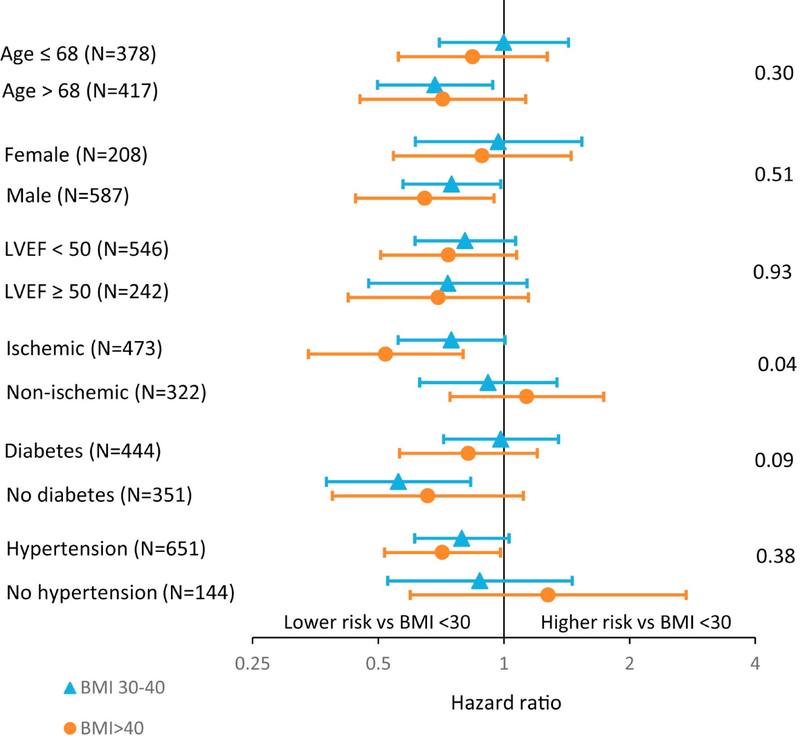
Methods: A cohort of 795 participants with body mass index (BMI) measured at time of admission and complete follow-up were identified from enrollment in 3 contemporary AHF trials (DOSE [Diuretic Strategies Optimization Evaluation], CARRESS-HF [Cardiorenal Rescue Study in Acute Decompensated Heart Failure], and ROSE [Renal Optimization Strategies Evaluation in Acute Heart Failure]). Patients were divided into 4 BMI categories according to standard World Health Organization criteria, as follows: normal weight: 18.5 to 25 kg/m2 [n = 128]; overweight: 25 to 29.9 kg/m2 [n = 209]; mild-to-moderate obese: 30 to 39.9 kg/m2 [n = 301]; and severely obese: ≥40 kg/m2 [n = 157]). The relationship between BMI and 60-day composite outcome (death, rehospitalization, or unscheduled provider visit) was investigated.
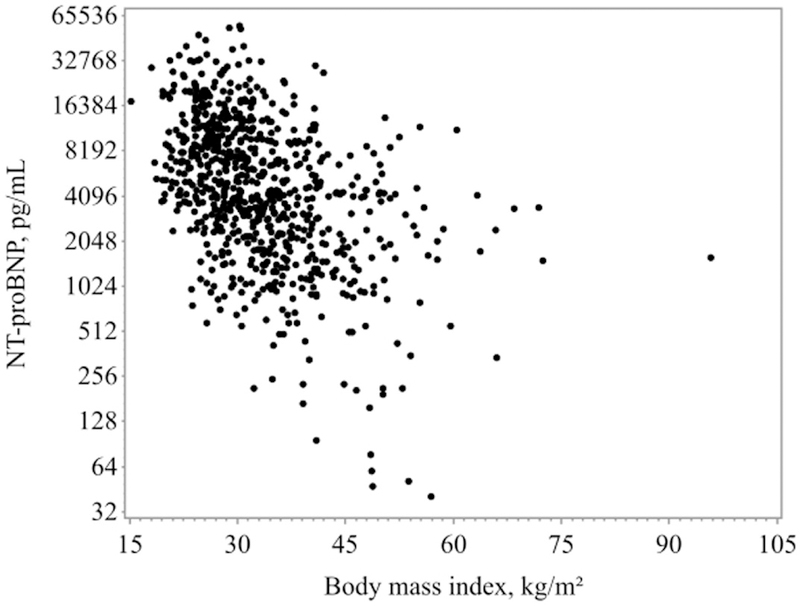
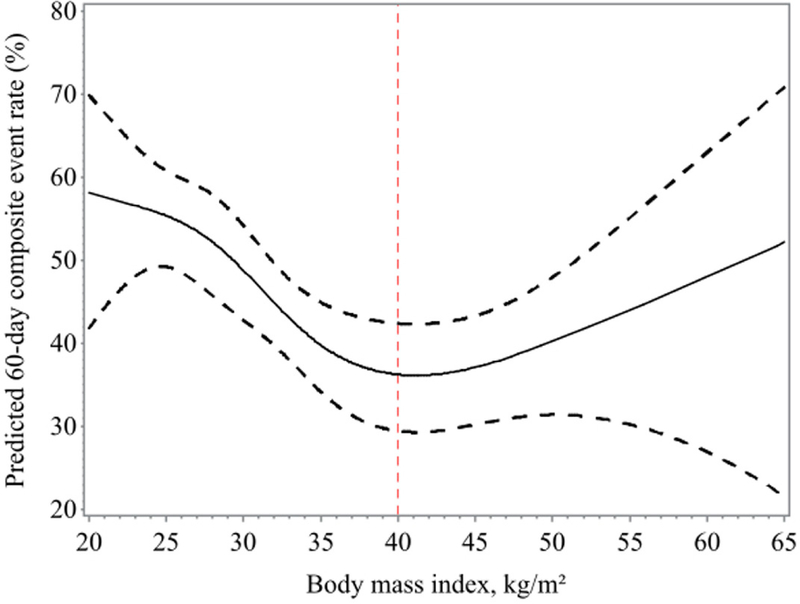
Results: Patients with severe obesity (19.7%) were younger, more often female, hypertensive, diabetic, and more likely to have higher blood pressures and left ventricular ejection fraction, and lower N-terminal pro-B-type natriuretic peptide and troponin I levels than other BMI category patients. Following admission for AHF, patients with normal weight showed the highest risk of 60-day composite outcome, followed by patients who were severely obese. Overweight and mild-moderately obese patients showed lowest risk.
Conclusions: Nearly one-fifth of AHF patients enrolled in contemporary randomized clinical trials are severely obese. A U-shaped curve for short-term prognosis according to BMI is seen in AHF. These findings may help to better inform both HF clinical care and future clinical trial planning.
Keywords: acute decompensated heart failure; obesity; prognosis; severe obesity.
Copyright © 2016 American College of Cardiology Foundation. Published by Elsevier Inc. All rights reserved.
Figures
Comment in
-
Severe Obesity and Acute Decompensated Heart Failure: New Insights Into Prevalence and Prognosis.JACC Heart Fail. 2016 Dec;4(12):932-934. doi: 10.1016/j.jchf.2016.10.008. JACC Heart Fail. 2016. PMID: 27908392 No abstract available.
References
-
- Flegal KM, Carroll MD, Ogden CL, Johnson CL. Prevalence and trends in obesity among US adults, 1999–2000. JAMA 2002;288:1723–7. - PubMed
-
- Mozaffarian D, Benjamin EJ, Go AS et al. Heart Disease and Stroke Statistics-2016 Update: A Report From the American Heart Association. Circulation 2016;133:e38–e360. - PubMed
-
- Lavie CJ, Milani RV, Ventura HO. Obesity and cardiovascular disease: risk factor, paradox, and impact of weight loss. J Am Coll Cardiol 2009;53:1925–32. - PubMed
Publication types
MeSH terms
Substances
Grants and funding
LinkOut - more resources
Full Text Sources
Other Literature Sources
Medical
Research Materials
Miscellaneous
