. 2017 Mar 3;120(5):816-834.
doi: 10.1161/CIRCRESAHA.116.309782. Epub 2016 Dec 1.

A Deep Proteome Analysis Identifies the Complete Secretome as the Functional Unit of Human Cardiac Progenitor Cells

Affiliations

A Deep Proteome Analysis Identifies the Complete Secretome as the Functional Unit of Human Cardiac Progenitor Cells

Sudhish Sharma et al. Circ Res. .

Abstract

Rationale: Cardiac progenitor cells are an attractive cell type for tissue regeneration, but their mechanism for myocardial remodeling is still unclear.

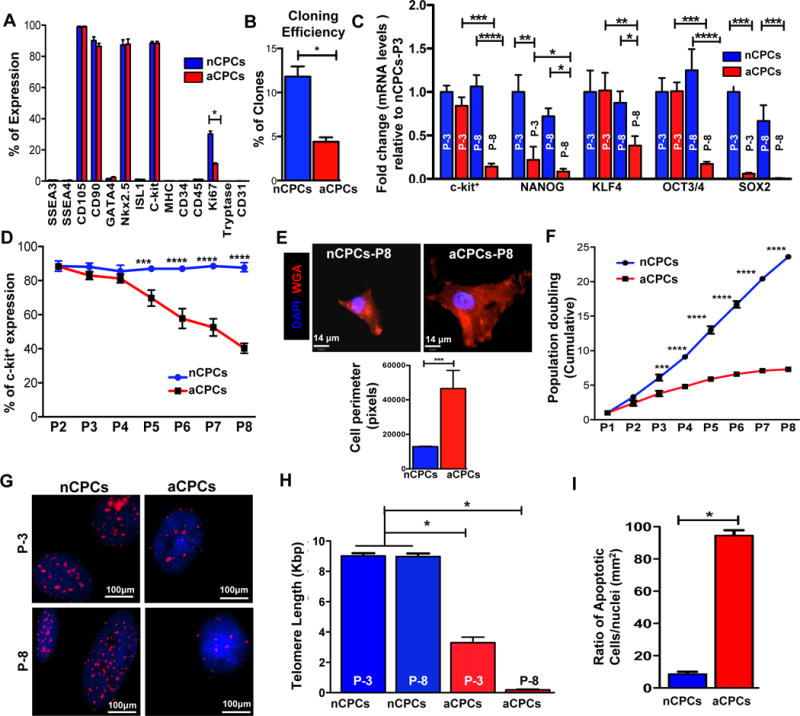
Objective: This investigation determines how chronological age influences the phenotypic characteristics and the secretome of human cardiac progenitor cells (CPCs), and their potential to recover injured myocardium.

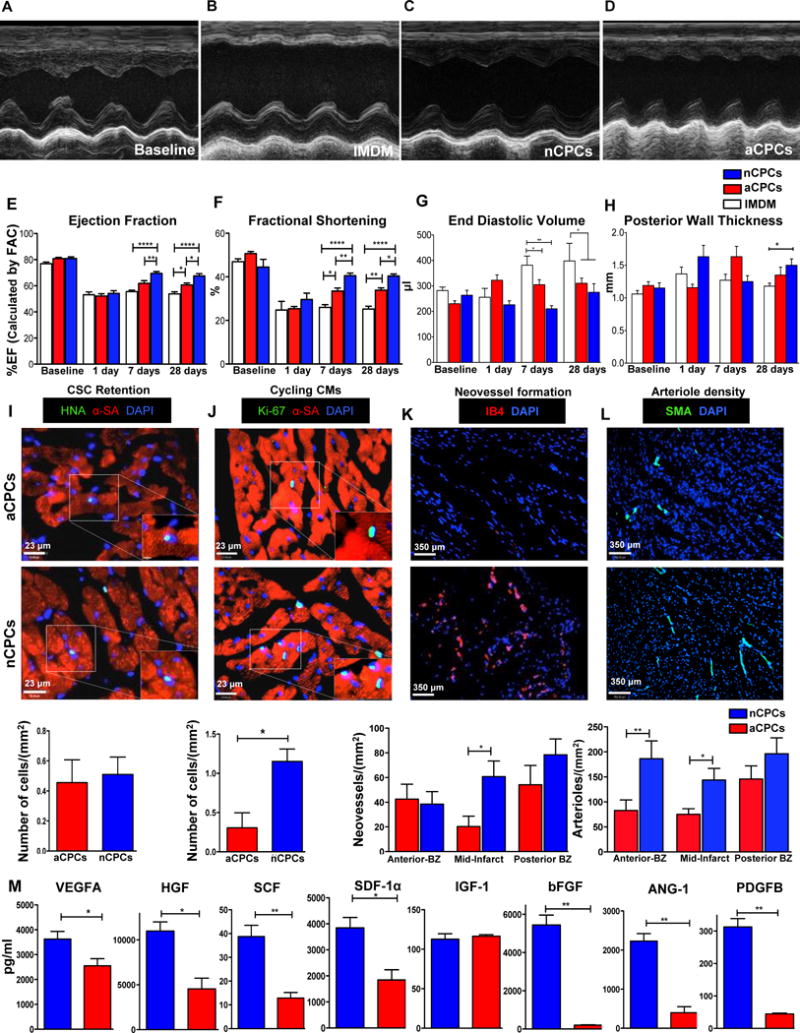
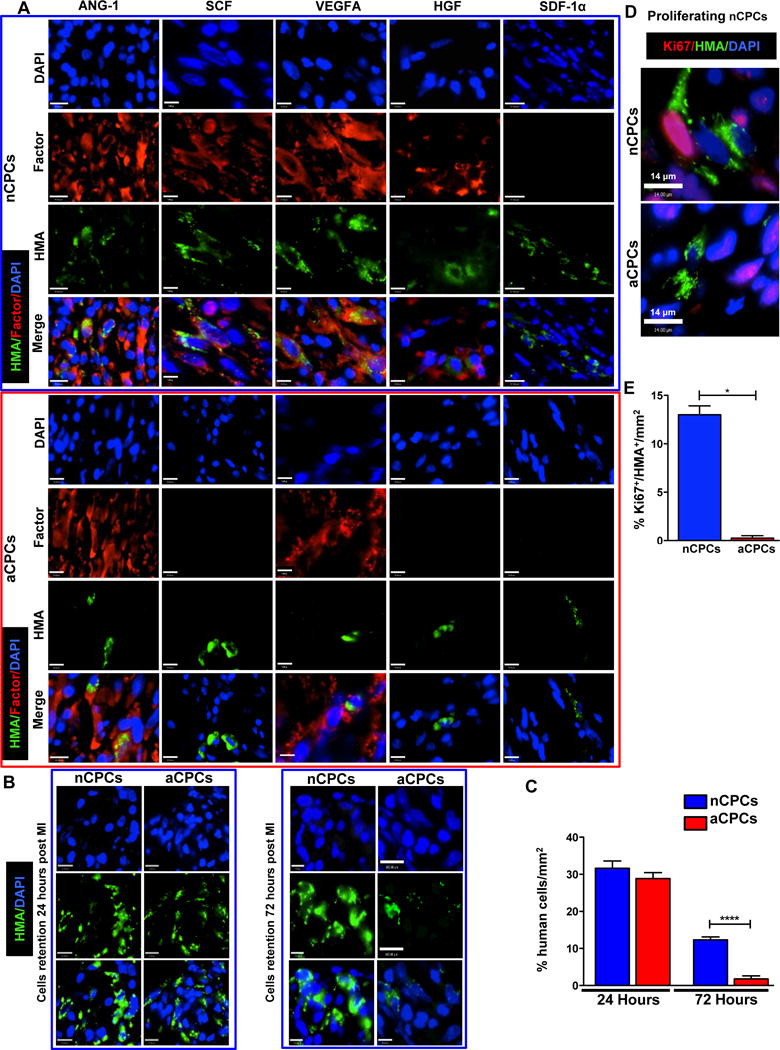
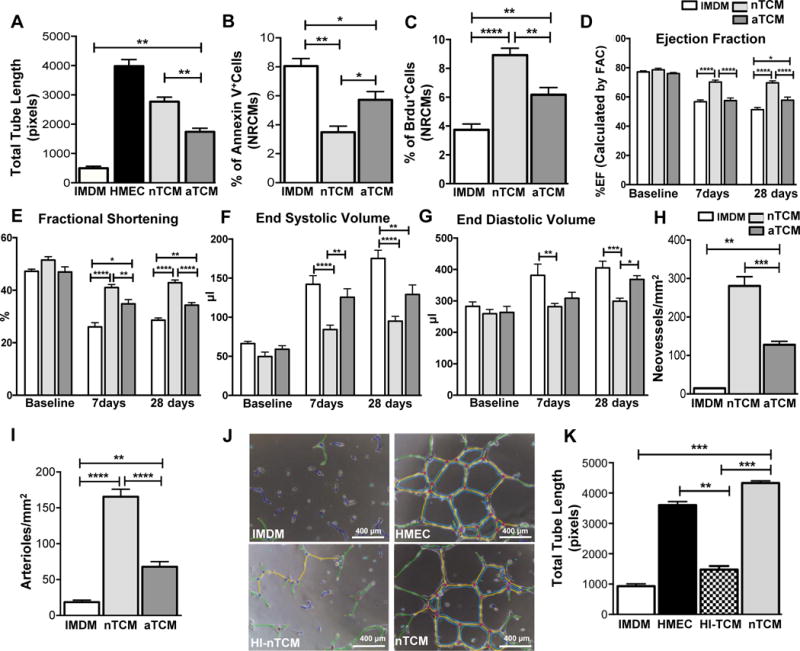
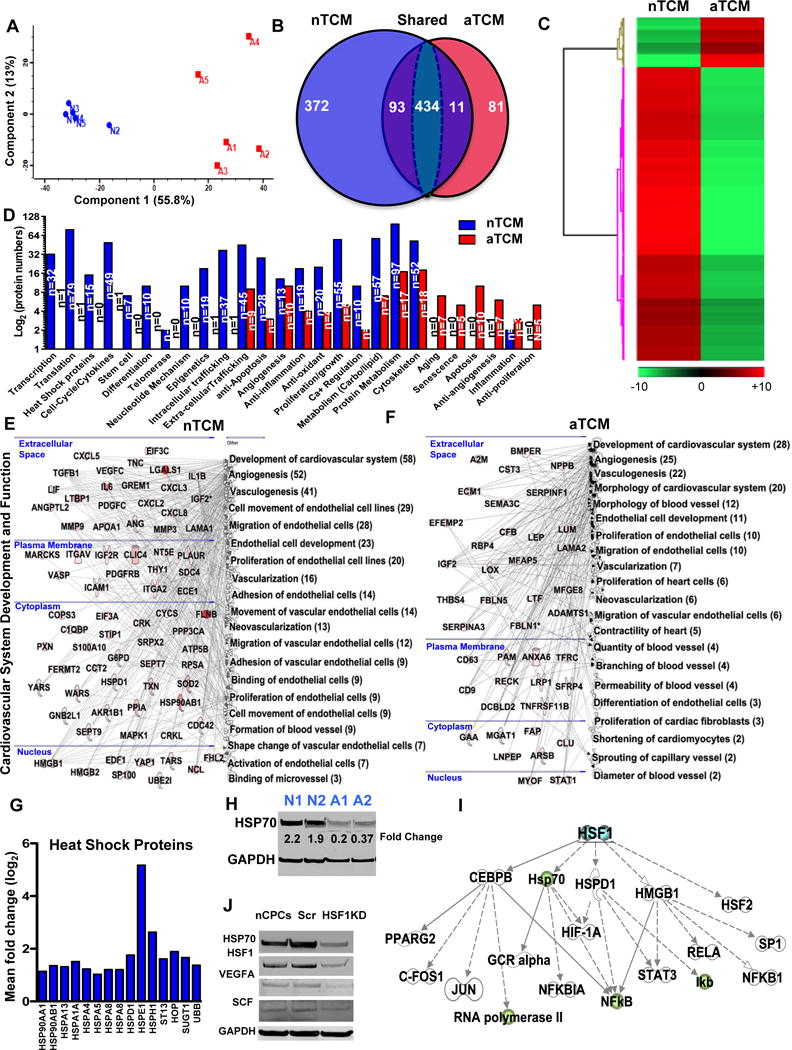
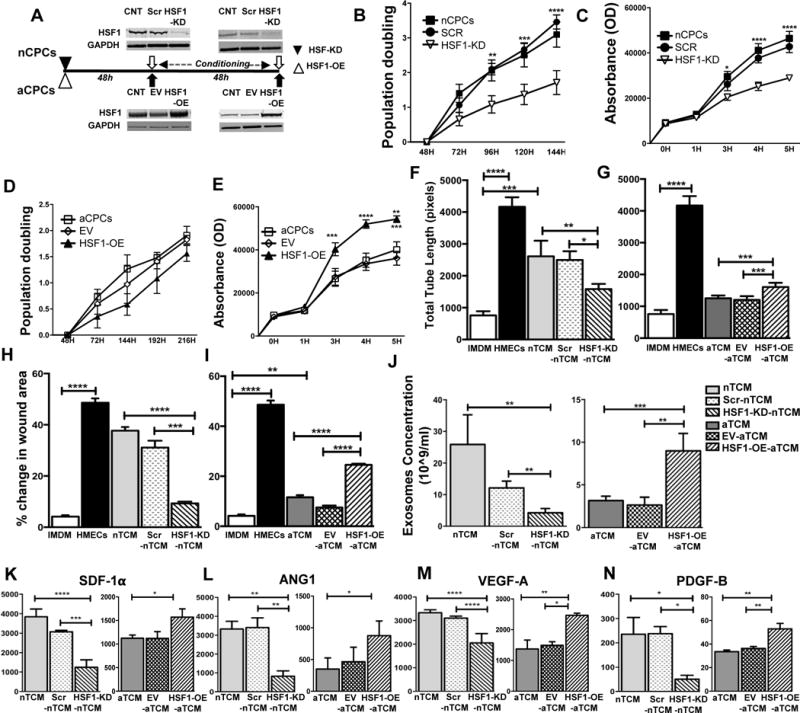
Methods and results: Adult (aCPCs) and neonatal (nCPCs) cells were derived from patients aged >40 years or <1 month, respectively, and their functional potential was determined in a rodent myocardial infarction model. A more robust in vitro proliferative capacity of nCPCs, compared with aCPCs, correlated with significantly greater myocardial recovery mediated by nCPCs in vivo. Strikingly, a single injection of nCPC-derived total conditioned media was significantly more effective than nCPCs, aCPC-derived TCM, or nCPC-derived exosomes in recovering cardiac function, stimulating neovascularization, and promoting myocardial remodeling. High-resolution accurate mass spectrometry with reverse phase liquid chromatography fractionation and mass spectrometry was used to identify proteins in the secretome of aCPCs and nCPCs, and the literature-based networking software identified specific pathways affected by the secretome of CPCs in the setting of myocardial infarction. Examining the TCM, we quantified changes in the expression pattern of 804 proteins in nCPC-derived TCM and 513 proteins in aCPC-derived TCM. The literature-based proteomic network analysis identified that 46 and 6 canonical signaling pathways were significantly targeted by nCPC-derived TCM and aCPC-derived TCM, respectively. One leading candidate pathway is heat-shock factor-1, potentially affecting 8 identified pathways for nCPC-derived TCM but none for aCPC-derived TCM. To validate this prediction, we demonstrated that the modulation of heat-shock factor-1 by knockdown in nCPCs or overexpression in aCPCs significantly altered the quality of their secretome.

Conclusions: A deep proteomic analysis revealed both detailed and global mechanisms underlying the chronological age-based differences in the ability of CPCs to promote myocardial recovery via the components of their secretome.

Keywords: adult stem cells; exosomes; heat-shock proteins; myocardial ischemia; proteomics; stem cells.


Figures

Figure 1
Figure 1. Phenotypic characterization and growth potential of nCPCs and aCPCs at different passages
(A). Flow cytometry analysis of nCPCs and aCPCs for stem cell specific surface markers (SSEA3, SSEA3, CD105, CD90, CD34, CD45), cardiac lineage markers (MHC, GATA4, NKX2.5, ISL1), and mast cell marker (tryptase) (n=4). See also Online Figure I A–M. (B). Clonal efficiency of nCPCs and aCPCs (n=5). See also Online Figure I N (C). Quantitative PCR for expression levels of c-kit+, NANOG, SOX2, KLF4, and OCT3/4 at P3 and P8 in nCPCs and aCPCs (n=5). (D). C-kit+ expression in nCPCs and aCPCs at P3 and P8 as quantified by FACS analysis. See also Online Figure II A. (E). Representative immunofluorescence picture (top panel) of nCPCs and aCPCs stained for wheat germ agglutinin (WGA) at P8. Quantification of change in the cell perimeter (bottom panel) as analyzed from five random fields. See also Online Figure II C. (F). Cellular growth potential of nCPCs and aCPCs recorded as cumulative population doubling (n=5). (G). Telomeres in nCPCs and aCPCs nuclei (red dots) at P3 and P8 were identified by using quantitative fluorescence in-situ hybridization (Q-FISH). (H). Telomere length in nCPCs and aCPCs at P3 and P8 identified using flow FISH. A significant difference was observed in the telomere length of aCPCs at P3 and P8. Data were analyzed by t-test or Mann-Whitney test using GraphPad software and represented as mean ± SEM. P=0.0585, n=5. See also Online Figure II D. (I) Quantification of apoptosis for TUNEL+ cells in nCPCs and aCPCs after hydrogen peroxide stress. (See also Online Figure III B). All data were represented as mean ± SEM (n=5–8), *P<0.05, **P<0.01, ***P<0.001 and ****P<0.0001. Data were analyzed using 2-way ANOVA followed by Bonferroni posttests (B), 1-way ANOVA followed by Kruskal-Wallis test (n=6), t-test followed by Mann-Whitney’s analysis (I, n=6) and Wilcoxcon matched-pairs signed rank test.
Figure 2
Figure 2. Cardiac functional assessment and histological analysis in the MI model after CPC transplantation
(A–D). Representative M-mode tracings from animals at baseline and 4 weeks post-MI treated with IMDM (basal medium), nCPCs, or aCPCs. (E–H). Structural and functional parameters derived from echocardiography measurements are shown at baseline and post-MI. Four weeks post-MI sections were immunostained for (I) human nuclear antigen (HNA) and α-sarcomeric actin (α-SA), (J) Ki67 and α- sarcomeric actin (α-SA), (K) neovessels marked by IB4 expression, and (L) arterioles marked by α-smooth muscle action (α-SMA) expression in different heart regions. Nuclei were labeled with 4′,6-diamidino-2-phenylindole (DAPI; blue) in all images. (M) ELISA performed on nCPCs (P3) and aCPCs (P3) derived total conditioned medium (TCM). All the data were represented as mean ± SEM, *P<0.05, **P<0.01, ***P<0.001 and ****P<0.0001. Data were analyzed using 2-way ANOVA followed by Bonferroni post tests (E–H, n=8–13), t-test followed by Mann-Whitney analysis (I–J, M, n=6) and 2-way ANOVA followed by Tukey post-test (K, L n=10). See also Online Figure IV.
Figure 3
Figure 3. Characterization of secreted paracrine factors and transplanted CPCs 72 hours post-MI
(A). 72 hours post-MI, representative immunofluorescence images for five selected paracrine factors secreted by transplanted nCPCs or aCPCs in rat myocardium. Immunohistology performed with HMA (green), DAPI (blue), and paracrine factors (red): ANG-1, SCF, VEGFA, HGF and SDF-1α. (B–C). Representative immunofluorescence images and quantification for retention of transplanted nCPCs and aCPCs at 24 hours and 72 hours post-MI using HMA tracking. (D–E). Representative immunofluorescence images and quantification for transplanted cells proliferation (Ki67) of transplanted nCPCs or aCPCs in infarcted rat myocardium after 72 hours. Data were represented as mean ±SEM, *P<0.05, ****P<0.0001. Data were analyzed by two-way ANOVA (n=5) (C) followed by Tukey post-test test and by t-test (E), followed by Mann-Whitney test. See also Online Figure V.
Figure 4
Figure 4. Functional characterization of the total conditioned medium (TCM) derived from nCPCs and aCPCs in vitro and in vivo
(A). Quantification for total tube length formation after incubation with IMDM, HMECs complete growth medium, nTCM and aTCM. (B). Quantification for annexin V expression by neonatal rat cardiomyocytes (NRCMs) after treatment with H2O2 treatment in the presence or absence of nTCM or aTCM. (C). Quantification for BrdU uptake by proliferating NRCMs in the presence or absence of nTCM or aTCM after 72 hours. See also Online Figure VI. (D–G). Cardiac functional parameters derived from echocardiography measurements after injection of nTCM, aTCM, and IMDM (control). (H–I) Quantification for neovessels marked by IB4 expression and for arterioles marked by α-SMA expression 4 weeks post MI. See also Online figure VII A. (J–K). Representative images of HMECs tube formation and quantification of total tube length after incubation with IMDM, HMECs media, nTCM and heat inactivated nTCM (HI-TCM). Data were represented as mean ±SEM, *P<0.05, **P<0.01, ***P<0.001. Data were analyzed by one-way ANOVA followed by Bonferroni post hoc test (A, (n=6), B–C (n=4), (H–I, (n=5) and K, (n=4) and 2-way ANOVA (D-G (n=8-11) followed by Tukey post hoc test.
Figure 5
Figure 5. Functional characterization of total conditioned medium, exosomes, and exosome-free fraction in vitro and in vivo
(A). Quantification of total tube length formation by HMECs after incubation with IMDM basal medium, HMEC complete growth medium, nTCM, nEXO and nEF using ImageJ software (angiogenesis). See also Online Figure IX B. (B). Quantification of percentage change in wound closure after 22h incubation with IMDM basal medium, HMEC complete growth medium, nTCM, nEXO, or nEF as analyzed using ImagePro Premier software. See also Online Figure IX C. (C). Relative percentage distribution of protein between nEXO and nEF following ELISA for 8 paracrine factors. (D–E). Functional parameters derived from echocardiography measurements are shown at baseline, 7 days, and 28 days post-MI. (F) Quantification of fibrosis was done in each group using Image Pro software. See also Online Figure IX E (G–H). Quantification of neovessels marked by IB4 expression and arterioles marked by α-SMA expression 4 weeks post-MI after treatment with nCPCs, nTCM, or nEXOs. See also Online Figure IX D. Data were represented as mean ±SEM, *P<0.05, **P<0.01, ***P<0.001, ****P <0.0001. Data were analyzed by one-way ANOVA (A–B, F–H) followed by Bonferroni’s test, 2-way ANOVA (C–E, n=7–10) followed by Tukey post-test. See also Online figure VIII.
Figure 6
Figure 6. In-depth proteomic analysis of the secretome derived from nCPCs and aCPCs
(A). Principal component analysis (PCA) of nTCM (blue) and aTCM (red), where each dot represents one of five independent biological replicates. (B). Venn diagram depicting unique, shared, and non-redundant identified proteins between the nTCM and aTCM. (C). Heat-map indicating protein distribution in nCPCs and aCPCs, as determined by quantitative proteomics. Hierarchical clustering is shown, clusters of positive (red; up-regulated) and negative (green; down-regulated) correlations showed the log2 fold expression changes. (D). Proteins identified in nTCM and aTCM were further classified in different groups according to their reported molecular functions and biological properties. The x-axis shows protein groups, organized according to their functions, and the y-axis represents the relative number of proteins. (E). IPA analysis highlighting the roles of 74 unique nTCM proteins in cardiovascular system development and function. (F). IPA analysis highlighting the roles of 41 unique aTCM proteins in cardiovascular system development and function. (G). The proteins with log2 fold changes of ≥ 1 and ≤ −1 identified in nTCM and aTCM were further analyzed for their roles in Heat Shock proteins (H). Immunoblot analysis of HSP70 expression levels in two nTCM samples (N1 and N2) as compared to two aTCM samples (A1 and A2). (I). IPA network analysis demonstrates HSF1 as an upstream regulator of several key pathways. (J). Immunoblot analysis of expression levels of HSP70, HSF1, VEGF-A, and SCF after knockdown of HSF1. See also Online Figure X–XI.
Figure 7
Figure 7. Effects of knockdown of HSF1 in nCPCs and overexpression in aCPCs
(A) Experimental timeline and workflow of the transfections and subsequent conditioning of CPCs. Immunoblot analysis demonstrated relative HSF1 expression in nCPCs (above line) and aCPCs (below line) pre- and post-conditioning. Effect of HSF1 knockdown on cellular properties of nCPCs: (B) The growth potential, recorded as cumulative population doubling (n=4) and (C) metabolic activity, as identified by Alamar Blue assay. Effect of HSF1 overexpression on cellular properties of aCPCs: (D) The growth potential, recorded as cumulative population doubling (n=3) and (E) metabolic activity, as identified by Alamar Blue assay. HSF1 regulates the functional potential of CPC conditioned medium: (F–G) Quantification of total HMEC tube length formation following incubation with basal medium (IMDM), complete growth medium (HMEC), nTCM, scrambled nTCM (Scr-nTCM), HSF1 knockdown-nTCM (HSF1-KD-nTCM), aTCM, empty vector aTCM (EV-aTCM), and HSF1 overexpression aTCM (HSF1-OE-aTCM), using ImageJ (nTCM results at left, aTCM results at right). (H–I) Quantification of percentage change in wound closure after 22h treatment with basal medium (IMDM), complete growth medium (HMEC), nTCM, Scr-nTCM, HSF1-KD-nTCM, aTCM, EV-aTCM, and HSF1-OE-aTCM using ImagePro Premier software (nTCM results at left, aTCM results at right). (J) Nanoparticle tracking analysis measurement of exosome concentration in nTCM, Scr-nTCM, and HSF1-KD-nTCM (left) and aTCM, EV-aTCM, and HSF1-OE-aTCM (right). ELISA was performed on nTCM, Scr-nTCM, HSF1-KD-nTCM, aTCM, EV-aTCM, and HSF1-OE-aTCM, to quantify paracrine factors: (K) SDF1α, (L) ANG1, (M) VEGF-A, (N) PDGF-B in their respective secretomes. See also Online Figure XII–XIII. Data are represented as mean ±SEM, *P<0.05, **P<0.01, ***P<0.001, ****P <0.0001 and were analyzed by 1way ANOVA followed by Bonferroni’s test.

Comment in

Similar articles

Cited by

References

    1. Gerber Y, Weston SA, Redfield MM, Chamberlain AM, Manemann SM, Jiang R, Killian JM, Roger VL. A contemporary appraisal of the heart failure epidemic in olmsted county, Minnesota, 2000 to 2010. JAMA internal medicine. 2015;175:996–1004. - PMC - PubMed
    1. Mozaffarian D, Benjamin EJ, Go AS, Arnett DK, Blaha MJ, Cushman M, Das SR, de Ferranti S, Despres JP, Fullerton HJ, Howard VJ, Huffman MD, Isasi CR, Jimenez MC, Judd SE, Kissela BM, Lichtman JH, Lisabeth LD, Liu S, Mackey RH, Magid DJ, McGuire DK, Mohler ER, 3rd, Moy CS, Muntner P, Mussolino ME, Nasir K, Neumar RW, Nichol G, Palaniappan L, Pandey DK, Reeves MJ, Rodriguez CJ, Rosamond W, Sorlie PD, Stein J, Towfighi A, Turan TN, Virani SS, Woo D, Yeh RW, Turner MB. Executive Summary: Heart Disease and Stroke Statistics–2016 Update: A Report From the American Heart Association. Circulation. 2016;133:447–54. - PubMed
    1. Gerber Y, Weston SA, Enriquez-Sarano M, Berardi C, Chamberlain AM, Manemann SM, Jiang R, Dunlay SM, Roger VL. Mortality Associated With Heart Failure After Myocardial Infarction: A Contemporary Community Perspective. Circulation Heart failure. 2016;9:e002460. - PMC - PubMed
    1. Crisostomo V, Casado JG, Baez-Diaz C, Blazquez R, Sanchez-Margallo FM. Allogeneic cardiac stem cell administration for acute myocardial infarction. Expert review of cardiovascular therapy. 2015;13:285–99. - PubMed
    1. Sanina C, Hare JM. Mesenchymal Stem Cells as a Biological Drug for Heart Disease: Where Are We With Cardiac Cell-Based Therapy? Circulation research. 2015;117:229–33. - PMC - PubMed