. 2017 Feb;66(2):372-384.
doi: 10.2337/db16-1102. Epub 2016 Dec 1.

The Hypothalamic Glucagon-Like Peptide 1 Receptor Is Sufficient but Not Necessary for the Regulation of Energy Balance and Glucose Homeostasis in Mice

Affiliations

The Hypothalamic Glucagon-Like Peptide 1 Receptor Is Sufficient but Not Necessary for the Regulation of Energy Balance and Glucose Homeostasis in Mice

Melissa A Burmeister et al. Diabetes. 2017 Feb.

Abstract

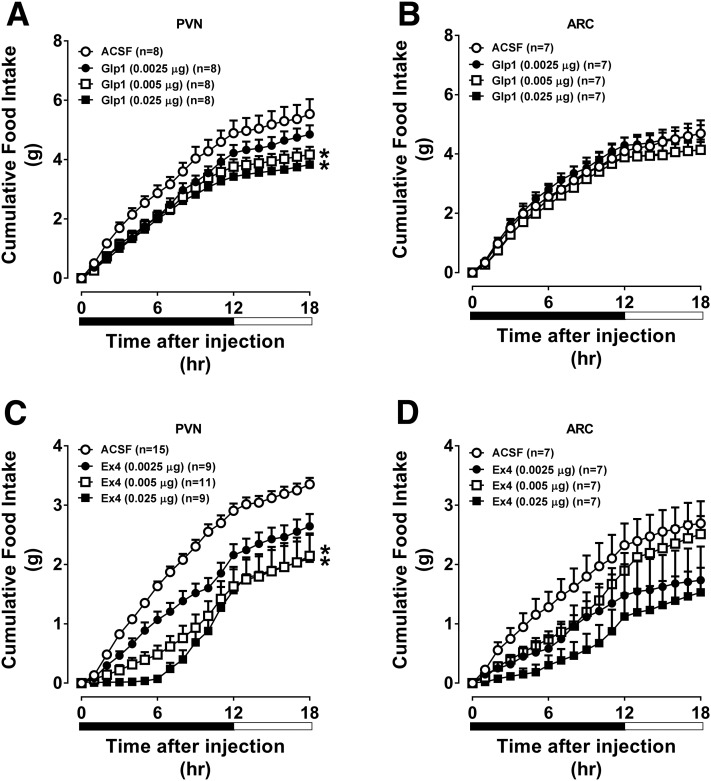
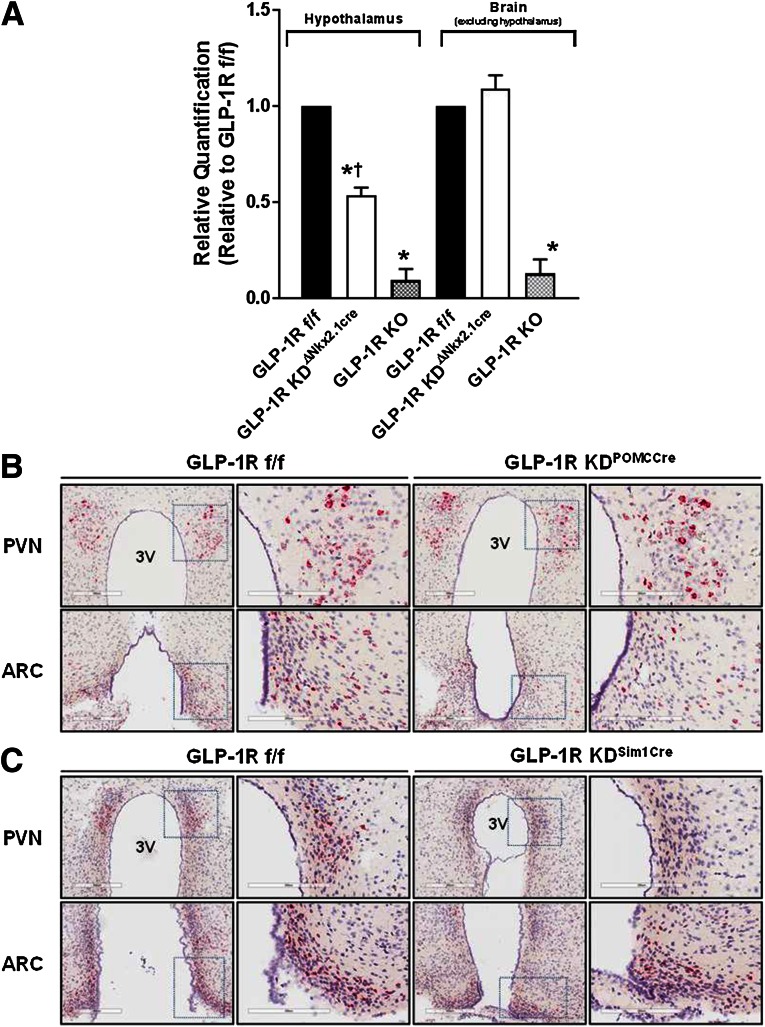
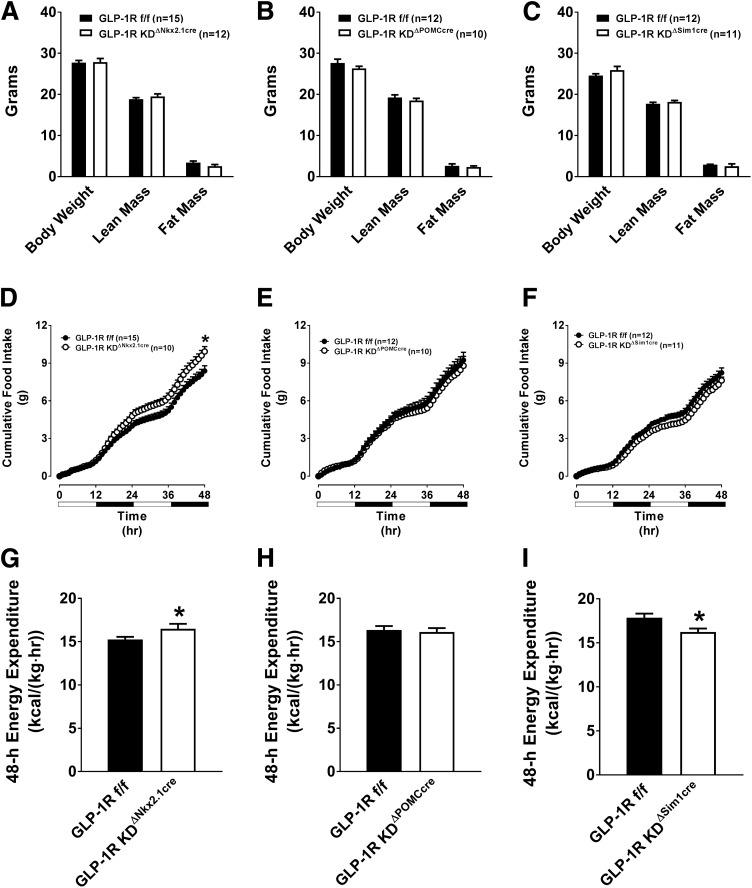
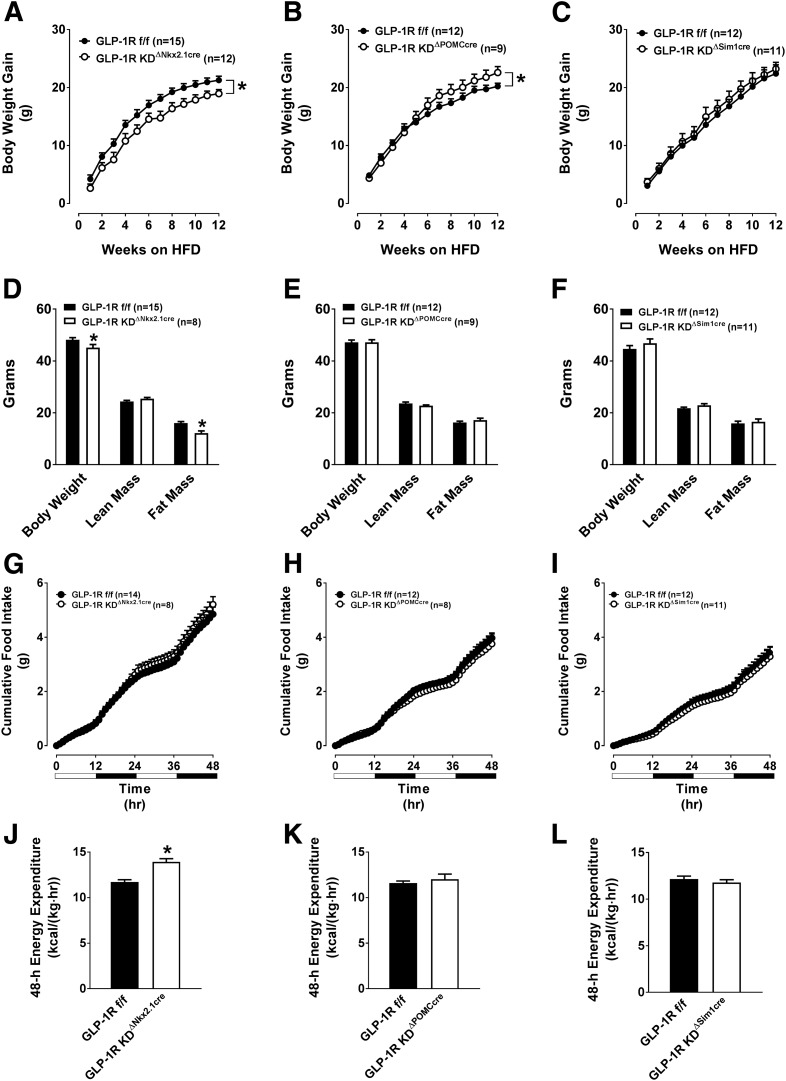
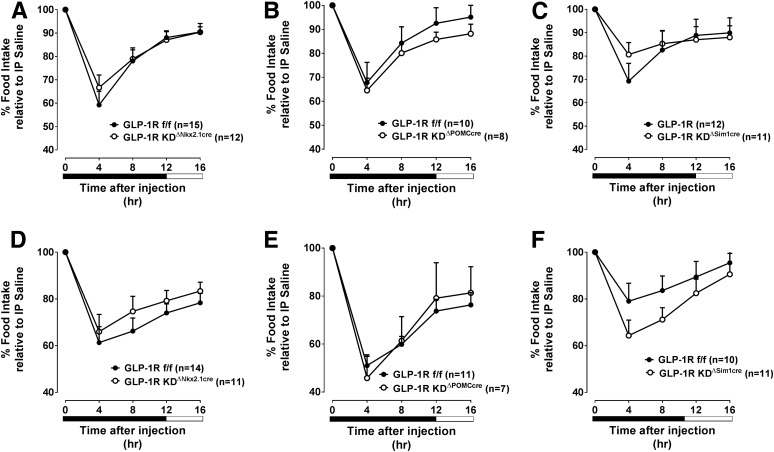
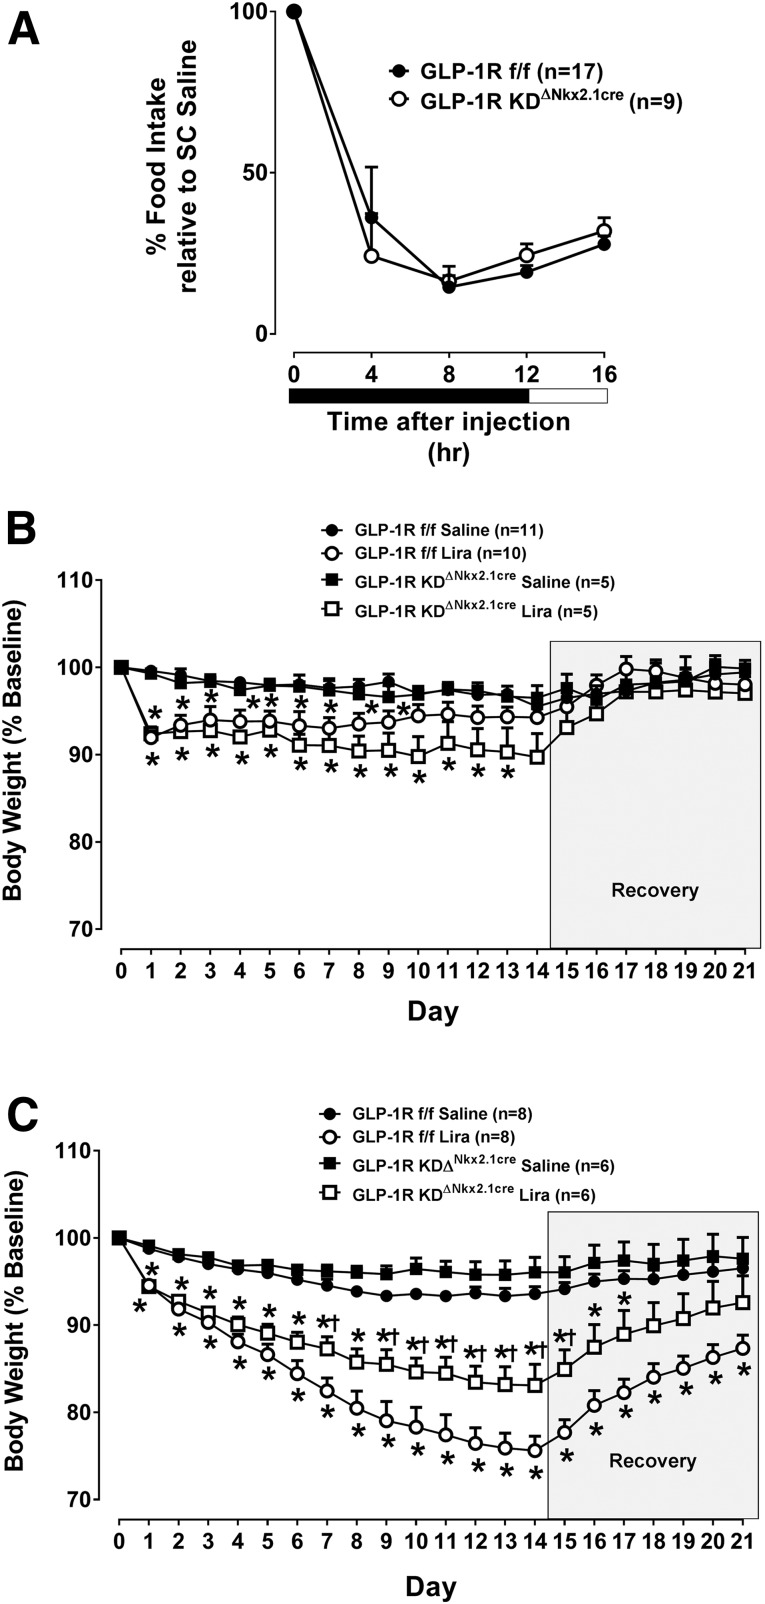
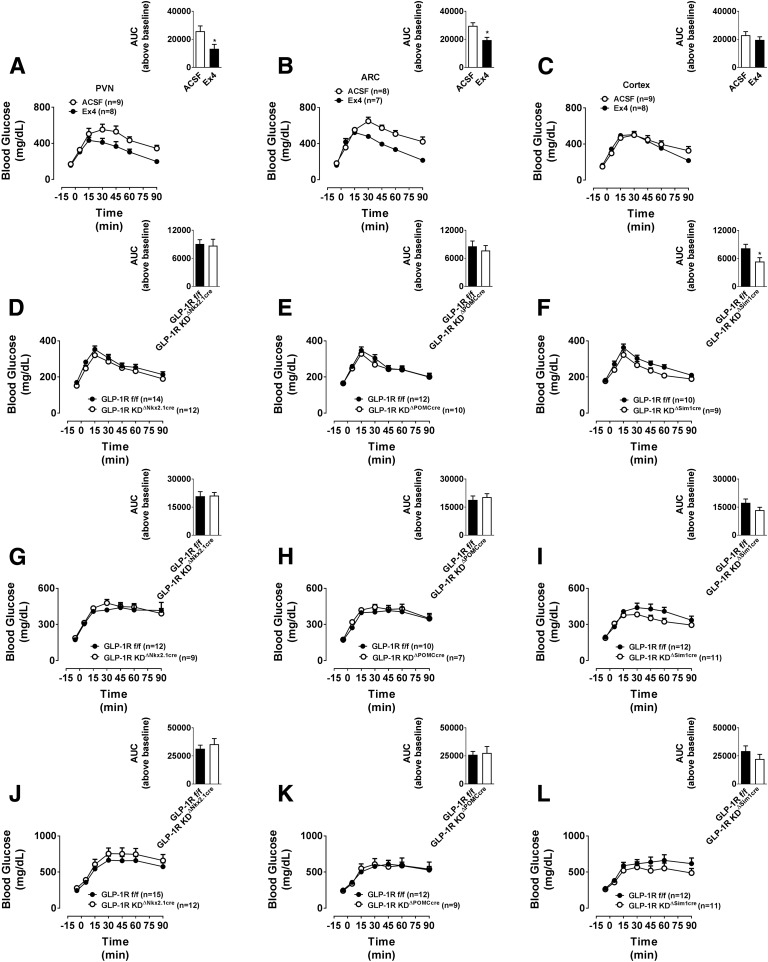
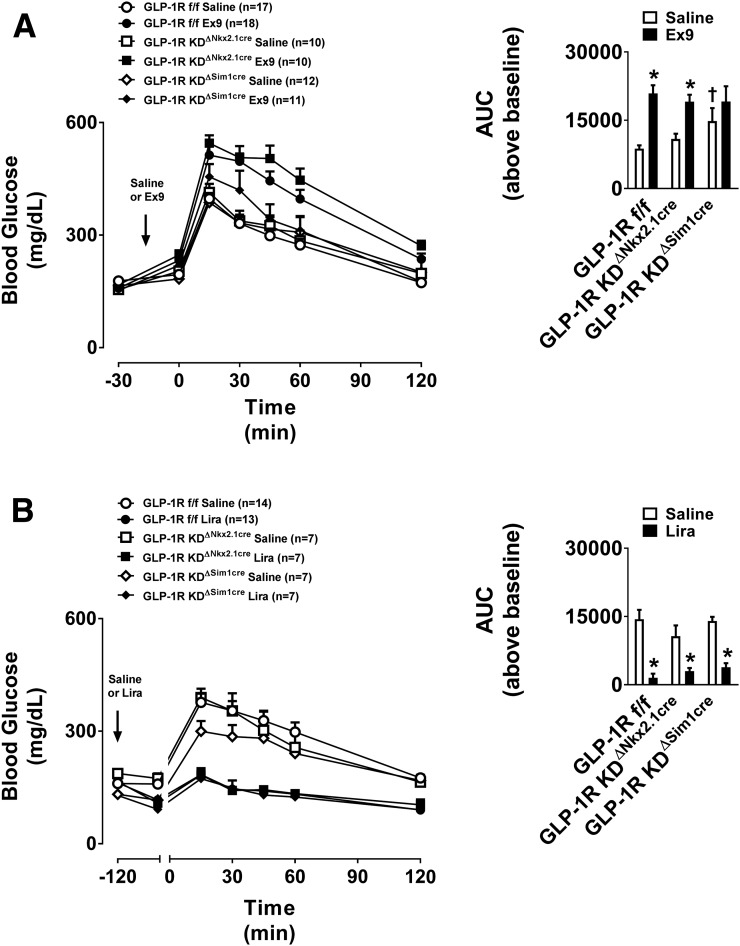
Pharmacological activation of the hypothalamic glucagon-like peptide 1 (GLP-1) receptor (GLP-1R) promotes weight loss and improves glucose tolerance. This demonstrates that the hypothalamic GLP-1R is sufficient but does not show whether it is necessary for the effects of exogenous GLP-1R agonists (GLP-1RA) or endogenous GLP-1 on these parameters. To address this, we crossed mice harboring floxed Glp1r alleles to mice expressing Nkx2.1-Cre to knock down Glp1r expression throughout the hypothalamus (GLP-1RKDΔNkx2.1cre). We also generated mice lacking Glp1r expression specifically in two GLP-1RA-responsive hypothalamic feeding nuclei/cell types, the paraventricular nucleus (GLP-1RKDΔSim1cre) and proopiomelanocortin neurons (GLP-1RKDΔPOMCcre). Chow-fed GLP-1RKDΔNkx2.1cre mice exhibited increased food intake and energy expenditure with no net effect on body weight. When fed a high-fat diet, these mice exhibited normal food intake but elevated energy expenditure, yielding reduced weight gain. None of these phenotypes were observed in GLP-1RKDΔSim1cre and GLP-1RKDΔPOMCcre mice. The acute anorectic and glucose tolerance effects of peripherally dosed GLP-1RA exendin-4 and liraglutide were preserved in all mouse lines. Chronic liraglutide treatment reduced body weight in chow-fed GLP-1RKDΔNkx2.1cre mice, but this effect was attenuated with high-fat diet feeding. In sum, classic homeostatic control regions are sufficient but not individually necessary for the effects of GLP-1RA on nutrient homeostasis.


Figures

Figure 1
Figure 1
Direct injection of Ex4 into the PVN or ARC of the hypothalamus robustly suppresses food intake, whereas GLP-1 only modestly suppresses food intake. The values are mean ± SEM and represent the time-course of cumulative 18-h food intake in chow-fed C57BL/6J mice receiving GLP-1 or Ex4 (0.0025, 0.005, or 0.025 µg) or ACSF (100 nL bilateral [PVN] or unilateral [ARC]) in the PVN (A and C) or ARC (B and D). n = 7–15 mice/group. *P < 0.05 vs. ACSF.
Figure 2
Figure 2
A: Cre-recombinase site-selectively knocks down the Glp1r in the hypothalamus. The values are mean ± SEM and represent gene expression levels of the Glp1r in RNA isolates from the hypothalamus or extrahypothalamic brain tissue of GLP-1Rf/f, GLP-1RKDΔNkx2.1cre, and GLP-1RKO mice as determined by qRT-PCR. n = 5 mice/group. *P < 0.05 vs. GLP-1Rf/f. †P < 0.05 vs. GLP-1RKO. Representative histology images showing Glp1r RNA expression in PVN and ARC sections of GLP-1RKDΔPOMCcre (B) and GLP-1RKDΔSim1cre (C) mice, each compared with GLP-1Rf/f controls. Glp1r RNA expression is indicated as a red, chromogenic signal. Images are shown at both 200 μm and 300 μm (magnified area designated by the dashed box). Scale bars are 200 μM and 300 μM for the lower and higher magnification panels, respectively. 3V, third ventricle.
Figure 3
Figure 3
Chow-fed GLP-1RKDΔNkx2.1cre mice exhibit elevated food intake and EE, compared with GLP-1Rf/f controls. The values are mean ± SEM and represent 5-h–fasted body composition (body weight, lean mass, and fat mass), cumulative 48-h food intake, and 48-h EE in GLP-1RKDΔNkx2.1cre (n = 12) (A, D, and G), GLP-1RKDΔPOMCcre (n = 10) (B, E, and H), and GLP-1RKDΔSim1cre (n = 11) (C, F, and I) mice, compared with GLP-1Rf/f controls (n = 12–15). *P < 0.05 vs. GLP-1Rf/f.
Figure 4
Figure 4
Disruption of the GLP-1R in GLP-1RKDΔNkx2.1cre, GLP-1RKDΔPOMCcre, and GLP-1RKDΔSim1cre mice differentially alters HFD-induced weight gain, body composition, and EE. The values are mean ± SEM and represent HFD-induced body weight gain, body composition (body weight, lean mass, and fat mass), cumulative 48-h food intake, and 48-h EE in GLP-1RKDΔNkx2.1cre (n = 12) (A, D, G, and J), GLP-1RKDΔPOMCcre (n = 9) (B, E, H, and K), and GLP-1RKDΔSim1cre (n = 11) (C, F, I, and L) mice, compared with GLP-1Rf/f controls (n = 12–15). *P < 0.05 vs. GLP-1Rf/f.
Figure 5
Figure 5
Disruption of the GLP-1R in Nkx2.1 neurons, POMC neurons, or the PVN does not blunt the food intake–suppressive effect of peripherally dosed Ex4. The values are mean ± SEM and represent 16-h food intake following treatment with Ex4 (3 µg, i.p.) in chow- or HFD-fed (top and bottom panels, respectively) GLP-1RKDΔNkx2.1cre (n = 11–12) (A and D), GLP-1RKDΔPOMCcre (n = 7–8) (B and E), and GLP-1RKDΔSim1cre (n = 11) (C and F) mice, compared with GLP-1Rf/f controls (n = 10–15). Data are shown at 4-h intervals and expressed as a percentage of the food intake response observed following treatment with vehicle.
Figure 6
Figure 6
Disruption of the GLP-1R in Nkx2.1 neurons does not blunt the food intake–suppressive effect of peripherally dosed liraglutide but does impact the compound’s body weight–lowering effect in HFD-fed mice. A: The values are mean ± SEM and represent 16-h food intake following treatment with liraglutide (Lira) (200 µg, s.c.) in chow-fed GLP-1RKDΔNkx2.1cre (n = 9) mice, compared with GLP-1Rf/f controls (n = 17). Data are shown at 4-h intervals and expressed as a percentage of the food intake response observed following treatment with vehicle. B and C: The values are mean ± SEM and represent daily body weight over the course of 21 days in chow-fed (B) or HFD-fed (C) GLP-1RKDΔNkx2.1cre (n = 5–6), compared with GLP-1Rf/f controls (n = 8–11) treated with liraglutide. Data are expressed as a percentage of baseline (i.e., prior to liraglutide treatment) body weight. On days 0–13, morning body weight was measured, and animals received a twice-daily injection of liraglutide (200 µg/kg BW, s.c.) or vehicle. On recovery days 14–21, only morning body weight was measured. *P < 0.05 vs. saline. †P < 0.05 vs. GLP-1Rf/f.
Figure 7
Figure 7
Direct injection of Ex4 into the PVN or ARC of the hypothalamus robustly improves glucose tolerance, whereas disruption of the hypothalamic GLP-1R in GLP-1RKDΔNkx2.1cre, GLP-1RKDΔPOMCcre, and GLP-1RKDΔSim1cre mice does not affect glucose tolerance. The values are mean ± SEM and represent glucose excursion in chow-fed C57BL/6J mice following a gavage of glucose (2 g/kg BW, i.p.) and treatment with Ex4 (0.025 µg) or ACSF (100 nL) in the PVN (n = 8–9) (A), ARC (n = 7–8) (B), or cortex (n = 8–9) (C) at t = 0 min. Inset: Area under the curve (AUC) above baseline for each group. *P < 0.05 vs. ACSF. The values are mean ± SEM and represent glucose excursion in chow- or HFD-fed GLP-1RKDΔNkx2.1cre (n = 9–12) (D, G, and J), GLP-1RKDΔPOMCcre (n = 7–10) (E, H, and K), and GLP-1RKDΔSim1cre (n = 9–11) (F, I, and L) mice, compared with GLP-1Rf/f controls (n = 10–15). D, E, and F: chow diet, oral GTT; G, H, and I: chow diet, intraperitoneal GTT; J, K, and L: HFD, oral GTT. Inset: AUC above baseline for each group. *P < 0.05 vs. ACSF.
Figure 8
Figure 8
Disruption of the GLP-1R in GLP-1RKDΔNkx2.1cre and GLP-1RKDΔSim1cre mice does not impact glucose tolerance following pretreatment with Ex9 or liraglutide (Lira). The values are mean ± SEM and represent glucose excursion in chow-fed GLP-1RKDΔNkx2.1cre (n = 7–10) and GLP-1RKDΔSim1cre (n = 7–12) pretreated with Ex9 (50 µg, i.p.) vs. vehicle (A) or liraglutide (400 µg/kg BW, s.c.) vs. vehicle (B) 15 min (for Ex9 studies) or 120 min (for liraglutide studies) prior to an intraperitoneal glucose challenge. Inset: Area under the curve (AUC) above baseline for each group. *P < 0.05 vs. saline. †P < 0.05 vs. GLP-1Rf/f.

References

    1. Baggio LL, Drucker DJ. Biology of incretins: GLP-1 and GIP. Gastroenterology 2007;132:2131–2157 - PubMed
    1. Fonseca VA, Zinman B, Nauck MA, Goldfine AB, Plutzky J. Confronting the type 2 diabetes epidemic: the emerging role of incretin-based therapies. Am J Med 2010;123:S2–S10 - PubMed
    1. Sisley S, Gutierrez-Aguilar R, Scott M, D’Alessio DA, Sandoval DA, Seeley RJ. Neuronal GLP1R mediates liraglutide’s anorectic but not glucose-lowering effect. J Clin Invest 2014;124:2456–2463 - PMC - PubMed
    1. Burmeister MA, Ayala J, Drucker DJ, Ayala JE. Central glucagon-like peptide 1 receptor-induced anorexia requires glucose metabolism-mediated suppression of AMPK and is impaired by central fructose. Am J Physiol Endocrinol Metab 2013;304:E677–E685 - PubMed
    1. Schick RR, Zimmermann JP, vorm Walde T, Schusdziarra V. Peptides that regulate food intake: glucagon-like peptide 1-(7-36) amide acts at lateral and medial hypothalamic sites to suppress feeding in rats. Am J Physiol Regul Integr Comp Physiol 2003;284:R1427–R1435 - PubMed

MeSH terms