Association of Protein Distribution and Gene Expression Revealed by PET and Post-Mortem Quantification in the Serotonergic System of the Human Brain
- PMID: 27909009
- PMCID: PMC5939202
- DOI: 10.1093/cercor/bhw355
Association of Protein Distribution and Gene Expression Revealed by PET and Post-Mortem Quantification in the Serotonergic System of the Human Brain
Abstract
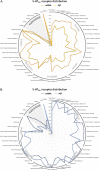
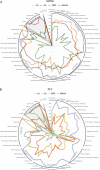
Regional differences in posttranscriptional mechanisms may influence in vivo protein densities. The association of positron emission tomography (PET) imaging data from 112 healthy controls and gene expression values from the Allen Human Brain Atlas, based on post-mortem brains, was investigated for key serotonergic proteins. PET binding values and gene expression intensities were correlated for the main inhibitory (5-HT1A) and excitatory (5-HT2A) serotonin receptor, the serotonin transporter (SERT) as well as monoamine oxidase-A (MAO-A), using Spearman's correlation coefficients (rs) in a voxel-wise and region-wise analysis. Correlations indicated a strong linear relationship between gene and protein expression for both the 5-HT1A (voxel-wise rs = 0.71; region-wise rs = 0.93) and the 5-HT2A receptor (rs = 0.66; 0.75), but only a weak association for MAO-A (rs = 0.26; 0.66) and no clear correlation for SERT (rs = 0.17; 0.29). Additionally, region-wise correlations were performed using mRNA expression from the HBT, yielding comparable results (5-HT1Ars = 0.82; 5-HT2Ars = 0.88; MAO-A rs = 0.50; SERT rs = -0.01). The SERT and MAO-A appear to be regulated in a region-specific manner across the whole brain. In contrast, the serotonin-1A and -2A receptors are presumably targeted by common posttranscriptional processes similar in all brain areas suggesting the applicability of mRNA expression as surrogate parameter for density of these proteins.
Keywords: 5-HT1A; 5-HT2A; MAO-A; SERT; mRNA.
© The Author 2016. Published by Oxford University Press.
Figures


Similar articles
-
Interaction between 5-HTTLPR and 5-HT1B genotype status enhances cerebral 5-HT1A receptor binding.Neuroimage. 2015 May 1;111:505-12. doi: 10.1016/j.neuroimage.2015.01.049. Epub 2015 Jan 31. Neuroimage. 2015. PMID: 25652393
-
A High-Resolution In Vivo Atlas of the Human Brain's Serotonin System.J Neurosci. 2017 Jan 4;37(1):120-128. doi: 10.1523/JNEUROSCI.2830-16.2016. J Neurosci. 2017. PMID: 28053035 Free PMC article.
-
Serotonin-related gene expression in female monkeys with individual sensitivity to stress.Neuroscience. 2005;132(1):151-66. doi: 10.1016/j.neuroscience.2004.11.022. Neuroscience. 2005. PMID: 15780474
-
Serotonin and molecular neuroimaging in humans using PET.Amino Acids. 2012 Jun;42(6):2039-57. doi: 10.1007/s00726-011-1078-9. Epub 2011 Sep 24. Amino Acids. 2012. PMID: 21947614 Review.
-
Neuroreceptor imaging in depression.Neurobiol Dis. 2013 Apr;52:49-65. doi: 10.1016/j.nbd.2012.06.001. Epub 2012 Jun 9. Neurobiol Dis. 2013. PMID: 22691454 Review.
Cited by
-
Dynamic Model of Serotonin Presynapse and Its Application to Suicide Attempt in Patients with Bipolar Disorder.Int J Mol Sci. 2025 Apr 25;26(9):4085. doi: 10.3390/ijms26094085. Int J Mol Sci. 2025. PMID: 40362322 Free PMC article.
-
Topologically Guided Prioritization of Candidate Gene Transcripts Coexpressed with the 5-HT1A Receptor by Combining In Vivo PET and Allen Human Brain Atlas Data.Cereb Cortex. 2020 May 18;30(6):3771-3780. doi: 10.1093/cercor/bhz341. Cereb Cortex. 2020. PMID: 31989157 Free PMC article.
-
Effect of MAOA DNA Methylation on Human in Vivo Protein Expression Measured by [11C]harmine Positron Emission Tomography.Int J Neuropsychopharmacol. 2023 Feb 14;26(2):116-124. doi: 10.1093/ijnp/pyac085. Int J Neuropsychopharmacol. 2023. PMID: 36573644 Free PMC article.
-
Nonmotor and Dopamine Transporter Change in REM Sleep Behavior Disorder by Olfactory Impairment.J Mov Disord. 2019 May;12(2):103-112. doi: 10.14802/jmd.18061. Epub 2019 May 30. J Mov Disord. 2019. PMID: 31158943 Free PMC article.
-
MAOA-VNTR genotype affects structural and functional connectivity in distributed brain networks.Hum Brain Mapp. 2019 Dec 15;40(18):5202-5212. doi: 10.1002/hbm.24766. Epub 2019 Aug 23. Hum Brain Mapp. 2019. PMID: 31441562 Free PMC article.
References
-
- Ahmed BA, Jeffus BC, Bukhari SI, Harney JT, Unal R, Lupashin VV, van der Sluijs P, Kilic F. 2008. Serotonin transamidates Rab4 and facilitates its binding to the C terminus of serotonin transporter. J Biol Chem. 283:9388–9398. - PubMed
-
- Akimova E, Lanzenberger R, Kasper S. 2009. The serotonin-1A receptor in anxiety disorders. Biol Psychiatry. 66:627–635. - PubMed
-
- Amargos-Bosch M. 2004. Co-expression and in vivo interaction of serotonin1A and serotonin2A receptors in pyramidal neurons of prefrontal cortex. Cereb Cortex. 14:281–299. - PubMed
-
- Austin MC, Bradley CC, Mann JJ, Blakely RD. 1994. Expression of serotonin transporter messenger RNA in the human brain. J Neurochem. 62:2362–2367. - PubMed
-
- Baldinger P, Kranz GS, Haeusler D, Savli M, Spies M, Philippe C, Hahn A, Hoflich A, Wadsak W, Mitterhauser M, et al. . 2014. Regional differences in SERT occupancy after acute and prolonged SSRI intake investigated by brain PET. NeuroImage. 88:252–262. - PubMed
Publication types
MeSH terms
Substances
LinkOut - more resources
Full Text Sources
Other Literature Sources

