

An atlas of human kinase regulation
- PMID: 27909043
- PMCID: PMC5199121
- DOI: 10.15252/msb.20167295
An atlas of human kinase regulation
Abstract
The coordinated regulation of protein kinases is a rapid mechanism that integrates diverse cues and swiftly determines appropriate cellular responses. However, our understanding of cellular decision-making has been limited by the small number of simultaneously monitored phospho-regulatory events. Here, we have estimated changes in activity in 215 human kinases in 399 conditions derived from a large compilation of phosphopeptide quantifications. This atlas identifies commonly regulated kinases as those that are central in the signaling network and defines the logic relationships between kinase pairs. Co-regulation along the conditions predicts kinase-complex and kinase-substrate associations. Additionally, the kinase regulation profile acts as a molecular fingerprint to identify related and opposing signaling states. Using this atlas, we identified essential mediators of stem cell differentiation, modulators of Salmonella infection, and new targets of AKT1. This provides a global view of human phosphorylation-based signaling and the necessary context to better understand kinase-driven decision-making.
Keywords: cell fate; human; kinase activity; phosphoproteomics; signaling.
© 2016 The Authors. Published under the terms of the CC BY 4.0 license.
Figures
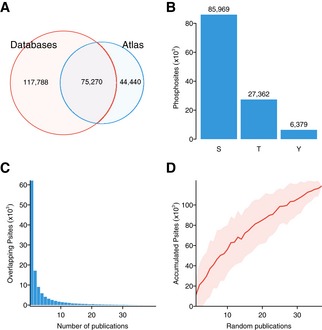
Venn diagram including the total number of phosphorylated residues for which quantifications were collected and the number of sites contained in the curated phosphosite databases: PhosphoSitePlus, HPRD, and Phospho.ELM (August 2014).
Total number of quantified serines (S), threonines (T), and tyrosines (Y).
Distribution of sites reported by multiple parallel publications.
Accumulation of sites as publications are randomly aggregated (100 permutations). Red line shows mean and the shadowed area mean ± 1 standard deviation.
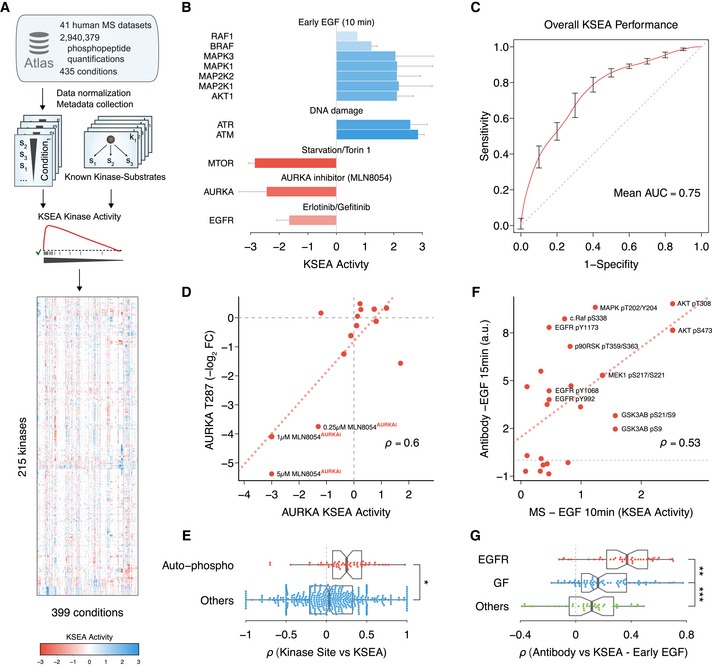
Schematic of the data compilation effort and kinase activity prediction using Kinase Set Enrichment Analysis (KSEA).
Expected kinase response after activation or inhibition. When available (n ≥ 2), error bars represent standard deviation over the mean KSEA activity.
Receiver operating characteristic (ROC) representing the discriminative power of the KSEA activity to separate a set of 132 kinase–condition pairs expected to display regulation. As negatives, 1,000 random sets were generated containing the same number of kinase–condition pairs from the same set of kinases and conditions. Curve displays average ROC curve and bars standard deviation. AUC, area under the ROC curve.
Regression analysis between Aurora kinase A (AURKA) regulatory site T287 and AURKA KSEA activity across all quantified conditions. Labeled conditions correspond to different concentrations of the AURKA inhibitor MLN8054 under mitosis.
Comparison between Spearman correlation coefficients obtained between KSEA‐inferred kinase activities, quantifications of regulatory sites susceptible of auto‐phosphorylation (n = 56), or other regulatory sites in kinases (n = 395). The boxes represent the 1st, 2nd (median) and 3rd quartiles and the whiskers indicate 1.5 times the interquartile range (IQR). Two‐sided Student's t‐test *P = 1.7 × 10⁻⁴.
Linear regression between KSEA activities 10 min after EGF stimulation and activities measured with RPPA targeting regulatory phosphorylations 15 min after adding EGF.
Spearman correlation coefficients between the profile of 24 kinase activities estimated with KSEA 10 min after EGF stimulation (n = 40) and the activities of the same kinases measured with RPPA after stimulating the cell with different ligands. EGFR ligands, EGF or NRG1; other growth factors (GF), HGF, IGF, insulin, or FGF (n = 70); or control conditions, serum or PBS (n = 40). The boxes represent the 1st, 2nd (median) and 3rd quartiles and the whiskers indicate 1.5 times the IQR. Two‐sided Student's t‐test **P = 0.005. ***P = 0.004.
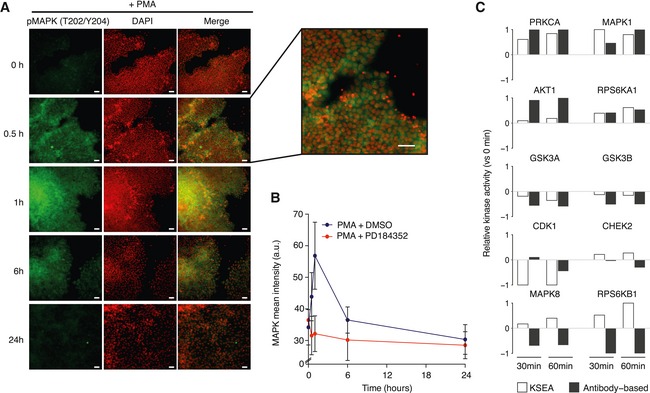
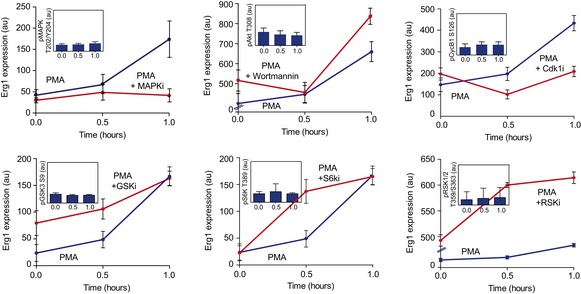
Representative images of differentiation marker MAPK (pT202/Y204) expression in hESCs stimulated with PMA. Scale bars: 30 μm.
Time course quantification of MAPK activation levels after PMA stimulation in the presence or absence of MAPK inhibitor (PD184352). Bars represent mean ± SD (n > 1,000).
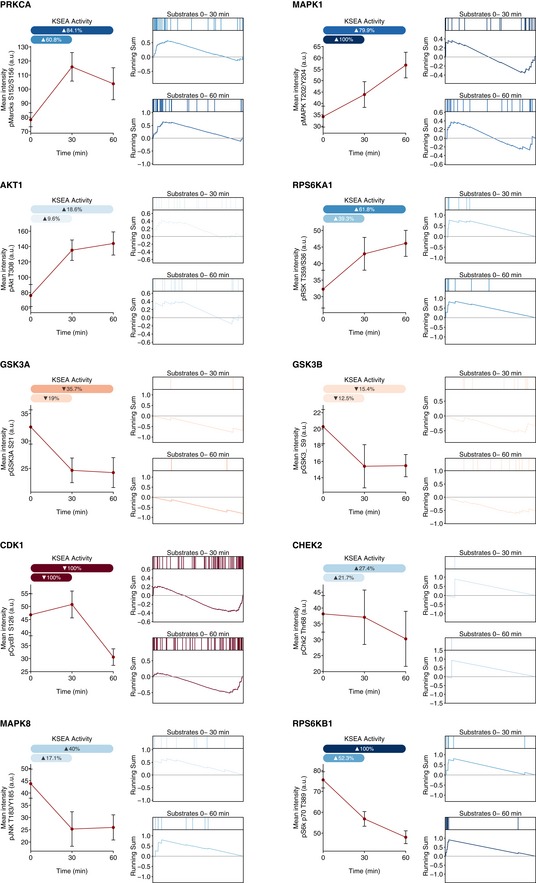
Relative changes in kinase activities using Kinase Set Enrichment Analysis (KSEA) benchmarked against antibody‐measured reporter phosphosites in the intervals 0–30 and 0–60 min.
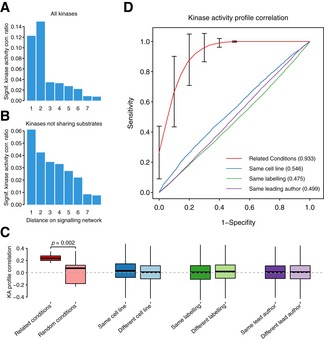
Fraction of significant correlations (FDR < 0.05) when comparing the activities across conditions for kinases at different distances in the signaling network. The network contains all kinase–substrate interactions from PhosphoSitePlus, HPRD, and Phospho.ELM.
Same as (A) but excluding kinase pairs sharing substrate residues.
Differences in correlations of kinase activity (KA) profiles grouped by biological or technical origin. The activity profiles for the 215 kinases are correlated by sample. The correlations between pairs of conditions assayed in different studies are grouped based on biological or technical criteria. Related conditions published in independent studies present significantly different correlations (Student's t‐test, P = 0.002), than the same number of random pairs of conditions also published in different studies. The boxes represent the 1st, 2nd (median) and 3rd quartiles and the whiskers indicate 1.5 times the IQR.
ROC curves denoting the predictive power of the same kinase activity profile correlations to discriminate between related conditions in different studies from random pairs of conditions (mean AUC = 0.933), Error bars display SD; n = 100 iterations, pairs of conditions assayed using the same cell line against different cell line (AUC = 0.546), same labeling methods versus different technique (AUC = 0.475), or samples coming from different publications with the same leading author against different leading authors (AUC = 0.499).
- A
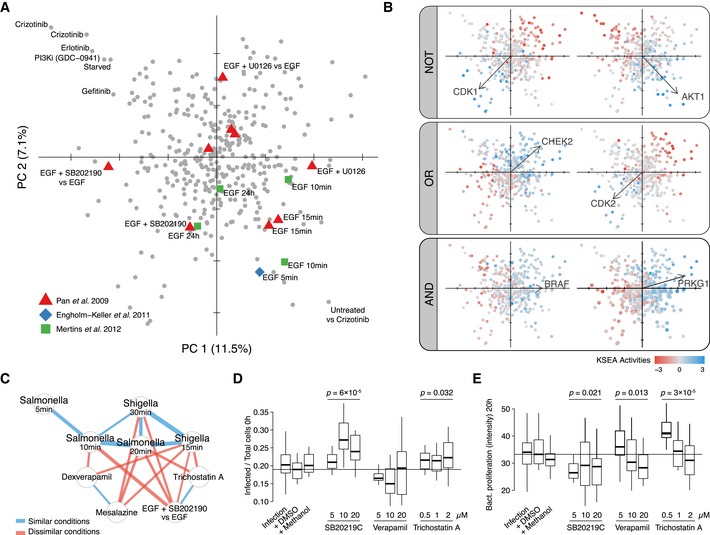
Perturbation scores on the first two PCA components based on KSEA activity profiles of 52 well‐characterized kinases. Symbols represent EGF‐related perturbations in different studies.
- B
Boolean logic relationships between kinase responses. Samples in two first components are colored by different KSEA activities. Vectors display kinase loadings.
- C
Network displays significantly correlated or anti‐correlated conditions in the context of early responses after bacterial infection. The strength of the correlations (blue) and anti‐correlations (red) is displayed as the edge width.
- D, E
Infection rate at 0 h (D) and bacterial proliferation after 20 h (E) when adding different concentrations of compounds displaying anti‐correlated KSEA activity profiles with early responses after bacterial infection (4 biological replicates). Displayed significant ANOVA P‐values evaluate differences between three drug concentrations and the DMSO control. The horizontal lines represent the median baseline value for the Infection + DMSO control.
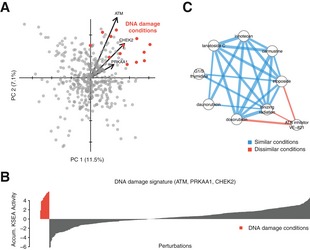
All conditions displayed on the PCA first two components. Perturbations potentially producing DNA damage are highlighted in red. Vectors report the loadings of three relevant kinases.
Accumulated KSEA activity of the DNA damage biomarkers ATM, PRKAA1, CHEK2 across 399 perturbations.
Network displays significantly correlated conditions. Blue edges report significant correlation between conditions involving damaging conditions. Red edges report significant anti‐correlations with ATR inhibition, a kinase involved in the DNA damage response. Edge width represents the strength of the correlation.
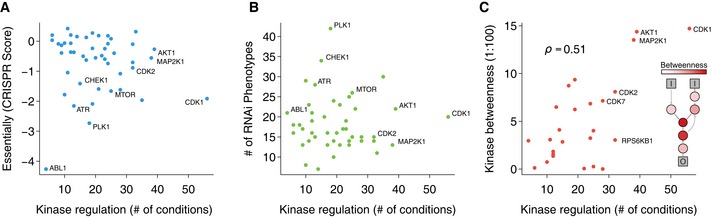
Genetic relevance of generalist and specialist kinases. Number of conditions where the kinase is regulated (absolute estimated kinase activity > 1.75) for each kinase with more than 10 known substrates against the depletion score from CRISPR essentiality screen (Wang et al, 2015). A lower depletion score is indicative of kinases that cause severe fitness defects when knocked‐out.
Same number of conditions in which a kinase is regulated against the number of phenotypes shown by the knocked‐down kinase (from a compilation of RNAi screens
www.genomernai.org ).Same number of conditions in which a kinase is regulated against kinase centrality (betweenness) in signaling network. In the inner panel, a diagram illustrates the relationship between betweenness and the signaling network connectivity. Generalist kinases with more than 10 known substrates tend to have also high betweenness scores (Spearman's ρ = 0.506, P = 9.8 × 10⁻³). Kinases without shortest paths going through them were excluded.
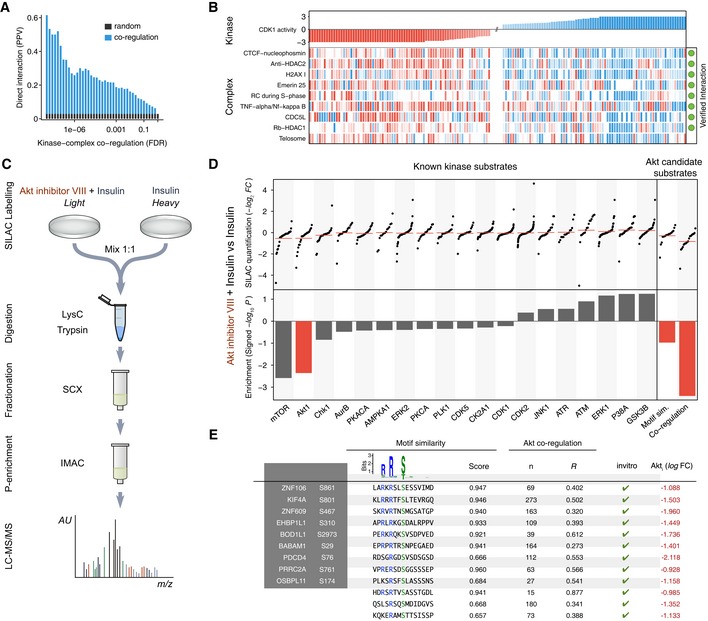
Systematic evaluation of the kinase–complex associations based on the known direct interactions between kinases and complexes. The positive predictive value (PPV) is displayed against the false discovery rate (FDR). The baseline random expectation (in gray) represents the PPV of a random predictor trying to estimate associations between kinases and complexes.
Protein complexes showing correlated phospho‐regulation with the activity of CDK1. The complexes marked in green contain at least one substrate of CDK1. Only the top correlated complexes are shown for the sake of clarity. Missing activities are displayed in white.
Experimental workflow to study phosphoproteome dynamics under AKT (AKT1) inhibition in insulin‐stimulated HeLa cells.
Quantification of known kinase substrates after AKT inhibition of insulin‐stimulated cells for all kinases with at least 14 known sites (top left) and their respective KSEA enrichment after 10,000 permutations (bottom left). Regulation under AKT inhibition of the top 24 unknown sites (number of quantified AKT known substrates) ranked based on their motif similarity, co‐regulation with the known substrates or the combination of both (top right) and their corresponding enrichment on regulated sites after inhibition (bottom right).
List of high‐confidence AKT substrates fulfilling the following criteria: down‐regulation on AKT inhibition log2 L/H < −0.9, positive co‐regulation P < 0.01, motif similarity log‐weights > 0.8, mss > 0.6, and all sites reported as in vitro substrates of AKT (Imamura et al, 2014).
References
-
- Bendall S, Simonds E, Qiu P, Amir E‐A, Krutzik P, Finck R, Bruggner R, Melamed R, Trejo A, Ornatsky O, Balderas R, Plevritis S, Sachs K, Pe'er D, Tanner S, Nolan G (2011) Single‐cell mass cytometry of differential immune and drug responses across a human hematopoietic continuum. Science 332: 687–696 - PMC - PubMed
-
- Berwick D, Hers I, Heesom K, Moule S, Tavare J (2002) The identification of ATP‐citrate lyase as a protein kinase B (Akt) substrate in primary adipocytes. J Biol Chem 277, 33895–33900 - PubMed
MeSH terms
Substances
Grants and funding
LinkOut - more resources
Full Text Sources
Other Literature Sources
Miscellaneous
