. 2017 Mar;102(3):573-583.
doi: 10.3324/haematol.2016.156455. Epub 2016 Dec 1.

The small FOXP1 isoform predominantly expressed in activated B cell-like diffuse large B-cell lymphoma and full-length FOXP1 exert similar oncogenic and transcriptional activity in human B cells

Affiliations

The small FOXP1 isoform predominantly expressed in activated B cell-like diffuse large B-cell lymphoma and full-length FOXP1 exert similar oncogenic and transcriptional activity in human B cells

Martine van Keimpema et al. Haematologica. 2017 Mar.

Abstract

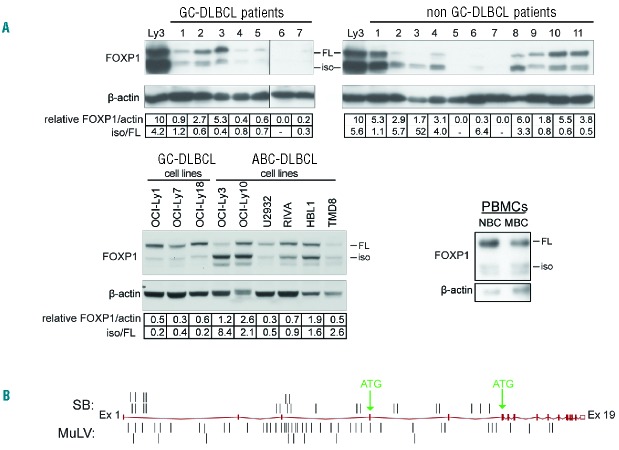
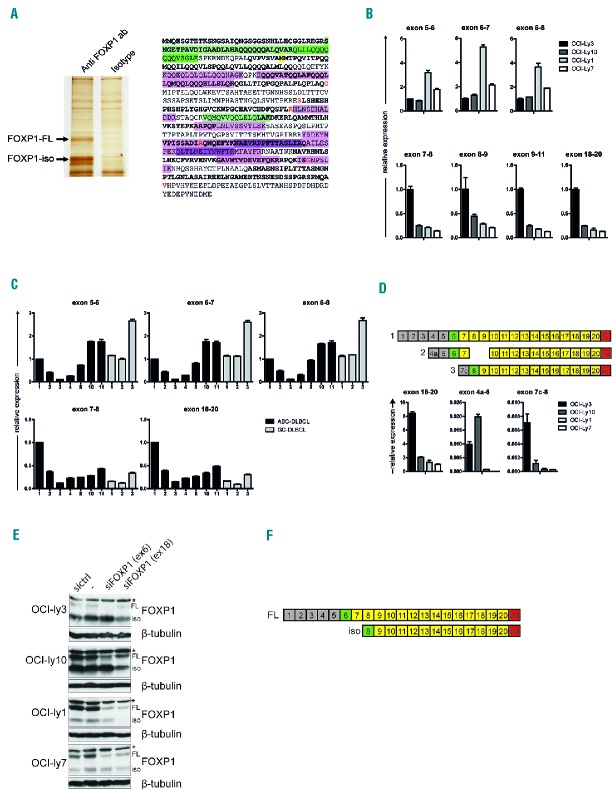
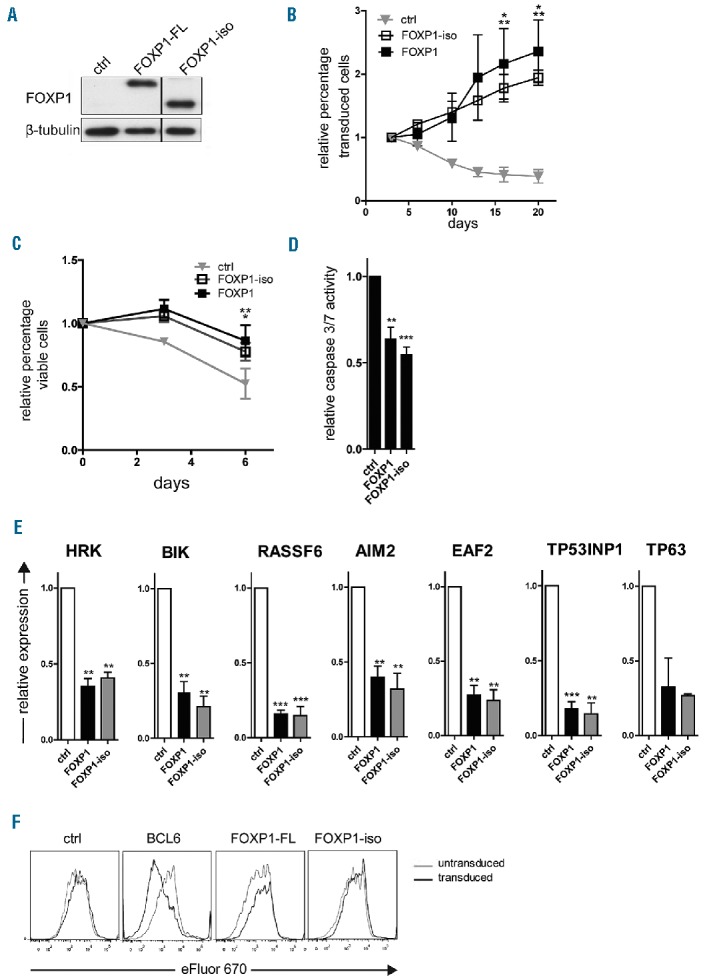
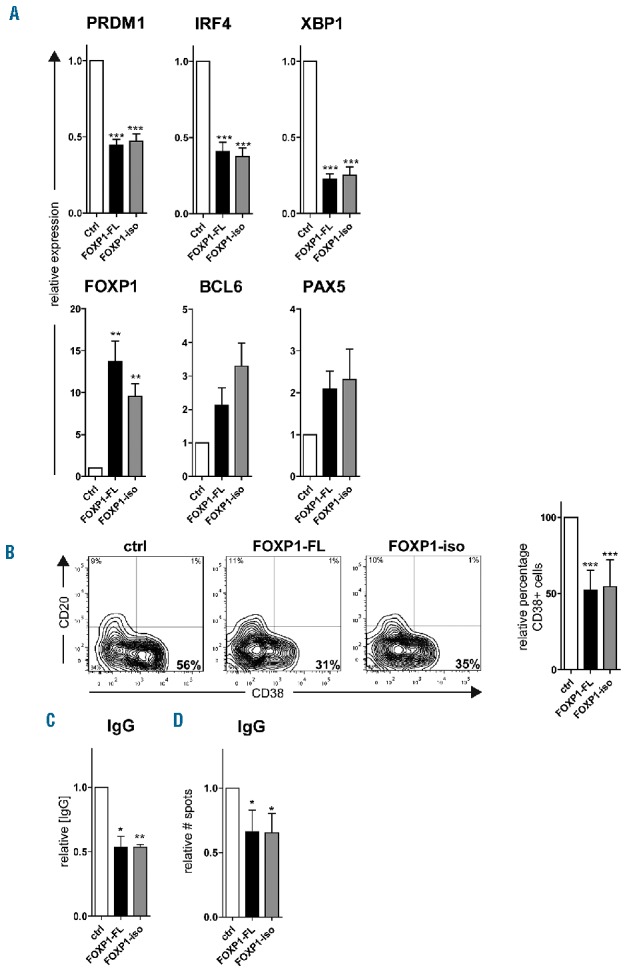
The forkhead transcription factor FOXP1 is generally regarded as an oncogene in activated B cell-like diffuse large B-cell lymphoma. Previous studies have suggested that a small isoform of FOXP1 rather than full-length FOXP1, may possess this oncogenic activity. Corroborating those studies, we herein show that activated B cell-like diffuse large B-cell lymphoma cell lines and primary activated B cell-like diffuse large B-cell lymphoma cells predominantly express a small FOXP1 isoform, and that the 5'-end of the Foxp1 gene is a common insertion site in murine lymphomas in leukemia virus- and transposon-mediated insertional mutagenesis screens. By combined mass spectrometry, (quantative) reverse transcription polymerase chain reaction/sequencing, and small interfering ribonucleic acid-mediated gene silencing, we determined that the small FOXP1 isoform predominantly expressed in activated B cell-like diffuse large B-cell lymphoma lacks the N-terminal 100 amino acids of full-length FOXP1. Aberrant overexpression of this FOXP1 isoform (ΔN100) in primary human B cells revealed its oncogenic capacity; it repressed apoptosis and plasma cell differentiation. However, no difference in potency was found between this small FOXP1 isoform and full-length FOXP1. Furthermore, overexpression of full-length FOXP1 or this small FOXP1 isoform in primary B cells and diffuse large B-cell lymphoma cell lines resulted in similar gene regulation. Taken together, our data indicate that this small FOXP1 isoform and full-length FOXP1 have comparable oncogenic and transcriptional activity in human B cells, suggesting that aberrant expression or overexpression of FOXP1, irrespective of the specific isoform, contributes to lymphomagenesis. These novel insights further enhance the value of FOXP1 for the diagnostics, prognostics, and treatment of diffuse large B-cell lymphoma patients.


Figures

Figure 1.
Figure 1.
A small FOXP1 isoform is highly expressed in ABC-DLBCL patients, and the 5′end of the Foxp1 gene is a frequent target of insertional mutagenesis in mouse lymphoma models. (A) Western blot analysis for FOXP1 protein expression in tissue samples of non-GC- and GC-DLBCL patients, DLBCL cell lines (i.e., the ABC-DLBCL cell lines OCI-Ly3, OCI-Ly10, U2932, RIVA, HBL1, and TMD8 and the GC-DLBCL cell lines OCI-Ly-1, OCI-Ly7, and OCI-Ly18), and human peripheral blood B cells. NBC: naïve B cell (CD19+CD27); MBC: memory B cell (CD19+CD27+). Expression of FOXP1 (iso + FL) was relative to β-actin. For comparison, in the blots with DLBCL patient biopsies the FOXP1 levels of OCI-Ly3 were normalized to an arbitrary level of 10 units; please note that shorter exposures were used for accurate quantification of FOXP1 expression in OCI-Ly3. (B) locations of insertions found in the Foxp1 gene in MuLV and sleeping beauty (SB) transposon insertional mutagenesis screens in murine lymphoma models. DLBCL: diffuse large B-cell lymphoma; GC: germinal center; ABC: activated B-cell; iso: isoform; FL: full-length; PBMC: peripheral blood mononuclear cell; MuLV: murine leukemia virus.
Figure 2.
Figure 2.
Identification of the FOXP1-iso transcript and protein. (A) FOXP1 protein was immunoprecipitated from OCI-Ly10 cells and FOXP1-FL and FOXP1-iso proteins were isolated from a silverstained gel (left). The proteins were trypsin-digested and fragments were subsequently analyzed by mass spectrometry. Fragments found in both proteins are indicated in purple, fragments exclusively found in the FOXP1-FL protein are indicated in green. Different color intensities are used to discriminate individual fragments (right). Alternating exons are indicated by regular and bold font. Amino acids overlapping exon boundaries are indicated in red. Methionine-101 is indicated by yellow shading. (B,C) qRT-PCR analysis for the levels of 5′FOXP1 exons in cell lines with high levels of FOXP1-FL (OCI-Ly1 and OCI-Ly7) or of FOXP1-iso (OCI-Ly3 and OCI-Ly10) (B), and in ABC-DLBCL and GC-DLBCL patient biopsies. Numbers correspond to numbers of biopsies in Figure 1A (C). Expression levels were normalized for HPRT expression levels and to expression levels in OCI-Ly3 (B) or in ABC-DLBCL patient 1 (C). (D) qRT-PCR analysis for the levels of mRNA transcripts containing alternative exons 4a and 7c. Upper panel: diagram illustrating the exon structure of alternative spliced isoforms that encode for FOXP1-FL (1), or that have been previously described by Brown et al. to encode for the most prominently expressed isoforms (2,3). Lower panel: qRT-PCR analysis for the levels of expression of transcript 1, 2, and 3 in cell lines with high levels of FOXP1-FL (OCI-ly1 and OCI-ly7) or of FOXP1-iso (OCI-ly3 and OCI-ly10). Please note the difference in y-axis values. (E) DLBCL cell lines were transfected with siRNA against FOXP1 exon 6, siRNA against FOXP1 exon 18, control siRNA, or were treated in the same way without addition of siRNA (−). Two days after nucleofection with siRNA against FOXP1, cell lysates were harvested and immunoblotted for FOXP1. β-tubulin was used as a loading control. *indicates a non-specific background band. (F) Diagram illustrating the exon structure of FOXP1-FL and FOXP1-iso. FL: full-length; iso: isoform; sictrl: si control; siFOXP1: small interfering RNA directed against FOXP1; ab: antibody.
Figure 3.
Figure 3.
FOXP1-iso exerts similar effects on B-cell survival as FOXP1-FL. Memory B cells were sorted from human peripheral blood and transduced with either FOXP1-IRES-YFP, FOXP1-iso-IRES-YFP, BCL6-IRES-GFP (F) or ctrl-IRES-YFP, and cultured with CD40L-L cells, IL-21 and IL-2 (A-D,F) or without CD40L-L cells as of day 3 after transduction (E). (A) Representative example of FOXP1 and FOXP1-iso overexpression in primary YFP+ B cells. 6 days after transduction YFP+ cells were sorted and analyzed by immunoblotting. β-tubulin was used as loading control. (B) FOXP1-IRES-YFP, FOXP1-iso-IRES-YFP, and ctrl-IRES-YFP transduced B cells were continuously cultured with IL-21 and IL-2 and CD40L-L cells. The percentage of transduced cells in each culture was followed over time by FACS analysis and normalized to the percentage of transduced cells at day 3 after transduction. Mean ± SD of three independent experiments are shown. Significant differences were observed at day 15 and 20 after transduction between FOXP1 transduced cells vs. ctrl transduced cells (*P<0.05) and between FOXP1-iso transduced and control transduced cells (**P<0.01). (C) A total of 6–7 days after transduction, live YFP positive and negative fractions of FOXP1 and control vector single transduced cultures were sorted. After a recovery period of 4–5 days, the percentage of cells in the FSC/SCC live gate was determined by flow cytometry at three consecutive time points. The data were normalized to the percentage of living cells measured at the first time point. Mean ± SEM of three independent experiments are shown. Significant differences were observed at day 6 after transduction between FOXP1 transduced cells vs. ctrl transduced cells (**P<0.01) and between FOXP1-iso transduced and control transduced cells (*P<0.05). (D) Six days after transduction, the YFP positive fractions of FOXP1-FL, FOXP1-iso, and control vector-transduced cultures were sorted. After a recovery period of 5–7 days, caspase 3/7 activity was determined by the caspase glo3/7 assay. Values were corrected for the number of living cells as determined by FACS analysis. Mean ± SD of five independent experiments are shown (t-test **P<0.01, *** P<0.001). (E) Six days after transduction YFP positive cells were sorted. Gene expression levels of FOXP1 repressed pro-apoptotic genes were analyzed by quantitative RT-PCR. Expression levels were normalized to expression levels in control transduced cells. Mean ± SEM of at least three independent experiments (except for TP63) are shown (one sample t-test, **P<0.01, ***P<0.001). (F) 7 days after transduction, cells were labeled with eFluor 670 and cultured for four days, after which the eFluor 670 intensity was determined by flow cytometry. Representative graphs of two independent experiments are shown. FL: full-length; iso: isoform; ctrl: control.
Figure 4.
Figure 4.
FOXP1-iso exerts similar effects on plasma cell differentiation as FOXP1-FL. CD19+CD27+ MBCs were sorted from human peripheral blood and transduced with FOXP1-FL-IRES-YFP, FOXP1-iso-IRES-YFP, or control empty vector and cultured under conditions that promote PC differentiation. Six days after transduction YFP positive cells were sorted (A,C,D). (A) Gene expression levels of PRDM1, IRF4, XBP1, FOXP1, BCL6 and PAX5 were analyzed in sorted cells by qRT-PCR. Expression levels in FOXP1-FL and FOXP1-iso- and control-transduced cells were normalized to β-actin and then to expression levels in control transduced cells. Mean ± SEM of five independent experiments are shown. (**P<0.01; ***P<0.001). (B) Six days after transduction, YFP positive cells were analyzed for CD20 and CD38 surface expression by flow cytometry. Representative dot plots of one out of 10 independent experiments are shown (left panel). Percentages of CD38+ cells in FOXP1-FL and FOXP1-iso-transduced cultures were normalized to control cultures. Mean ± SD values of 10 independent experiments are shown (right panel) (one sample t-test, ***P<0.001). (C) Equal numbers of sorted cells (50000) were cultured with IL-21 and IL-2 for an additional 24 hours. Thereafter, the supernatants were collected, and IgG protein levels were analyzed by ELISA. Levels were normalized to levels in control transduced cells. Mean ± SD of three independent experiments are shown (one sample t-test, *P<0.05, **P<0.01). (D) Equal numbers of sorted cells were plated onto membranes in serial dilutions and cultured with IL-21 and IL-2 for an additional 18 hours, after which numbers of IgM or IgG secreting cells were determined by ELISPOT. Spot numbers were normalized to numbers in stimulated, control transduced cells. Mean ± SD of four independent experiments are shown. (one sample t-test, *P<0.01). FL: full-length; iso: isoform; IgG: immunoglobulin G; ctrl: control.
Figure 5.
Figure 5.
FOXP1-iso and FOXP1-FL regulate the same genes in DLBCL cell lines. DLBCL cell lines were retrovirally transduced with FOXP1-FL-IRES-YFP, FOXP1-iso-IRES-YFP, or control-IRES-YFP, and YFP positive cells were sorted. Gene expression microarray analysis was performed on these samples. All genes of which the expression was changed by either FOXP1-FL or FOXP1-iso overexpression by at least 1.5-fold in at least two cell lines are shown. Data are represented as z-scores calculated within samples of each cell line. Genes that were identified by ChIP-seq analysis to be bound by FOXP1 within 20kb of their TSS in at least 2 DLBCL cell lines are indicated by an asterisk. The gray squares indicate expression beneath the threshold value (= no expression). FL: full-length; iso: isoform: CTRL: control.

References

    1. Koon HB, Ippolito GC, Banham AH, Tucker PW. FOXP1: a potential therapeutic target in cancer. Expert Opin Ther Targets. 2007;11(7):955–965. - PMC - PubMed
    1. Katoh M, Igarashi M, Fukuda H, Nakagama H, Katoh M. Cancer genetics and genomics of human FOX family genes. Cancer Lett. 2013;328(2):198–206. - PubMed
    1. Zhang Y, Zhang S, Wang X, et al. Prognostic significance of FOXP1 as an oncogene in hepatocellular carcinoma. J Clin Pathol. 2012;65(6):528–533. - PubMed
    1. Rad R, Rad L, Wang W, et al. A conditional piggyBac transposition system for genetic screening in mice identifies oncogenic networks in pancreatic cancer. Nat Genet. 2015;47:47–56. - PubMed
    1. Banham AH, Connors JM, Brown PJ, et al. Expression of the FOXP1 transcription factor is strongly associated with inferior survival in patients with diffuse large B-cell lymphoma. Clin Cancer Res. 2005;11(3): 1065–1072. - PubMed

Publication types

MeSH terms

LinkOut - more resources