

Nutritional quality of lunches consumed by Korean workers: Comparison between institutional and commercial lunches
- PMID: 27909558
- PMCID: PMC5126410
- DOI: 10.4162/nrp.2016.10.6.606
Nutritional quality of lunches consumed by Korean workers: Comparison between institutional and commercial lunches
Abstract
Background/objectives: The nutritional quality of lunches is an important factor related to workers' health. This study examined the nutritional quality of Korean workers' lunches with a focus on comparing institutional and commercial lunches.
Subjects/methods: The data from a 1-day, 24-hour dietary recall from the 5th Korea National Health and Nutrition Examination Survey (2010-2012) were analyzed. A total of 2,192 subjects aged 19 to 64 years, who had consumed lunches served by institutional or commercial food service vendors, were included for analysis. The nutritional quality of the lunches of the institutional lunch group (n=626) and the commercial lunch group (n=1,566) was compared in terms of the number of servings, food groups, nutrient intake, Nutrient Adequacy Ratio (NAR), and Mean Adequacy Ratio (MAR).
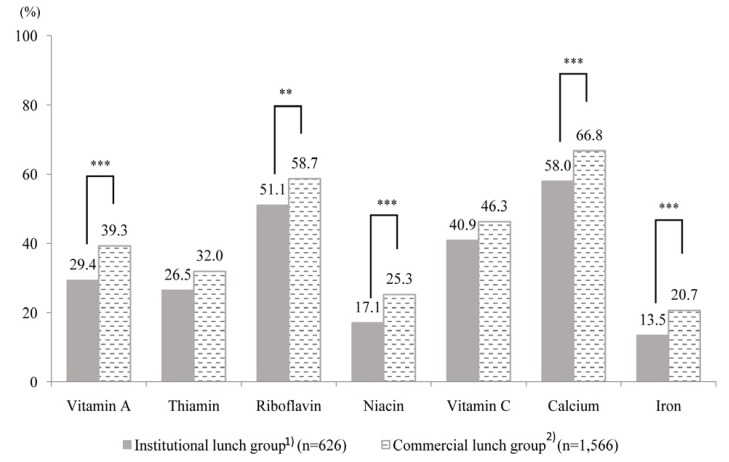
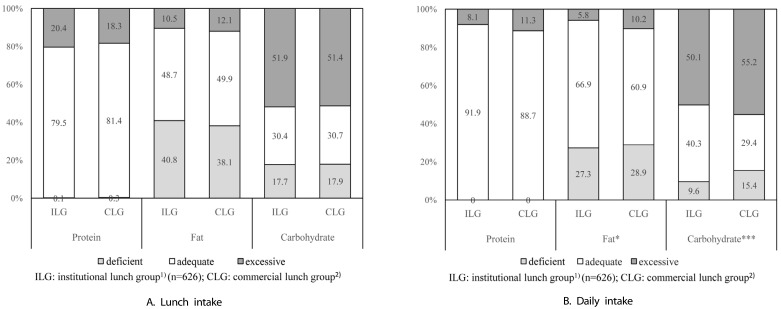
Results: The NAR and MAR were significantly higher in the institutional lunches than in the commercial lunches, but more than half of workers in both groups obtained over 65% of their energy from carbohydrate. The average sodium intake from the lunches exceeded the daily intake goal (2,000 mg) in both groups. More than half of workers in both groups presented less than one-third of their respective recommended daily intake of riboflavin and calcium. With the exception of riboflavin, the nutrient intake from lunches accounted for more than 35% of the daily nutrient intake.
Conclusions: The overall nutritional quality of institutional lunches was higher than that of commercial lunches. However, institutional lunches had room for improvement in terms of nutritional quality.
Keywords: Nutrition surveys; food services; lunch; workers; workplace.
Conflict of interest statement
The authors declare no potential conflicts of interests.
Figures
Similar articles
-
Dietary quality of lunches in senior leisure service facilities in South Korea: analysis of data from the 2013-2017 Korea National Health and Nutrition Examination Survey.Nutr Res Pract. 2021 Apr;15(2):266-277. doi: 10.4162/nrp.2021.15.2.266. Epub 2020 Aug 28. Nutr Res Pract. 2021. PMID: 33841729 Free PMC article.
-
A Vote for School Lunches: School Lunches Provide Superior Nutrient Quality than Lunches Obtained from Other Sources in a Nationally Representative Sample of US Children.Nutrients. 2017 Aug 24;9(9):924. doi: 10.3390/nu9090924. Nutrients. 2017. PMID: 28837090 Free PMC article.
-
Nutrient intakes and food patterns of toddlers' lunches and snacks: influence of location.J Am Diet Assoc. 2006 Jan;106(1 Suppl 1):S124-34. doi: 10.1016/j.jada.2005.09.036. J Am Diet Assoc. 2006. PMID: 16376636
-
A comparison of British school meals and packed lunches from 1990 to 2007: meta-analysis by lunch type.Br J Nutr. 2010 Aug;104(4):474-87. doi: 10.1017/S0007114510001601. Epub 2010 May 26. Br J Nutr. 2010. PMID: 20500928 Review.
-
A Historical Review of Changes in Nutrition Standards of USDA Child Meal Programs Relative to Research Findings on the Nutritional Adequacy of Program Meals and the Diet and Nutritional Health of Participants: Implications for Future Research and the Summer Food Service Program.Nutrients. 2015 Dec 4;7(12):10145-67. doi: 10.3390/nu7125523. Nutrients. 2015. PMID: 26690207 Free PMC article. Review.
Cited by
-
Sodium intake trend and current intake level by meal provision place among the citizens of Seoul.Nutr Res Pract. 2023 Jun;17(3):516-528. doi: 10.4162/nrp.2023.17.3.516. Epub 2023 Jan 5. Nutr Res Pract. 2023. PMID: 37266124 Free PMC article.
-
The Nutritional Quality of Lunch Meals Eaten at Danish Worksites.Nutrients. 2018 Oct 16;10(10):1518. doi: 10.3390/nu10101518. Nutrients. 2018. PMID: 30332823 Free PMC article.
-
Workplace foodservice meals are associated with higher nutritional quality among adult Korean workers: a nationwide cross-sectional study.Nutr Res Pract. 2022 Apr;16(2):248-259. doi: 10.4162/nrp.2022.16.2.248. Epub 2021 Aug 12. Nutr Res Pract. 2022. PMID: 35392525 Free PMC article.
References
-
- Statistics Korea. Deaths and death rates by cause [Internet] Daejeon: Statistics Korea; 2015. [cited 2016 March 18]. Available from: http://kosis.kr/ups/ups_01List.jsp.
-
- Ministry of Health and Welfare, Korea Centers for Disease Control and Prevention. Korea Health Statistics 2014: Korea National Health and Nutrition Examination Survey (KNHANES VI-2) Sejong: Korea: Centers for Disease Control and Prevention; 2015.
-
- Statistics Korea. Annual report of employment: 2014 [Internet] Daejeon: Statistics Korea; 2015. [cited 2016 March 18]. Available from: http://kosis.kr/ups/ups_01List.jsp.
-
- Kim YS. The necessity and significance of reducing working hours [Internet] Seoul: Lavour and Society Institute; 2016. [cited 2016 April 16]. Available from: http://klsi.org/content/8436.
-
- Jang MR, Hong WS. Nutrition service need assessment for industrial employees. J Korean Diet Assoc. 2000;6:26–32.
LinkOut - more resources
Full Text Sources
Other Literature Sources
