

PBPK modeling and simulation in drug research and development
- PMID: 27909650
- PMCID: PMC5125732
- DOI: 10.1016/j.apsb.2016.04.004
PBPK modeling and simulation in drug research and development
Abstract
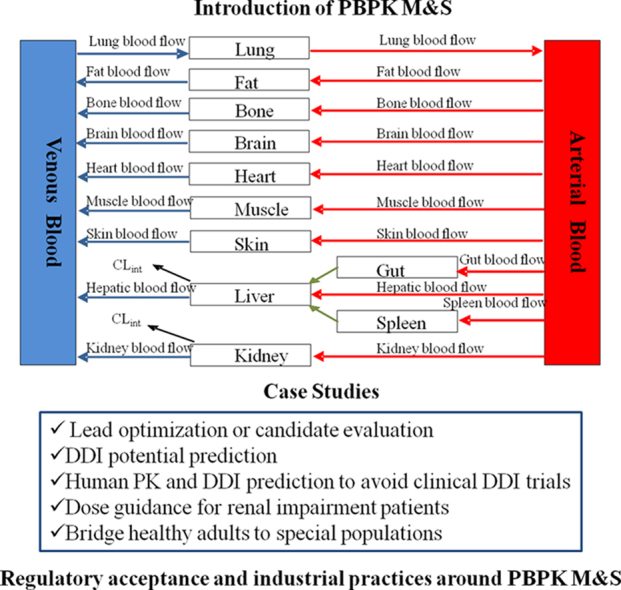
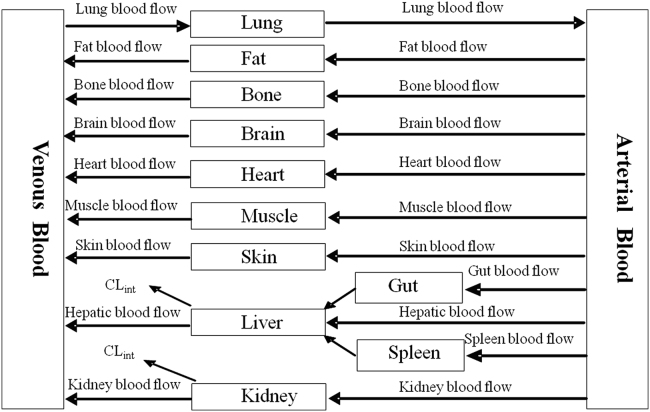
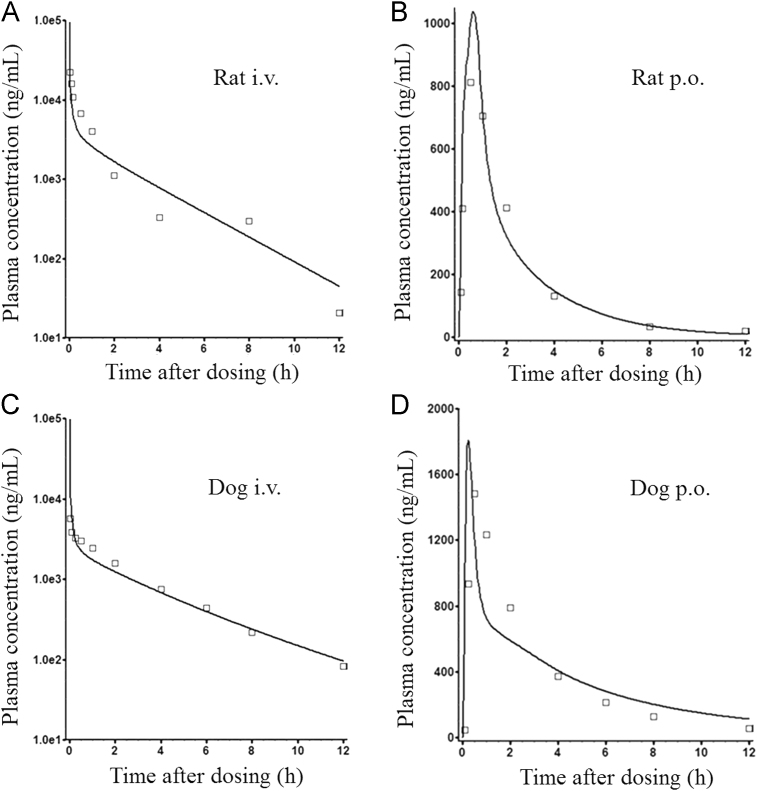
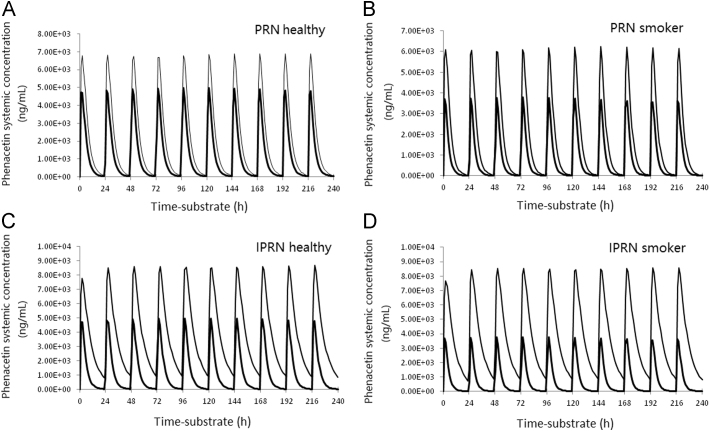
Physiologically based pharmacokinetic (PBPK) modeling and simulation can be used to predict the pharmacokinetic behavior of drugs in humans using preclinical data. It can also explore the effects of various physiologic parameters such as age, ethnicity, or disease status on human pharmacokinetics, as well as guide dose and dose regiment selection and aid drug-drug interaction risk assessment. PBPK modeling has developed rapidly in the last decade within both the field of academia and the pharmaceutical industry, and has become an integral tool in drug discovery and development. In this mini-review, the concept and methodology of PBPK modeling are briefly introduced. Several case studies were discussed on how PBPK modeling and simulation can be utilized through various stages of drug discovery and development. These case studies are from our own work and the literature for better understanding of the absorption, distribution, metabolism and excretion (ADME) of a drug candidate, and the applications to increase efficiency, reduce the need for animal studies, and perhaps to replace clinical trials. The regulatory acceptance and industrial practices around PBPK modeling and simulation is also discussed.
Keywords: Absorption; Drug–drug interaction; Metabolism; PBPK; PK prediction; Special population.
Figures
Similar articles
-
Integration of Engineered Delivery with the Pharmacokinetics of Medical Candidates via Physiology-Based Pharmacokinetics.Methods Mol Biol. 2022;2486:57-69. doi: 10.1007/978-1-0716-2265-0_4. Methods Mol Biol. 2022. PMID: 35437718
-
Physiologically Based Pharmacokinetic (PBPK) Modeling of Pharmaceutical Nanoparticles.AAPS J. 2017 Jan;19(1):26-42. doi: 10.1208/s12248-016-0010-3. Epub 2016 Nov 10. AAPS J. 2017. PMID: 27834047 Review.
-
Evaluation of the whole body physiologically based pharmacokinetic (WB-PBPK) modeling of drugs.J Theor Biol. 2018 Aug 14;451:1-9. doi: 10.1016/j.jtbi.2018.04.032. Epub 2018 Apr 26. J Theor Biol. 2018. PMID: 29704489
-
Prediction of pharmacokinetics and drug-drug interaction potential using physiologically based pharmacokinetic (PBPK) modeling approach: A case study of caffeine and ciprofloxacin.Korean J Physiol Pharmacol. 2017 Jan;21(1):107-115. doi: 10.4196/kjpp.2017.21.1.107. Epub 2016 Dec 21. Korean J Physiol Pharmacol. 2017. PMID: 28066147 Free PMC article.
-
Physiologically based pharmacokinetic modeling of small molecules: How much progress have we made?Drug Metab Dispos. 2025 Jan;53(1):100013. doi: 10.1124/dmd.123.000960. Epub 2024 Nov 22. Drug Metab Dispos. 2025. PMID: 39884807 Review.
Cited by
-
Application of Physiologically-Based Pharmacokinetic Modeling to Predict Gastric pH-Dependent Drug-Drug Interactions for Weak Base Drugs.CPT Pharmacometrics Syst Pharmacol. 2020 Aug;9(8):456-465. doi: 10.1002/psp4.12541. Epub 2020 Jul 31. CPT Pharmacometrics Syst Pharmacol. 2020. PMID: 32633893 Free PMC article.
-
Prediction of gastric pH-mediated drug exposure using physiologically-based pharmacokinetic modeling: A case study of itraconazole.CPT Pharmacometrics Syst Pharmacol. 2023 Jun;12(6):865-877. doi: 10.1002/psp4.12959. Epub 2023 Mar 26. CPT Pharmacometrics Syst Pharmacol. 2023. PMID: 36967484 Free PMC article.
-
Pharmacokinetics and Scintigraphic Imaging of the Hypoxia-Imaging Agent [123I]IAZA in Healthy Adults Following Exercise-Based Cardiac Stress †.Pharmaceutics. 2018 Feb 22;10(1):25. doi: 10.3390/pharmaceutics10010025. Pharmaceutics. 2018. PMID: 29470434 Free PMC article.
-
Requirements to Establishing Confidence in Physiologically Based Pharmacokinetic (PBPK) Models and Overcoming Some of the Challenges to Meeting Them.Clin Pharmacokinet. 2019 Nov;58(11):1355-1371. doi: 10.1007/s40262-019-00790-0. Clin Pharmacokinet. 2019. PMID: 31236775 Free PMC article.
-
Physiologically-based pharmacokinetic model of vaginally administered dapivirine ring and film formulations.Br J Clin Pharmacol. 2018 Sep;84(9):1950-1969. doi: 10.1111/bcp.13625. Epub 2018 Jun 19. Br J Clin Pharmacol. 2018. PMID: 29714824 Free PMC article.
References
-
- Teorell T. Kinetics of distribution of substances administered to the body. I. The extravascular modes of administration. Arch Int Pharmacodyn Ther. 1937;57:205–225.
-
- Reddy M., Yang R.S.H., Clewell H.J., III, Andersen M.E. Physiologically based pharmacokinetic modeling: science and applications. Wiley; Hoboken, NJ: 2005.
-
- Rowland M., Peck C., Tucker G. Physiologically-based pharmacokinetics in drug development and regulatory science. Annu Rev Pharmacol Toxicol. 2011;51:45–73. - PubMed
-
- Jones H.M., Chen Y., Gibson C., Heimbach T., Parrott N., Peters S.A. Physiologically based pharmacokinetic modeling in drug discovery and development: a pharmaceutical industry perspective. Clin Pharmacol Ther. 2015;97:247–262. - PubMed
-
- Sinha V., Zhao P., Huang S.M., Zineh I. Physiologically based pharmacokinetic modeling: from regulatory science to regulatory policy. Clin Pharmacol Ther. 2014;95:478–480. - PubMed
Publication types
LinkOut - more resources
Full Text Sources
Other Literature Sources
