. 2017 Jan 7;9(1):288-297.
doi: 10.1039/c6nr07353k. Epub 2016 Dec 2.

Effect of partial PEGylation on particle uptake by macrophages

Affiliations

Effect of partial PEGylation on particle uptake by macrophages

Lucero Sanchez et al. Nanoscale. .

Abstract

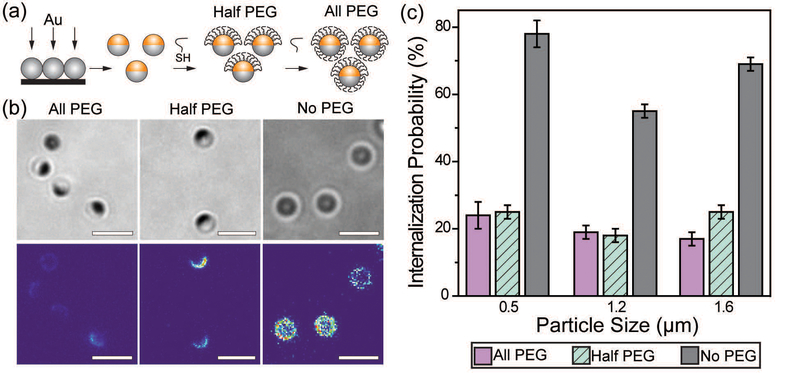
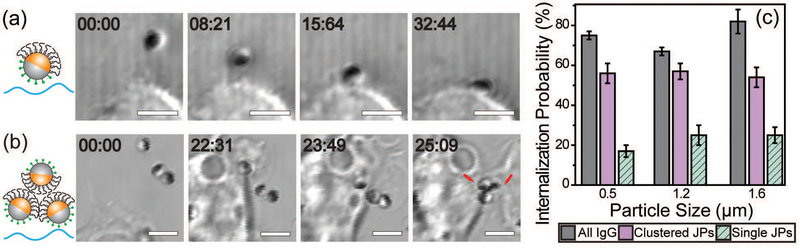
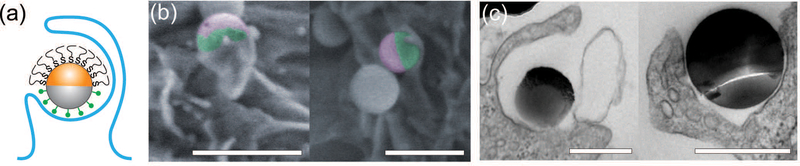
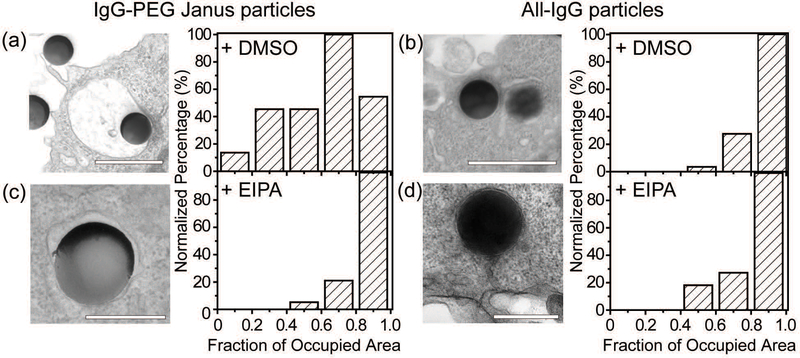
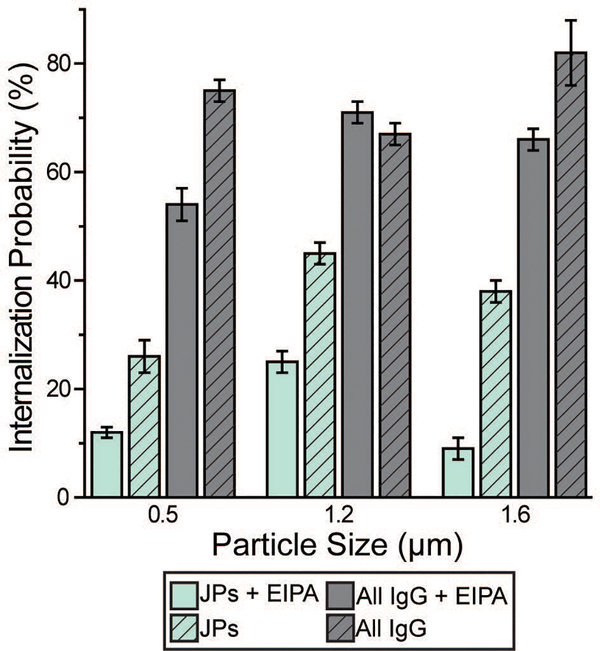
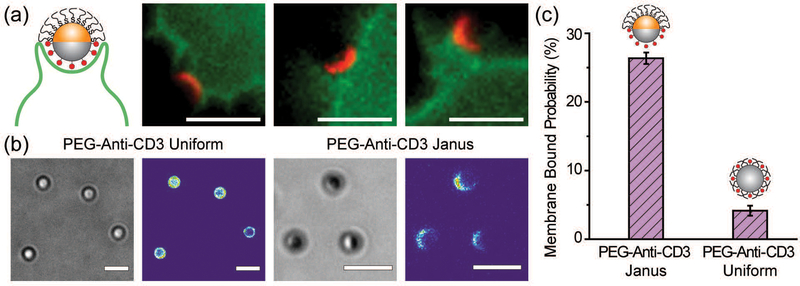
Controlling the internalization of synthetic particles by immune cells remains a grand challenge for developing successful drug carrier systems. Polyethylene glycol (PEG) is frequently used as a protective coating on particles to evade immune clearance, but it also hinders the interactions of particles with their intended target cells. In this study, we investigate a spatial decoupling strategy, in which PEGs are coated on only one hemisphere of particles, so that the other hemisphere is available for functionalization of cell-targeting ligands without the hindrance effect from the PEGs. The partial coating of PEGs is realized by creating two-faced Janus particles with different surface chemistries on opposite sides. We show that a half-coating of PEGs reduces the macrophage uptake of particles as effectively as a complete coating. Owing to the surface asymmetry, Janus particles that are internalized enter macrophage cells via a combination of ligand-guided phagocytosis and macropinocytosis. By spatially segregating PEGs and ligands for targeting T cells on Janus particles, we demonstrate that the Janus particles bind T cells uni-directionally from the ligand-coated side, bypassing the hindrance from the PEGs on the other hemisphere. The results reveal a new mechanistic understanding on how a spatial coating of PEGs on particles changes the phagocytosis of particles. This study also suggests a new design principle for therapeutic particles - the spatial decoupling of PEGs and cell-targeting moieties reduces the interference between the two functions while attaining the protective effect of PEGs for macrophage evasion.


Figures

Fig. 1
Fig. 1
(a) Schematic illustration of the Janus particle fabrication procedure. (b) Bright-field and fluorescence images showing three types of Janus particles as indicated, and the non-specifically adsorbed IgG-Alexa488 (fluorescent). The fluorescence intensity of IgG is shown on the same color scale in all three images to highlight the difference in intensity. All particles are 1.6 μm in diameter. (c) Internalization probability of IgG-opsonized particles by RAW 264.7 macrophage cells. The 500 nm and 1.2 μm all-PEG and half-PEG Janus particles were statistically similar at the p < 0.05 level. The internalization of 1.6 μm all-PEG and half-PEG Janus particles were statistically different at the p < 0.05 level. Results for each type of particle were from 25–48 images in 2–6 independent samples. Scale bars: 3 μm.
Fig. 2
Fig. 2
Dynamics of cell-binding and internalization of single IgG–PEG Janus particles as well as clusters of IgG–PEG Janus particles. Bright-field images showing the rotation of a 1.6 μm IgG–PEG Janus particle during cell binding (a) and the clustering of 1.2 μm IgG–PEG Janus particles (b) during the binding and internalization process. The PEGylated hemisphere of Janus particles appears dark in all images due to the gold coating. (c) A graph showing the internalization efficiency of single and clustered Janus particles in comparison to all-IgG control particles. Internalization probability was determined from live cell images of 10–18 videos from 2–6 independent samples. Scale bars: 3 μm.
Fig. 3
Fig. 3
Asymmetric membrane protrusion around IgG–PEG Janus particles. A schematic illustration (a), pseudo-colored SEM images (b), and TEM images (c) demonstrate the different membrane morphology on the two hemispheres of IgG–PEG Janus particles. In the pseudo-colored SEM images, the PEGylated hemispheres are shown in purple and the IgG-coated hemispheres are shown in green. Scale bars: 1 μm in SEM images (b) and 500 nm in TEM images (c).
Fig. 4
Fig. 4
Quantification of tightness of phagosomes. (a) and (c) are for 500 nm IgG–PEG Janus particles in DMSO-treated (a) and EIPA-treated macrophages (c). (b) and (d) are for 500 nm all-IgG control particles in DMSO-treated (b) and EIPA-treated macrophages (d). All bar graphs show the distribution of phagosome areas occupied by single particles. The fraction of occupied area is 0.60 ± 0.03 (average ± SEM) for (a), 0.84 ± 0.02 for (b), 0.87 ± 0.02 for (c) and 0.80 ± 0.03 for (d). A total of N = 57 particles were analyzed for (a), N = 38 for (b), N = 24 for (c) and N = 16 for (d). Scale bars: 1 μm in (a) and (b), and 500 nm in (c) and (d).
Fig. 5
Fig. 5
Macrophage internalization probability of particles following 10 μM EIPA treatment. The bar graph compares the internalization probability of IgG–PEG and all-IgG particles with or without EIPA treatment. Each data set was obtained from 18–54 images in 3–6 independent samples.
Fig. 6
Fig. 6
(a) Uni-directional binding of the anti-CD3 coated hemisphere (shown in red) of 1.6 μm Janus particles to Jurkat T cells (shown in green). The other hemisphere of the Janus particles is PEGylated. The images are representative of the entire population of 16 particles and 12 cells. (b) Bright-field and fluorescence images show the conjugation of anti-CD3 labeled with Alexa 568 on the PEG-anti-CD3 Janus and uniform particles. Fluorescence intensity of anti-CD3 Alexa 568 is shown on the same scale in both images for direct comparison. (c) The fraction of membrane-bound particles is 26.4 ± 0.8% for PEG-anti-CD3 Janus particles and 4.2 ± 0.7% for particles uniformly coated with PEGs and anti-CD3 (PEG-anti-CD3 uniform). A total of N = 258 T cells were analyzed for the PEG-anti-CD3 Janus particles and N = 82 cells for the uniformly coated particles. Scale bars: 3 μm.

Similar articles

Cited by

References

    1. Owens DE and Peppas NA, Int. J. Pharm, 2006, 307, 93–102. - PubMed
    1. Gref R, Minamitake Y, Peracchia MT, Trubetskoy V, Torchilin V and Langer R, Science, 1994, 263, 1600–1603. - PubMed
    1. Pacheco P, White D and Sulchek T, PLoS One, 2013, 8, 1–9. - PMC - PubMed
    1. Blanco E, Shen H and Ferrari M, Nat. Biotechnol, 2015, 33, 941–951. - PMC - PubMed
    1. Hu C-MJ, Fang RH, Luk BT and Zhang L, Nanoscale, 2014, 6, 65–75. - PubMed