Review
. 2017 May;222(4):1557-1580.
doi: 10.1007/s00429-016-1338-2. Epub 2016 Dec 1.

Brain transcriptome atlases: a computational perspective

Affiliations
Review

Brain transcriptome atlases: a computational perspective

Ahmed Mahfouz et al. Brain Struct Funct. 2017 May.

Abstract

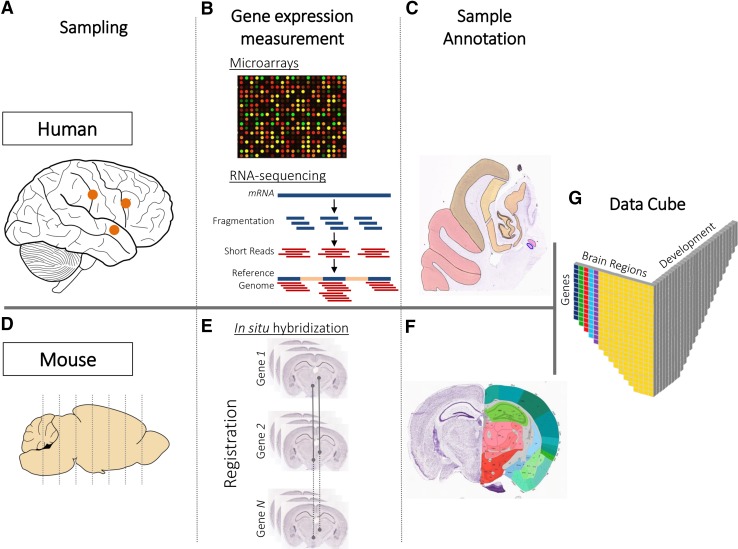
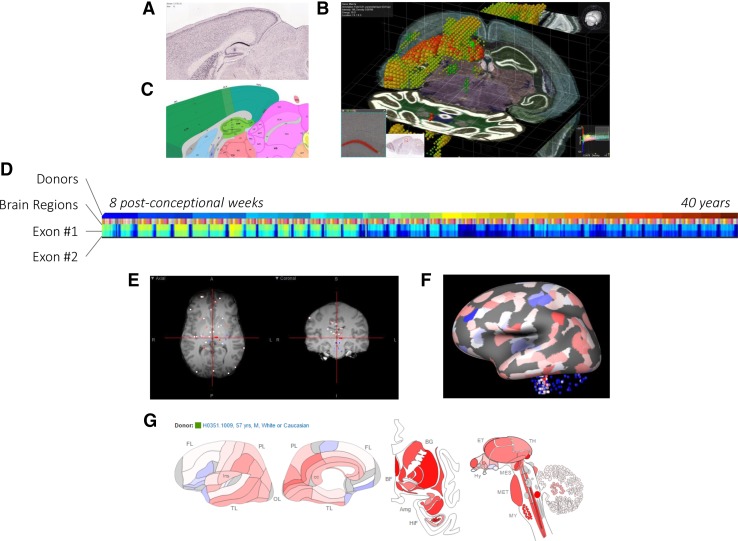
The immense complexity of the mammalian brain is largely reflected in the underlying molecular signatures of its billions of cells. Brain transcriptome atlases provide valuable insights into gene expression patterns across different brain areas throughout the course of development. Such atlases allow researchers to probe the molecular mechanisms which define neuronal identities, neuroanatomy, and patterns of connectivity. Despite the immense effort put into generating such atlases, to answer fundamental questions in neuroscience, an even greater effort is needed to develop methods to probe the resulting high-dimensional multivariate data. We provide a comprehensive overview of the various computational methods used to analyze brain transcriptome atlases.

Keywords: Brain atlases; Co-expression; Gene expression; Imaging genetics; Omics integration.


Figures

Fig. 1
Fig. 1
Spatially mapped gene expression in the mammalian brain. To map gene expression across the human and mouse brains, the Allen Institute for Brain Sciences followed two different strategies. In the human brain, samples covering all brain regions are extracted (a) and gene expression is measured using either microarray or RNA-sequencing (Hawrylycz et al. ; Miller et al. 2014b) (b). Accompanying histology sections and MRI scans are acquired to localize samples. Manual delineation of anatomical regions on the histology sections allowed for accurate sample annotation (c). In the mouse brain, gene expression is measured in coronal and sagittal sections using in situ hybridization (Lein et al. 2007) (d). Several slices covering the mouse brain are extracted per gene. Image registration methods are used to align the set of sections acquired for each gene to a common reference atlas (e). Anatomical regions are delineated on the reference atlas allowing for sample annotation (f). Data from the mouse and human atlases can be represented in a data matrix of three dimensions representing: genes, brain regions, and developmental stages (in case of the developmental atlases) (g)
Fig. 2
Fig. 2
Gene expression visualization. Gene expression of spatially mapped samples can be visualized using several approaches. a Mouse gene expression data of the gene Man1a can be investigated using the original ISH sections. b BrainExplorer software allows visualization of the 3D expression volume with an overlay of the anatomical atlas and the ability to go back to the original high-resolution ISH section. c Simultaneously, viewing the ISH section and the corresponding atlas section helps in localizing gene expression to brain regions. d Heatmaps are commonly used to visualize gene expression. Expression of the two exons of the NEUROD6 gene from the BrainSpan Atlas is visualized using a heatmap in which samples are ordered according to the age of the donor. e Samples from the Allen Human Brain Atlas are associated with coordinates of their location in the corresponding brain MRI. f Using the BrainExplorer, expression values of Mecp2 can be mapped to an inflated white matter surface for better visualization of the cortex. g Alternatively, expression values can be mapped on an anatomical atlas of the human brain
Fig. 3
Fig. 3
Spatial gene co-expression in the mouse brain. a Expression energy profiles of voxels in the hypothalamus region of the mouse brain using the same linear ordering. The estrogen receptor alpha (Esr1) gene shows high expression in the hypothalamus. The expression patterns of Irs4 and Ngb are highly correlated with that of Esr1 (R = 0.79 and R = 0.64, respectively). On the other hand, the expression pattern of Ltb is not correlated with that of Esr1 (R = 8.01 × 10−4). Correlation is calculated using Pearson correlation. b Esr1 and its highly correlated genes (Irs4 and Ngb) are highly expressed in the hypothalamus (red arrow), while Ltb is not
Fig. 4
Fig. 4
Gene co-expression networks. a Module M13 of co-expressed genes from Parikshak et al. (2013) (reprinted from Parikshak et al. Parikshak et al. , Copyright (2016), with permission from Elsevier.). The shown module is significantly enriched in autism-related genes. The shown network comprises the top 200 connected genes (highest correlation) and their top 1000 connections in the subnetwork (also ordered on correlation). Genes are labeled if they are members of relevant gene sets. b Pattern of gene expression of genes in the shown module is summarized using the first principal component (eigengene). The red line indicates birth. c Gene Ontology terms enriched in the shown module. The blue bars indicate relative enrichment compared to all cortex-expressed genes in terms of Z score. The red line indicates Z = 2
Fig. 5
Fig. 5
Dimensionality reduction of brain transcriptomes. Samples from brain transcriptomes can be embedded in a low-dimensional space by means of dimensionality reduction methods. a 2D embedding of ~60,000 voxels from the Allen Mouse Brain Atlas. b 2D embedding of ~3700 samples from the six donors in the Allen Human Brain Atlas. Both embeddings were generated using Barnes-Hut t-SNE. In both maps, colors correspond to anatomical regions of the mouse and human brain. Data from Mahfouz et al. (2015a)

Similar articles

Cited by

References

    1. Abdelmoula WM, Carreira RJ, Shyti R, et al. Automatic registration of imaging mass spectrometry data to the Allen Brain Atlas transcriptome. Anal Chem. 2014;9034:90343M. - PubMed
    1. Akbarian S, Liu C, Knowles JA, et al. The PsychENCODE project. Nat Neurosci. 2015;18:1707–1712. doi: 10.1038/nn.4156. - DOI - PMC - PubMed
    1. Alavian KN, Simon HH. Linkage of cDNA expression profiles of mesencephalic dopaminergic neurons to a genome-wide in situ hybridization database. Mol Neurodegener. 2009;4:6. doi: 10.1186/1750-1326-4-6. - DOI - PMC - PubMed
    1. Alipanahi B, Delong A, Weirauch MT, Frey BJ. Predicting the sequence specificities of DNA- and RNA-binding proteins by deep learning. Nat Biotechnol. 2015;33:1–9. doi: 10.1038/nbt.3300. - DOI - PubMed
    1. Allen JDJ, Xie Y, Chen M, et al. Comparing statistical methods for constructing large scale gene networks. PLoS One. 2012;7:e29348. doi: 10.1371/journal.pone.0029348. - DOI - PMC - PubMed

LinkOut - more resources