. 2017 Jan;28(1):5-13.
doi: 10.1007/s13361-016-1545-3. Epub 2016 Dec 1.

Native Mass Spectrometry: What is in the Name?

Affiliations

Native Mass Spectrometry: What is in the Name?

Aneika C Leney et al. J Am Soc Mass Spectrom. 2017 Jan.

Abstract

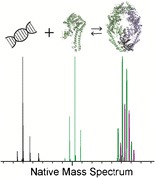
Electrospray ionization mass spectrometry (ESI-MS) is nowadays one of the cornerstones of biomolecular mass spectrometry and proteomics. Advances in sample preparation and mass analyzers have enabled researchers to extract much more information from biological samples than just the molecular weight. In particular, relevant for structural biology, noncovalent protein-protein and protein-ligand complexes can now also be analyzed by MS. For these types of analyses, assemblies need to be retained in their native quaternary state in the gas phase. This initial small niche of biomolecular mass spectrometry, nowadays often referred to as "native MS," has come to maturation over the last two decades, with dozens of laboratories using it to study mostly protein assemblies, but also DNA and RNA-protein assemblies, with the goal to define structure-function relationships. In this perspective, we describe the origins of and (re)define the term native MS, portraying in detail what we meant by "native MS," when the term was coined and also describing what it does (according to us) not entail. Additionally, we describe a few examples highlighting what native MS is, showing its successes to date while illustrating the wide scope this technology has in solving complex biological questions. Graphical Abstract ᅟ.

Keywords: Electrospray ionization mass spectrometry (ESI-MS); Native mass spectrometry.


Figures

Graphical Abstract
Graphical Abstract
Figure 1
Figure 1
Timeline and origin of native MS. Key instrumental developments (right) and biological applications (left) of native MS over the last three decades
Figure 2
Figure 2
Comparison of the MS analysis of an identical protein mixture under denatured and native MS conditions. A mixture of proteins, trypsin inhibitor, bovine serum albumin, lactate dehydrogenase, B-phycoerythrin, and apoferritin, commonly used as molecular weight markers in native PAGE, was buffer-exchanged into a water/acetonitrile/formic acid (50/49/1) solution or 100 mM aqueous ammonium acetate pH 7 for denatured MS (a) and native MS (b), respectively. For native MS analysis, the MS parameters on the Orbitrap EMR were optimised specifically for the m/z window of each protein/protein complex and the mass spectra “stitched” together. The proteins corresponding to trypsin inhibitor, bovine serum albumin, lactate dehydrogenase, B-phycoerythrin, and apoferritin are highlighted in red, orange, yellow, green, and blue, respectively. Native MS shows all proteins and protein complexes are widely separated in m/z space, in sharp contrast to denaturing MS where the m/z of the ions corresponding to all the proteins and protein subunits are collapsed in the narrow 1000–2500 m/z range
Figure 3
Figure 3
Native MS compares well with alternative methods to probe quaternary structures. (a) Cartoon of the wild-type IgG4 antibody and an IgG4 antibody whereby the hinge region is deleted (IgG4Δhinge). IgG4Δhinge exists in solution in equilibrium between its monomeric (HL) and dimeric (HL2) state. (b) Native MS of three HL mutants; IgG4Δhinge, R409KΔhinge, and F405QΔhinge. Two charge state distributions are observed for IgG4Δhinge corresponding to its monomeric and dimeric state, well separated in m/z space. In contrast, predominantly the monomeric and dimeric states were observed for the IgG4Δhinge variants F405Q and R409K, respectively. (c) Native PAGE of IgG4Δhinge, R409KΔhinge, and F405QΔhinge, showing different band migrations corresponding to the oligomeric status (i.e., monomeric/dimeric) of the variants in solution. (d) Size exclusion chromatography (SEC) multi-angle laser light scattering (MALLS) of IgG4Δhinge (red), R409KΔhinge (green), and F405QΔhinge (blue), showing the difference in retention times/molar masses measured reflecting their either monomeric, dimeric, or mixed status in solution [81]. The figure is adapted from [81]

References

    1. Smits AH, Vermeulen M. Characterizing protein–protein interactions using mass spectrometry: challenges and opportunities. Trends Biotechnol. 2016;34:825–834. doi: 10.1016/j.tibtech.2016.02.014. - DOI - PubMed
    1. Coelho ED, Arrais JP, Oliveira JL. From protein–protein interactions to rational drug design: are computational methods up to the challenge? Curr. Top. Med. Chem. 2013;13:602–618. doi: 10.2174/1568026611313050005. - DOI - PubMed
    1. Petricoin EF, Liotta LA. Mass Spectrometry-based Diagnostics: The upcoming revolution in disease detection. Clin. Chem. 2003;49:533–534. doi: 10.1373/49.4.533. - DOI - PubMed
    1. Zhang H, Cui W, Gross ML. Mass spectrometry for the biophysical characterization of therapeutic monoclonal antibodies. FEBS Lett. 2014;588:308–317. doi: 10.1016/j.febslet.2013.11.027. - DOI - PMC - PubMed
    1. Hein MY, Hubner NC, Poser I, Cox J, Nagaraj N, Toyoda Y, Gak IA, Weisswange I, Mansfeld J, Buchholz F, Hyman AA, Mann M. A human interactome in three quantitative dimensions organized by stoichiometries and abundances. Cell. 2015;163:712–723. doi: 10.1016/j.cell.2015.09.053. - DOI - PubMed