. 2016 Dec 2:6:37666.
doi: 10.1038/srep37666.

Biomechanical Analysis of Normal Brain Development during the First Year of Life Using Finite Strain Theory

Affiliations

Biomechanical Analysis of Normal Brain Development during the First Year of Life Using Finite Strain Theory

Jeong Chul Kim et al. Sci Rep. .

Abstract

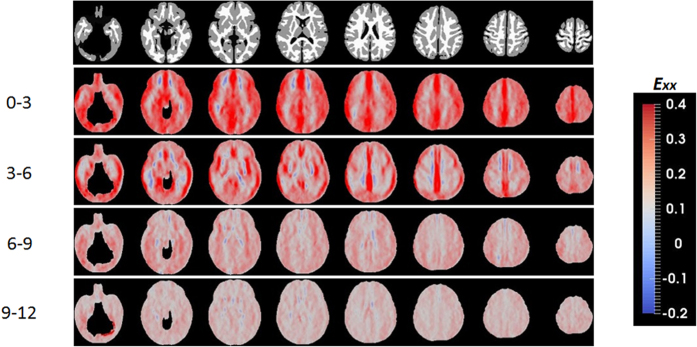
The first year of life is the most critical time period for structural and functional development of the human brain. Combining longitudinal MR imaging and finite strain theory, this study aimed to provide new insights into normal brain development through a biomechanical framework. Thirty-three normal infants were longitudinally imaged using MRI from 2 weeks to 1 year of age. Voxel-wise Jacobian determinant was estimated to elucidate volumetric changes while Lagrange strains (both normal and shear strains) were measured to reveal directional growth information every 3 months during the first year of life. Directional normal strain maps revealed that, during the first 6 months, the growth pattern of gray matter is anisotropic and spatially inhomogeneous with higher left-right stretch around the temporal lobe and interhemispheric fissure, anterior-posterior stretch in the frontal and occipital lobes, and superior-inferior stretch in right inferior occipital and right inferior temporal gyri. In contrast, anterior lateral ventricles and insula showed an isotropic stretch pattern. Volumetric and directional growth rates were linearly decreased with age for most of the cortical regions. Our results revealed anisotropic and inhomogeneous brain growth patterns of the human brain during the first year of life using longitudinal MRI and a biomechanical framework.


Figures

Figure 1
Figure 1. Mean volume growth rates (JD) of the four time periods during the first year of life.
The anterior/posterior regions of corona radiate show the lowest local volume change during 0–3 months (arrows). A higher volume expansion at the insula cortex is observed during 3–6 months (arrow). Whole brain distributions of JD during the time periods are shown in the upper right column where x-axis and y-axis represent the JD values and the relative probability density, respectively.
Figure 2
Figure 2. The anisotropy of directional growth (ADG) maps based on directional stretches along the main axes.
Figure 3
Figure 3. Left to right directional normal strains during the first year of life.
Figure 4
Figure 4. Posterior-anterior directional normal strains during the first year of life.
Figure 5
Figure 5. Inferior to superior directional normal strains during the first year of life.
Figure 6
Figure 6. Mean deformation angles exerted by shear strains derived from off-diagonal components of Lagrange strain are showed for every 3 months of the first year of life.
Pictorial descriptions of the anticipated deformation profiles with respect to each shear stress are provided in the right column. Gray cubes represent tissue elements before deformation, and green deformed cubes with red planes represent tissue element when positive shear strains are applied. Yellow lines represent deformation angles.
Figure 7
Figure 7. Age effects on volumetric and directional growth rates of the brain.
Most gray matter regions show statistically significant age effects. These regions correspond to higher growth regions during the first 6 months. In most cortical regions, volumetric growth rate decreases with age. However, anterior and posterior regions of corona radiata don’t show significant age effect in volumetric growth rates (arrows). While directional elongations show significant age effect for most of the cortical regions, only limited regions show age effect in shear strains.
Figure 8
Figure 8. Representative longitudinal images of T1, T2 and FA for a single subject.
Figure 9
Figure 9. Estimation of growth rates (JD and Lagrange strain) of the brain for the first year of life.
Using longitudinal segmentation/registration, 3D deformation fields of the 4 time periods (month 0–3, 3–6, 6–9 and 9–12) were derived. Volumetric and directional growth rates for every 3 months were estimated based on 3D deformation fields and finite strain theory. Parameters of growth rates were registered to the final time point of each subject and warped to the Year-1 infant Atlas for statistical analysis.

References

    1. Bompard L. et al.. Multivariate longitudinal shape analysis of human lateral ventricles during the first twenty-four months of life. PLoS One. 9, e108306 (2014). - PMC - PubMed
    1. Gao W. et al.. Functional Network Development During the First Year: Relative Sequence and Socioeconomic Correlations. Cereb Cortex. 25, 2919–2928 (2015). - PMC - PubMed
    1. Knickmeyer R. C. et al.. A structural MRI study of human brain development from birth to 2 years. J Neurosci. 28, 12176–12182 (2008). - PMC - PubMed
    1. Courchesne E., Carper R. & Akshoomoff N. Evidence of brain overgrowth in the first year of life in autism. JAMA. 290, 337–344 (2003). - PubMed
    1. Lee A. D. et al.. 3D pattern of brain abnormalities in Fragile X syndrome visualized using tensor-based morphometry. Neuroimage. 34, 924–938 (2007). - PMC - PubMed

MeSH terms