. 2016 Dec 2:6:38260.
doi: 10.1038/srep38260.

Genome-wide characterisation and expression profile of the grapevine ATL ubiquitin ligase family reveal biotic and abiotic stress-responsive and development-related members

Affiliations

Genome-wide characterisation and expression profile of the grapevine ATL ubiquitin ligase family reveal biotic and abiotic stress-responsive and development-related members

Pietro Ariani et al. Sci Rep. .

Abstract

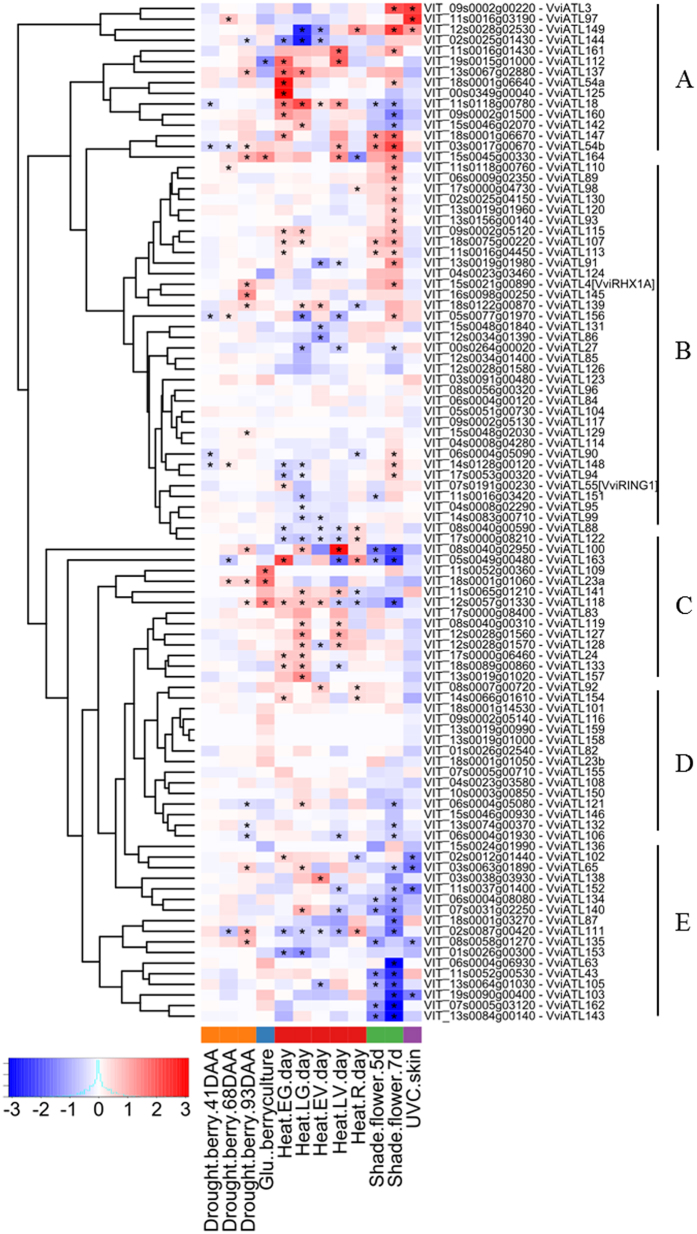
The Arabidopsis Tóxicos en Levadura (ATL) protein family is a class of E3 ubiquitin ligases with a characteristic RING-H2 Zn-finger structure that mediates diverse physiological processes and stress responses in plants. We carried out a genome-wide survey of grapevine (Vitis vinifera L.) ATL genes and retrieved 96 sequences containing the canonical ATL RING-H2 domain. We analysed their genomic organisation, gene structure and evolution, protein domains and phylogenetic relationships. Clustering revealed several clades, as already reported in Arabidopsis thaliana and rice (Oryza sativa), with an expanded subgroup of grapevine-specific genes. Most of the grapevine ATL genes lacked introns and were scattered among the 19 chromosomes, with a high level of duplication retention. Expression profiling revealed that some ATL genes are expressed specifically during early or late development and may participate in the juvenile to mature plant transition, whereas others may play a role in pathogen and/or abiotic stress responses, making them key candidates for further functional analysis. Our data offer the first genome-wide overview and annotation of the grapevine ATL family, and provide a basis for investigating the roles of specific family members in grapevine physiology and stress responses, as well as potential biotechnological applications.


Figures

Figure 1
Figure 1. Sequence LOGO of the VviATL RING-H2 domains.
The LOGO was generated from the protein sequences of the 96 ATLs identified in the whole Vitis vinifera genome.
Figure 2
Figure 2. Phylogenetic analysis of the V. vinifera and A. thaliana ATL genes.
The unrooted tree was generated with the Phylogeny.fr suite (http://www.phylogeny.fr) using the full-length nucleotide coding sequences of the 96 grapevine ATL genes identified herein (in green) and the 83 ATL genes of A. thaliana reported in the UniProt database (in yellow). Branch support values were obtained from 100 bootstrap replicates. The red stars indicate the presence of a BZF domain in the corresponding proteins.
Figure 3
Figure 3. Distribution of grapevine ATL gene family members among the Vitis vinifera chromosomes.
The 96 grapevine ATL genes with exact chromosomal information available in the database were mapped to the 19 V. vinifera chromosomes. The colours indicate the original duplication event. Vertical black lines and red lines identify pairs derived from tandem duplications and whole genome duplications, respectively.
Figure 4
Figure 4. Phylogenetic analysis and main features of grapevine ATL proteins.
The unrooted tree was generated with the Phylogeny.fr suite (http://www.phylogeny.fr) using the full-length protein sequences of the 96 grapevine ATLs identified herein. Branch support values were obtained from 100 bootstrap replicates. For each ATL protein, the protein length (blue bars), the presence of transmembrane/hydrophobic domains (in green) and putative phosphorylation sites predicted with MUsite v1.0 (in yellow) are shown. The length of coloured bars is proportional to the number of amino acids, TM or hydrophobic domains and phosphosites, respectively. The grey line represents the threshold for a domain to be considered as a TM (above the line) or hydrophobic domain (on the line). Red stars represent the presence of a BZF domain in the corresponding protein.
Figure 5
Figure 5. Hierarchical clustering of the expression profiles of grapevine ATL genes in different organs.
The log transformed expression values of grapevine ATL genes in the grapevine atlas were used for hierarchical cluster analysis based on Pearson’s distance metric. The colour scale represents higher (red) or lower (green) expression levels with respect to the median transcript abundance of each gene across all samples. Letters A to E on the right side indicate the different clusters identified. AB: after burst; B: burst; bud-W: winter bud; F: flowering; FB: flowering begins; FS: fruit set; G: green; MR: mid-ripening; PFS: post-fruit set; PHWI-II-III: post-harvest withering 1, 2 and 3 months; R: ripening; S: senescent; stem-W: woody stem; V: veraison; WD: well developed; Y: young.
Figure 6
Figure 6. Hierarchical clustering of the expression profiles of grapevine ATL genes in the grapevine–pathogen interaction dataset.
The colour scale represents increased (red) or decreased (blue) fold changes of grapevine ATL gene expression in infected samples compared to controls for each condition. Asterisks indicate the significant differential expression (FDR < 0.5) of each ATL under the corresponding conditions. References to the published datasets and differential expression criteria are reported in the Materials and Methods.
Figure 7
Figure 7. Hierarchical clustering of the expression profiles of grapevine ATL genes in the grapevine abiotic stress datasets.
The colour scale represents increased (red) or decreased (blue) fold changes of grapevine ATL gene expression in samples exposed to abiotic stress compared to controls for each condition. Asterisks indicate the significant differential expression (FDR < 0.5) of each ATL under the corresponding conditions. References to the published datasets and differential expression criteria are reported in the Materials and Methods.

References

    1. Hershko A. & Ciechanover A. The ubiquitin system. Annual Review of Biochemistry 67, 425–479, doi: 10.1146/annurev.biochem.67.1.425 (1998). - DOI - PubMed
    1. Vierstra R. D. The ubiquitin-26S proteasome system at the nexus of plant biology. Nat Rev Mol Cell Biol 10, 385–397 (2009). - PubMed
    1. Glickman M. H. & Ciechanover A. The Ubiquitin-Proteasome Proteolytic Pathway: Destruction for the Sake of Construction. Physiological Reviews 82, 373–428, doi: 10.1152/physrev.00027.2001 (2002). - DOI - PubMed
    1. Sadanandom A., Bailey M., Ewan R., Lee J. & Nelis S. The ubiquitin–proteasome system: central modifier of plant signalling. New Phytologist 196, 13–28, doi: 10.1111/j.1469-8137.2012.04266.x (2012). - DOI - PubMed
    1. Pickart C. M. & Fushman D. Polyubiquitin chains: polymeric protein signals. Current Opinion in Chemical Biology 8, 610–616, doi: 10.1016/j.cbpa.2004.09.009 (2004). - DOI - PubMed

Publication types

MeSH terms