. 2017 Apr 15;195(8):1010-1021.
doi: 10.1164/rccm.201604-0759OC.

Secretory IgA Deficiency in Individual Small Airways Is Associated with Persistent Inflammation and Remodeling

Affiliations

Secretory IgA Deficiency in Individual Small Airways Is Associated with Persistent Inflammation and Remodeling

Vasiliy V Polosukhin et al. Am J Respir Crit Care Med. .

Abstract

Rationale: Maintenance of a surface immune barrier is important for homeostasis in organs with mucosal surfaces that interface with the external environment; however, the role of the mucosal immune system in chronic lung diseases is incompletely understood.

Objectives: We examined the relationship between secretory IgA (SIgA) on the mucosal surface of small airways and parameters of inflammation and airway wall remodeling in chronic obstructive pulmonary disease (COPD).

Methods: We studied 1,104 small airways (<2 mm in diameter) from 50 former smokers with COPD and 39 control subjects. Small airways were identified on serial tissue sections and examined for epithelial morphology, SIgA, bacterial DNA, nuclear factor-κB activation, neutrophil and macrophage infiltration, and airway wall thickness.

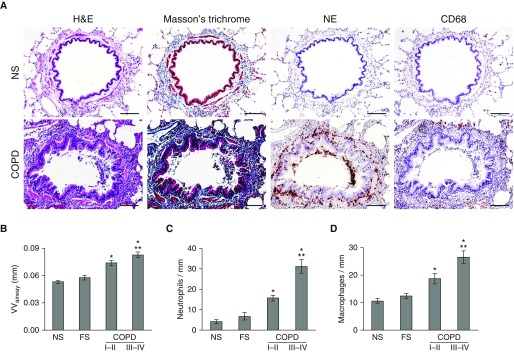
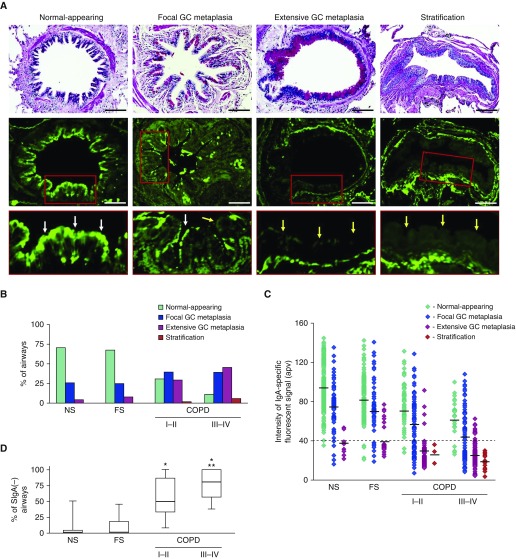
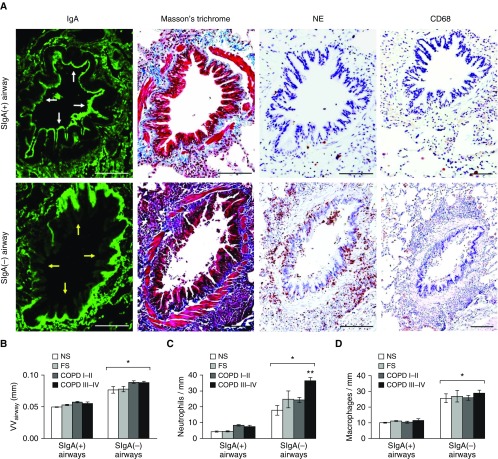
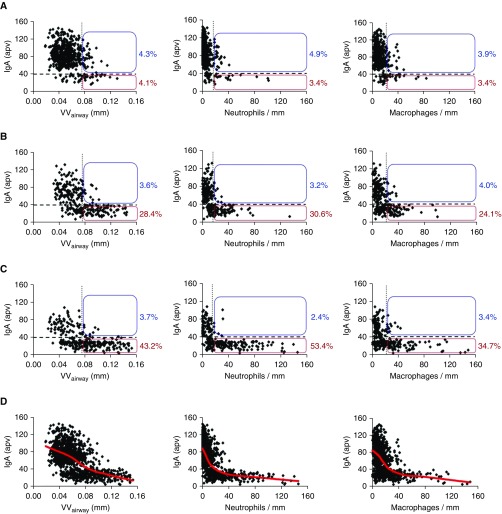
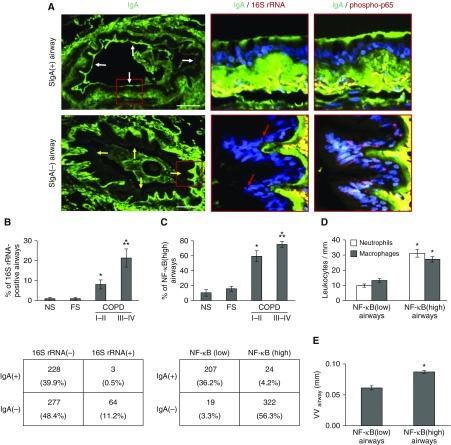
Measurements and main results: Morphometric evaluation of small airways revealed increased mean airway wall thickness and inflammatory cell counts in lungs from patients with COPD compared with control subjects, whereas SIgA level on the mucosal surface was decreased. However, when small airways were classified as SIgA intact or SIgA deficient, we found that pathologic changes were localized almost exclusively to SIgA-deficient airways, regardless of study group. SIgA-deficient airways were characterized by (1) abnormal epithelial morphology, (2) invasion of bacteria across the apical epithelial barrier, (3) nuclear factor-κB activation, (4) accumulation of macrophages and neutrophils, and (5) fibrotic remodeling of the airway wall.

Conclusions: Our findings support the concept that localized, acquired SIgA deficiency in individual small airways of patients with COPD allows colonizing bacteria to cross the epithelial barrier and drive persistent inflammation and airway wall remodeling, even after smoking cessation.

Keywords: NF-κB; chronic obstructive pulmonary disease; neutrophils; secretory IgA; small airways.


Figures

Figure 1.
Figure 1.
Inflammation and remodeling of small airways in chronic obstructive pulmonary disease (COPD) correlate with disease severity. (A, top) Representative small airway from a lifelong nonsmoker without COPD showing normal-appearing structural organization with few neutrophils within subepithelium or macrophages in peribronchial airspace. (A, bottom) Small airway from a former smoker with COPD with increased wall thickness/remodeling and inflammation. Images in each row represent the same airways identified on serial tissue sections stained with hematoxylin and eosin, Masson trichrome, antibodies against neutrophil elastase for identification of neutrophils, and anti-CD68 antibodies for macrophages. Scale bars = 100 µm. (B) Mean airway wall thickness for each subject from the following groups: 24 lifelong nonsmokers, 15 former smokers without COPD, 20 patients with Global Initiative for Chronic Obstructive Lung Disease (GOLD) stage II–III COPD, and 30 patients with GOLD stage III–IV COPD. (C) Mean neutrophil and (D) mean macrophage counts for each subject, normalized for length of basement membrane. Data are presented as mean ± SEM. Groups were compared using analysis of variance and a Bonferroni post-test to correct for four separate comparisons among the subject groups. *Significantly different compared with NS. **Significantly different compared with GOLD stage I–II COPD. FS = former smoker without COPD; H&E = hematoxylin and eosin; NE = neutrophil elastase; NS = lifelong nonsmoker without COPD; VVairway = mean airway wall thickness.
Figure 2.
Figure 2.
Epithelial remodeling is common in small airways from patients with chronic obstructive pulmonary disease (COPD) and is associated with loss of secretory IgA (SIgA) on the luminal surface. (A) Small airways with different epithelial morphologies including normal-appearing, focal goblet cell (GC) metaplasia (involving <25% of the epithelial surface), extensive GC metaplasia (involving >25% of the epithelial surface), and stratification (top). Periodic acid–Schiff stain, scale bars = 100 µm. Confocal immunofluorescence microscopy for anti-IgA antibody (green, middle). Insets with white arrows show SIgA on mucosal surface and yellow arrows denote mucosal surface in SIgA-deficient airways (bottom). (B) Distribution of epithelial morphology in all small airways examined from lifelong nonsmokers, former smokers without COPD, former smokers with Global Initiative for Chronic Obstructive Lung Disease (GOLD) stage I–II COPD, and former smokers with GOLD stage III–IV COPD. The percentage of airways with extensive GC metaplasia or stratification is increased in subjects with COPD (P < 0.01 by Dirichlet regression model). (C) Levels of IgA-specific fluorescence on the luminal surface of each small airway plotted by epithelial morphology. Mean actual pixel value for each epithelial subtype in each group is indicated. Dashed line indicates the cutoff for classifying airways as SIgA(+) or SIgA(−). (D) Box-and-whisker plot showing median, 25th–75th percentile, and range for the percentage of SIgA(−) airways in each group of subjects. Groups were compared using a Kruskal-Wallis test followed by Mann-Whitney U tests for four prespecified pair-wise comparisons (significance level was Bonferroni adjusted at 0.0125). *Significantly different compared with nonsmoker. **Significantly different compared with GOLD stage I–II COPD. apv = actual pixel value; FS = former smoker; NS = nonsmoker.
Figure 3.
Figure 3.
Airway surface secretory IgA (SIgA) deficiency is associated with fibrotic remodeling of the airway wall and inflammatory cell accumulation. (A) SIgA(+) small airway from patient with chronic obstructive pulmonary disease (COPD) without signs of wall thickness/remodeling and inflammation (top). SIgA(−) small airway from the same patient with COPD with increased wall thickness/remodeling and inflammation (bottom). Each row of images represents the same airways identified on serial tissue sections with immunofluorescent staining for IgA, Masson trichrome staining, and immunostaining for neutrophil elastase and CD68. White arrows indicate the apical epithelial border of a SIgA(+) airway; yellow arrows indicate the apical epithelial border of a SIgA(−) airway. Scale bars = 100 µm. (B) Mean airway wall thickness for SIgA(+) and SIgA(−) airways from each subject according to patient group (nonsmoker, former smoker, COPD I–II, COPD III–IV). (C and D) Mean numbers of neutrophils and macrophages for SIgA(+) and SIgA(−) airways from each subject, normalized to basement membrane length. Data are presented as mean ± SEM. A mixed effect model was conducted to compare the difference between SIgA(+) and SIgA(−) airways and across subject groups. *Significantly different compared with SIgA(+) airways. **Significantly different compared with other groups of SIgA(−) airways. FS = former smoker; NE = neutrophil elastase; NS = nonsmoker; VVairway = mean airway wall thickness.
Figure 4.
Figure 4.
Airway wall thickness and leukocyte accumulation are associated with the secretory IgA (SIgA) status of individual small airways. (A–C) IgA-specific fluorescence intensity plotted against airway wall thickness (VVairway), neutrophil counts, and macrophage counts for each individual small airway. Airways from lifelong nonsmokers and former smokers without chronic obstructive pulmonary disease were combined as a control group. The horizontal dashed line represents the cutoff for classifying airways as SIgA(+) or SIgA(−); vertical dotted line in each graph represents 2 SD above the mean for the control group. Boxes show the percentage of SIgA(+) and SIgA(−) airways with increased VVairway, neutrophils, or macrophage counts as defined previously. (D) Correlation of IgA-specific fluorescence on the surfaces of individual small airways and VVairway, neutrophil counts, and macrophage counts for all 1,104 airways. apv = actual pixel value. Red line represents the LOESS (locally weighted scatter plot smoother) curve for each scatterplot. A mixed effect model was used to identify a significant inverse relationship (P < 0.001) between IgA-specific fluorescence and VVairway, neutrophils, and macrophages. (A) Control subjects; (B) chronic obstructive pulmonary disease (COPD) I–II; (C) COPD III–IV; (D) combined (nonsmokers, former smokers, and COPD).
Figure 5.
Figure 5.
Bacterial invasion of the bronchial mucosa and activation of the nuclear factor (NF)-κB pathway is localized to secretory IgA (SIgA)(−) airways. (A) Immunofluorescence staining for IgA on the epithelial surface of an SIgA(+) airway and an SIgA(−) airway from the same patient with chronic obstructive pulmonary disease (COPD). Red boxes indicate areas shown in panels to the right. Serial sections show IgA (green) and bacterial DNA identified by fluorescent in situ hybridization with a 16S rRNA gene probe (red, indicated by arrows). Bacteria are intercalated within the airway epithelium of the SIgA(−) airway, but no bacterial DNA is identified in the SIgA(+) airway. Additional sections show IgA (green) and immunofluorescent detection of phospho-p65 (Ser276) in the nucleus (red) as an indicator of NF-κB activation. The yellow areas below the basement membrane represent autofluorescence of collagen bundles. White arrows indicate the apical epithelial border of a SIgA(+) airway; yellow arrows indicate the apical epithelial border of a SIgA(−) airway. Scale bars = 100 µm. (B) Mean percentage of airways positive for 16S bacterial DNA for each individual in each group of subjects. Groups were compared using analysis of variance and a Bonferroni post-test to correct for four separate comparisons among the subject groups. *Significantly different compared with nonsmoker. **Significantly different compared with COPD I–II. The table illustrates the distribution of 572 airways in all 50 subjects with COPD based on the presence or absence of bacterial DNA within the epithelial lining according to SIgA status. (C) Mean percentage of NF-κB(high) airways (defined as >5% of epithelial cells positive for nuclear phospho-p65) for each individual in each group of subjects. Groups were compared using analysis of variance and a Bonferroni post-test to correct for four separate comparisons among the subject groups. *Significantly different compared with nonsmoker. **Significantly different compared with COPD I–II. The table shows the distribution of airways in subjects with COPD based on NF-κB activation and SIgA status. (D) Mean numbers of leukocytes (neutrophils or macrophages) normalized to basement membrane length from small airways in lung sections from each patient with COPD based on NF-κB activation status (NF-κB[low] or NF-κB[high]). (E) Mean airway wall thickness measurements normalized to basement membrane length from small airways in lung sections from each patient with COPD based on NF-κB activation status. A mixed effect model was conducted to compare the difference between NF-κB(low) and NF-κB(high) airways. *Significantly different compared with NF-κB(low) airways. FS = former smoker; NS = nonsmoker; VVairway = mean airway wall thickness.

Comment in

References

    1. Vestbo J, Hurd SS, Agustí AG, Jones PW, Vogelmeier C, Anzueto A, Barnes PJ, Fabbri LM, Martinez FJ, Nishimura M, et al. Global strategy for the diagnosis, management, and prevention of chronic obstructive pulmonary disease: GOLD executive summary. Am J Respir Crit Care Med. 2013;187:347–365. - PubMed
    1. 2014 Global strategy for the diagnosis, management, and prevention of chronic obstructive pulmonary disease: Revised 2014. Global Initiative for Chronic Obstructive Lung Disease (GOLD) [accessed 2014 Jan 23]. Available from: www.goldcopd.org.
    1. Celli BR, Decramer M, Wedzicha JA, Wilson KC, Agustí A, Criner GJ, MacNee W, Make BJ, Rennard SI, Stockley RA, et al. ATS/ERS Task Force for COPD Research. An Official American Thoracic Society/European Respiratory Society Statement: Research questions in chronic obstructive pulmonary disease. Am J Respir Crit Care Med. 2015;191:e4–e27. - PubMed
    1. Hogg JC, Macklem PT, Thurlbeck WM. Site and nature of airway obstruction in chronic obstructive lung disease. N Engl J Med. 1968;278:1355–1360. - PubMed
    1. Yanai M, Sekizawa K, Ohrui T, Sasaki H, Takishima T. Site of airway obstruction in pulmonary disease: direct measurement of intrabronchial pressure. J Appl Physiol (1985) 1992;72:1016–1023. - PubMed

Publication types

Supplementary concepts