. 2016 Nov 9;36(45):11544-11558.
doi: 10.1523/JNEUROSCI.1279-16.2016.

Multimodal Imaging for DREADD-Expressing Neurons in Living Brain and Their Application to Implantation of iPSC-Derived Neural Progenitors

Affiliations

Multimodal Imaging for DREADD-Expressing Neurons in Living Brain and Their Application to Implantation of iPSC-Derived Neural Progenitors

Bin Ji et al. J Neurosci. .

Abstract

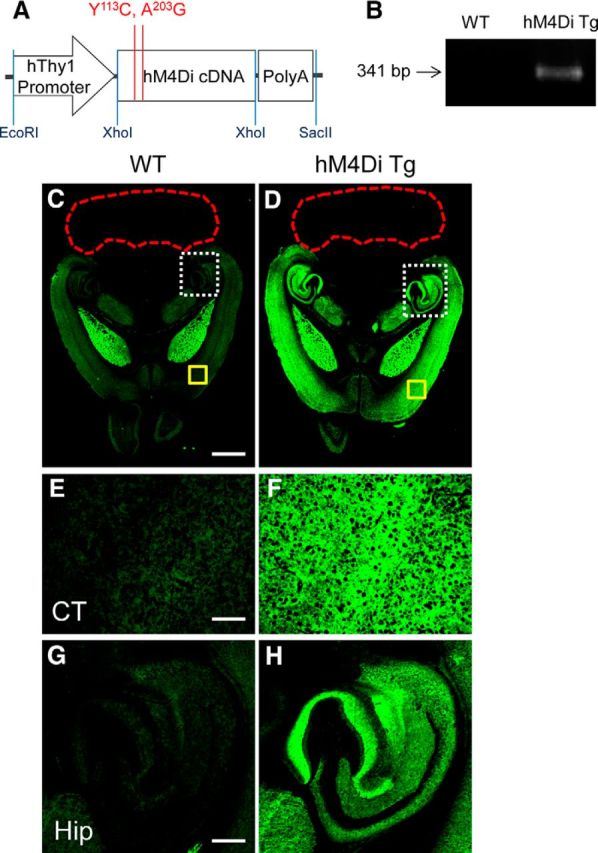
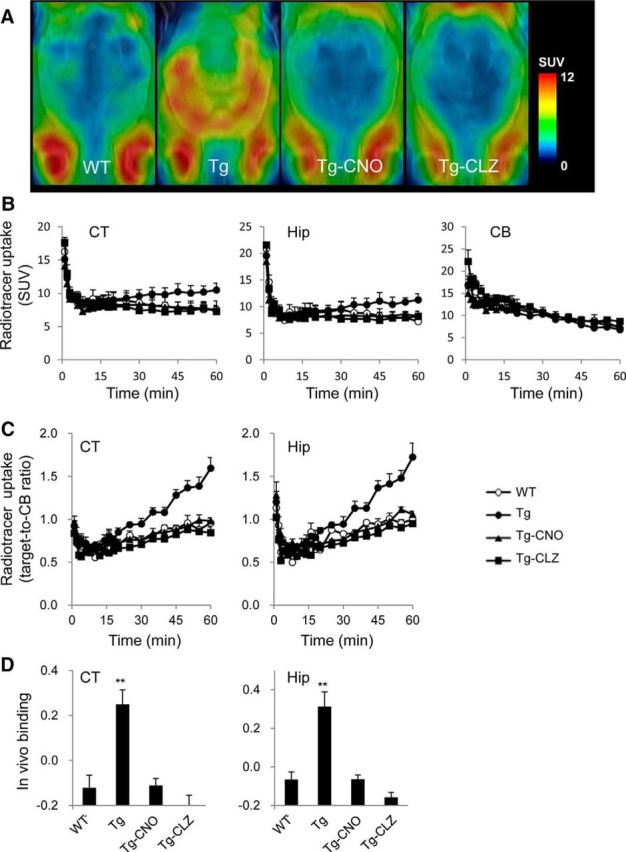
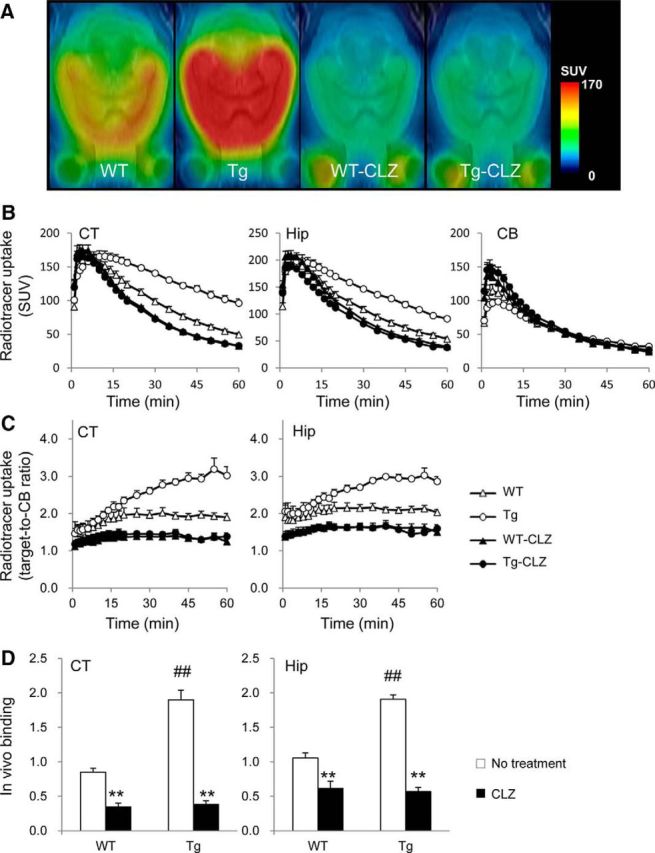
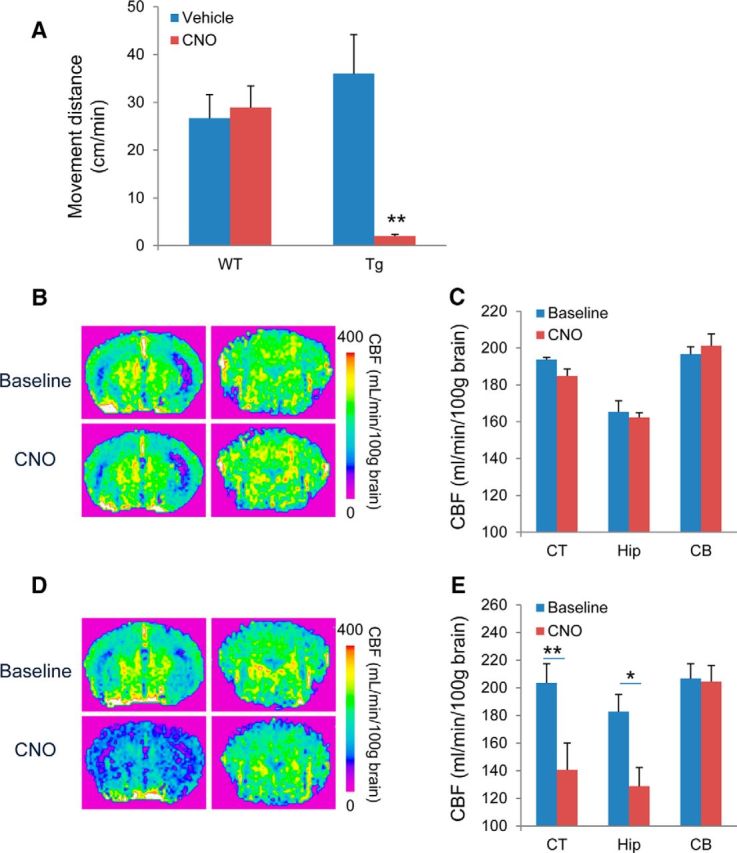
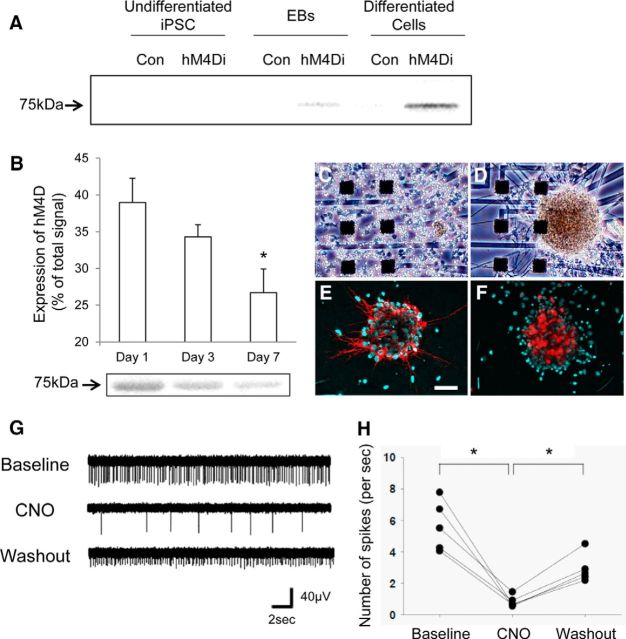
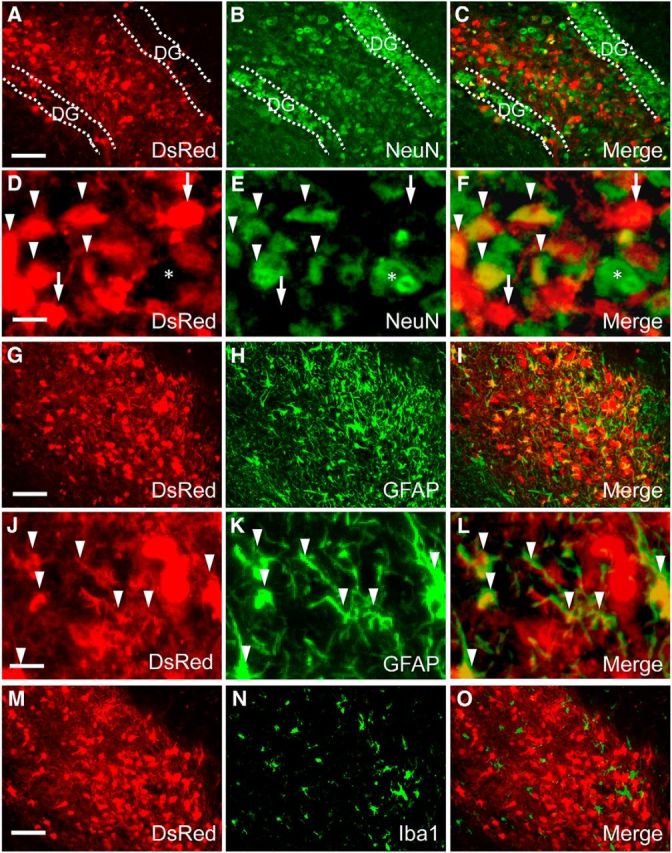
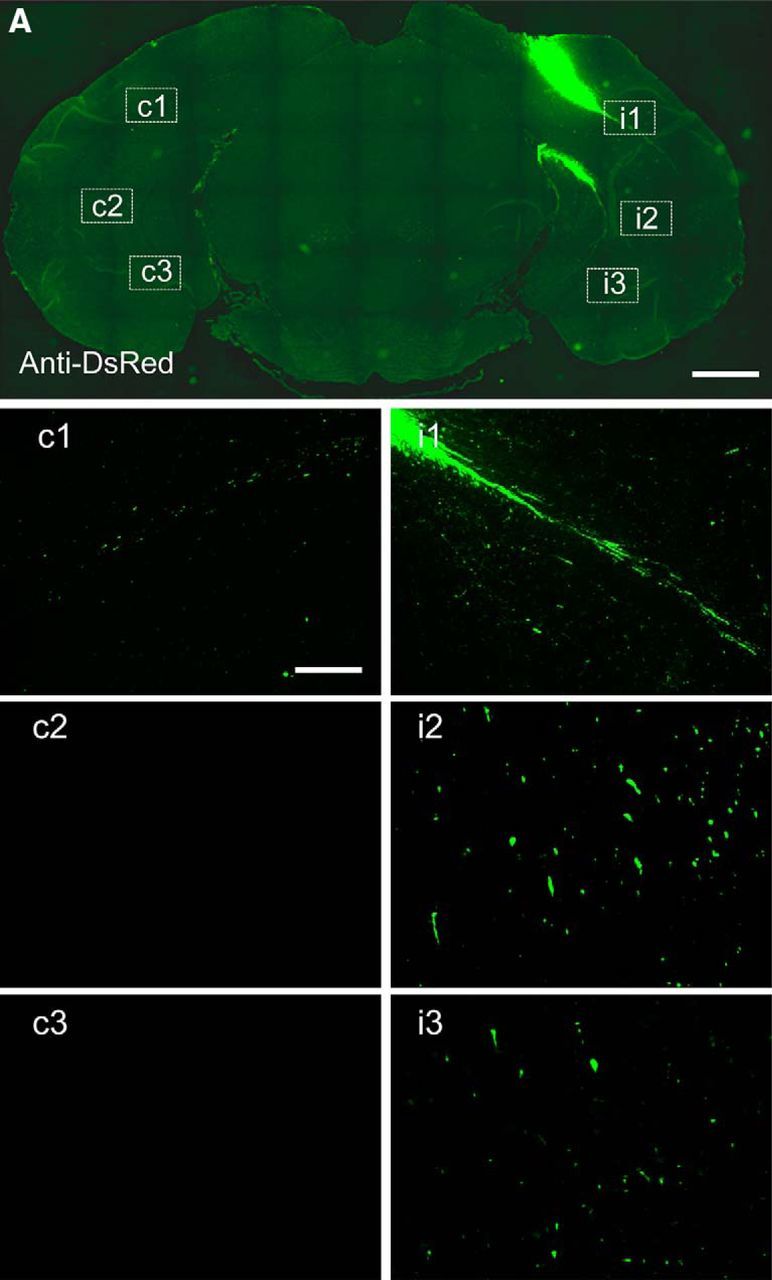
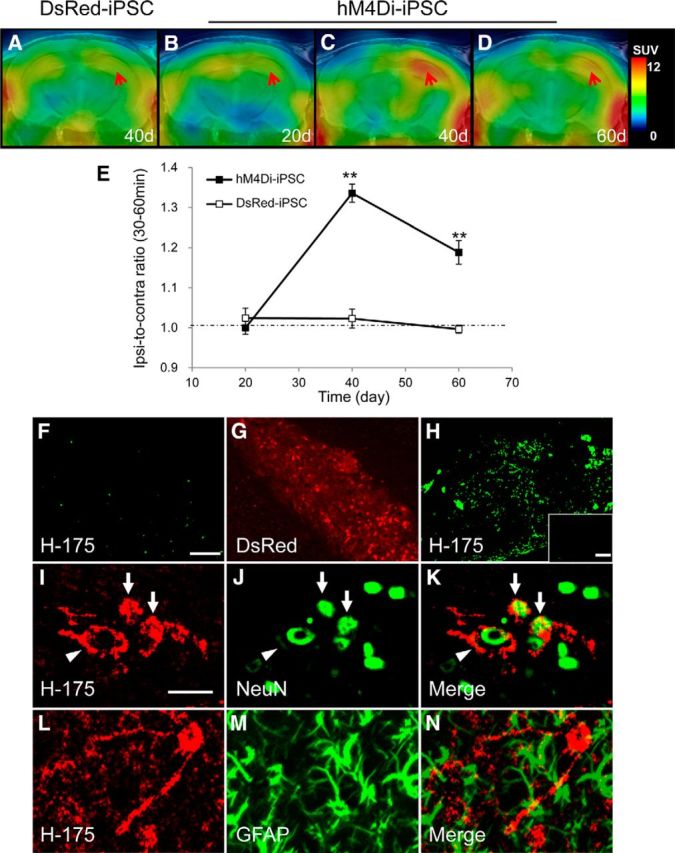
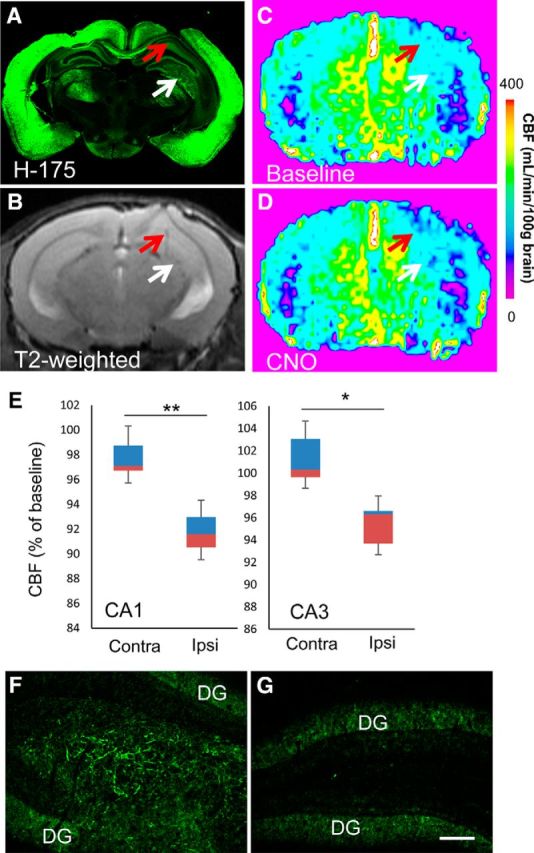
Chemogenetic manipulation of neuronal activities has been enabled by a designer receptor (designer receptor exclusively activated by designer drugs, DREADD) that is activated exclusively by clozapine-N-oxide (CNO). Here, we applied CNO as a functional reporter probe to positron emission tomography (PET) of DREADD in living brains. Mutant human M4 DREADD (hM4Di) expressed in transgenic (Tg) mouse neurons was visualized by PET with microdose [11C]CNO. Deactivation of DREADD-expressing neurons in these mice by nonradioactive CNO at a pharmacological dose could also be captured by arterial spin labeling MRI (ASL-MRI). Neural progenitors derived from hM4Di Tg-induced pluripotent stem cells were then implanted into WT mouse brains and neuronal differentiation of the grafts could be imaged by [11C]CNO-PET. Finally, ASL-MRI captured chemogenetic functional manipulation of the graft neurons. Our data provide the first demonstration of multimodal molecular/functional imaging of cells expressing a functional gene reporter in the brain, which would be translatable to humans for therapeutic gene transfers and cell replacements.

Significance statement: The present work provides the first successful demonstration of in vivo positron emission tomographic (PET) visualization of a chemogenetic designer receptor (designer receptor exclusively activated by designer drugs, DREADD) expressed in living brains. This technology has been applied to longitudinal PET reporter imaging of neuronal grafts differentiated from induced pluripotent stem cells. Differentiated from currently used reporter genes for neuroimaging, DREADD has also been available for functional manipulation of target cells, which could be visualized by functional magnetic resonance imaging (fMRI) in a real-time manner. Multimodal imaging with PET/fMRI enables the visualization of the differentiation of iPSC-derived neural progenitors into mature neurons and DREADD-mediated functional manipulation along the time course of the graft and is accordingly capable of fortifying the utility of stem cells in cell replacement therapies.

Keywords: cell replacement therapy; clozapine-N-oxide (CNO); designer receptor exclusively activated by designer drugs (DREADD); induced pluripotent stem cell (iPSC); positron emission tomography (PET).


Figures

Figure 1.
Figure 1.
Expression of hM4Di in the Tg mouse. A, Expression construct with mutations of two conserved orthosteric site residues (Y113C/A203G) in human M4 mAChR (Chrm4) used to generate hM4Di Tg mouse. B, PCR product of the hM4Di transgene with expected molecular size at 341 bp in WT and Tg mice. The image is representative of >10 assays. CH, C and D show low-power immunohistochemical images of H-175, a commercial antibody against human M4 mAChR, in horizontal brain sections containing the neocortex (CT; areas outlined with yellow solid lines in C and D are shown in E and F at high power, respectively), hippocampus (Hip; areas outlined with white dotted lines in C and D are shown in G and H at high power, respectively), and cerebellum (outlined with red dotted lines) in WT (C, E, G) and hM4Di Tg (D, F, H) mice. The images are representative of data from 5 WT and 4 Tg mice. Scale bars: C, D: 1 mm; EH, 200 μm.
Figure 2.
Figure 2.
In vivo PET measures in the brains of WT and hM4Di Tg mice after intravenous injection of [11C]CNO. A, [11C]CNO PET imaging in WT and hM4Di Tg mice. The PET images of [11C]CNO generated from averaged dynamic data (30–60 min) are overlapped with the MRI template of mouse horizontal brain sections. From left to right, the images are representative data from WT and hM4Di Tg mice and hM4Di Tg mice pretreated with CNO (Tg-CNO) and CLZ (Tg-CLZ). Radioligand accumulation in putative Harderian glands was observed around the bottom of each image and was assumed to be nonspecific because it was not blocked by the pretreatments. B, C, [11C]CNO uptake quantified as standardized uptake value (SUV; percentage of injected dose per milliliter tissue × body weight in grams) (B) and target-to-reference ratio of radioactivity (C) in the neocortex (CT), hippocampus (Hip), and cerebellum (CB; selected as a reference region) of WT (open circles) and hM4Di Tg (filled circles) mice and hM4Di Tg mice pretreated with CNO (Tg-CNO, filled triangles) and CLZ (Tg-CLZ, filled squares; n = 4–5 in each group) over the scan time. D, In vivo binding of [11C]CNO determined as target-to-cerebellum ratio of radioactivity (average of data at 30–60 min) − 1. There was a significant main effect of group on in vivo binding in CT (F(3, 14) = 13.19, p < 0.01 by one-way ANOVA) and Hip (F(3, 14) = 15.38, p < 0.01 by one-way ANOVA), and the binding in untreated Tg mice was significantly higher than that in the other three groups (**p < 0.01 by post hoc Bonferroni's test). No statistically significant differences were found between any two of WT, Tg-CNO, and Tg-CLZ groups in either CT or Hip. Error bars indicate SE.
Figure 3.
Figure 3.
In vivo PET measurements in the brains of WT and hM4Di Tg mice after intravenous injection of [11C]CLZ. A, The PET images of [11C]CLZ generated by averaging dynamic data at 30–60 min are overlapped with an MRI template of mouse horizontal brain sections. From left to right, the images are representative of data from WT and hM4Di Tg mice and WT (WT-CLZ) and Tg (Tg-CLZ) mice pretreated with CLZ. B, C, [11C]CLZ uptake expressed as percentage of ID/ml (B) and target-to-reference ratio of radioactivity (C) in the neocortex (CT), hippocampus (Hip), and cerebellum (CB; selected as a reference region) of WT (open triangles) and hM4Di Tg (open circles) mice and CLZ-pretreated WT (WT-CNO, filled triangles) and Tg (Tg-CLZ, filled circles) mice (n = 4–5 in each group) over the scan time. D, In vivo binding of [11C]CLZ determined as target-to-cerebellum ratio of radioactivity (average of data at 30 – 60 min) − 1 for untreated (open columns) and CLZ-pretreated (filled columns) mice. There were significant main effects of the genotype and CLZ pretreatment on in vivo binding in CT (F(1, 12) = 36.57 and 126.92, respectively, p < 0.01 by two-way ANOVA) and Hip (F(1, 12) = 18.69 and 90.62, respectively, p < 0.01 by two-way ANOVA). In both regions, the binding in untreated Tg mice was significantly higher than that in WT mice (#p < 0.01 by post hoc Bonferroni's test) and CLZ pretreatment decreased the binding significantly in both genotypes (**p < 0.01 by post hoc Bonferroni's test). Error bars indicate SE.
Figure 4.
Figure 4.
Neuronal silencing exclusively induced by CNO in hM4Di Tg mice. A, Locomotor activity was evaluated by measuring the distance moved by WT and hM4Di Tg mice administered vehicle or CNO before assessments (n = 6 per group). There was a significant main effect of CNO administration (F(1, 20) = 7.5, p < 0.05 by two-way ANOVA), but not genotype of animals (F(1, 20) = 2.34, p > 0.05 by two-way ANOVA). However, a significant interaction between these two parameters was observed (p < 0.01 by two-way ANOVA). Post hoc analysis revealed a significant decrease in locomotor activity in CNO-treated Tg mice compared with control Tg or CNO-treated WT mice (**p < 0.01, Bonferroni), but no significant difference was observed between control and CNO-treated WT mice (p > 0.05, Bonferroni). BE, Assessment of neuronal activity by ASL-MRI. Top and bottom demonstrate representative brain images at baseline and after administration of CNO, respectively, in WT (B) and hM4Di Tg (D) mice. Left and right represent coronal sections at −1.9 mm and −6.6 mm anterior to the bregma mainly containing the neocortex/hippocampus and cerebellum regions, respectively. Quantitative analyses of CNO-induced CBF changes in WT (n = 3) and hM4Di Tg (n = 5) mice are shown in C and E, respectively. In WT mice, there was a significant main effect of region (F(1, 24) = 22.91, p < 0.01 by two-way ANOVA) but not CNO treatment (F(1, 24) = 0.313, p > 0.05 by two-way ANOVA) on CBF measures. No interaction between these two parameters was found (p > 0.05 by two-way ANOVA) and post hoc analyses did not indicate any significant difference in CBF between baseline and CNO treatment (p > 0.05 by Bonferroni's test). In Tg mice, there were significant main effects of CNO administration (F(1, 24) = 9.70, p < 0.01 by two-way ANOVA) and region (F(2, 24) = 5.30, p < 0.05) on CBF measures. CBF was decreased significantly in the neocortex (CT) and hippocampus (Hip), but not in the cerebellum (CB), after CNO administration in hM4Di Tg mice (*p < 0.05, **p < 0.01, by Bonferroni's test for multiple comparisons after ANOVA, compared with baseline in corresponding regions), whereas CNO administration had no significant effect on CBF in any assayed regions in WT mice. Error bars indicate SE.
Figure 5.
Figure 5.
In vitro neuronal differentiation and functionality of hM4Di-iPSC-derived cells. A, Western blot analysis for hM4Di expression with a newly developed original antibody in undifferentiated iPSCs, EBs, and differentiated cells (1 d after seeding) from DsRed-iPSC (negative control) and hM4Di-iPSC. The blot is representative of 5 control and hM4Di Tg samples at each time point. B, Semiquantitative Western blot analysis of the hM4Di expression in hM4Di-iPSC-derived neuronal cells at different time points. hM4Di expression was detected quantitatively with our original antibody (normalized as a percentage of total signal density; n = 5 per group). There was a significant main effect of the time point on the hM4Di expression (F(2, 12) = 4.84, p < 0.05 by one-way ANOVA). Post hoc analysis revealed that hM4Di expression was significantly decreased at day 7 relative to day 1 (*p < 0.05, Bonferroni). A representative image of Western blotting is also displayed (bottom). CF, Bright-field microscopic observations at 0 (C) and 14 (D) days and two-channel fluorescence (E, F) after seeding of cells dissociated from iPSC-derived EBs on a MED64 Prove Dish. Nuclear staining (DAPI; cyan in E, F) and immunostaining of markers for neuronal cells (MAP2; red in E, NeuN; red in F) in neurosphere-like clusters of cells at 14 d demonstrated that the majority of these cells had differentiated to mature neurons. G, H, Representative electrographs showing neuronal firing of hM4Di-iPSC cells in a cluster at 14 d after seeding at baseline, after addition of CNO (1 μm), and after washout of CNO with CNO-free fresh medium (G). Quantitative analysis is shown in H (n = 5 in each group; F(2, 4) = 23.9, p < 0.01 by one-way, repeated-measures ANOVA; *p < 0.05 for the difference between baseline and CNO treatment and between CNO treatment and washout by post hoc Bonferroni's test). Spikes larger than a voltage threshold of 25 μV were counted. Error bars indicate SE. Scale bar, 150 μm (CF).
Figure 6.
Figure 6.
In vivo neural differentiation of DsRed-iPSC-derived cells at 20 d after implantation in adult mouse brain. AF, Two-channel photomicrographs of DsRed fluorescence (A, D, and red in C, F) and immunofluorescence staining of NeuN (B, E, and green in C, F) demonstrated that a significant portion of implanted cells had differentiated into mature neurons. In low-power images (AC), injected transplants were intensely clustered in the hippocampal hilus flanked by dentate granule cells (DG). High-power images (DF) illustrate the coexistence of DsRed(+) grafted iPSC-derived (arrowheads) and DsRed(−) endogenous (asterisks) neurons among NeuN(+) cells. There also existed NeuN(−), DsRed(+) large cell bodies originating from transplanted progenitors (DF, arrows), which could be either oligodendrocytes or undifferentiated species. GL, Two-channel photomicrographs of DsRed fluorescence (G, J, and red in I, L) and immunofluorescence staining of GFAP (H, K, and green in I, L) showing that a subset of implanted cells exhibited astrocytic phenotype (arrowheads). MO, Two-channel photomicrographs of DsRed fluorescence (M and red in O) and immunostaining of Iba1 (N and green in O) indicated that implanted cells were not able to differentiate into microglia. The images are representative of 5 mice. Scale bars: (AC, GI, MO, 100 μm; DF, JL, 20 μm.
Figure 7.
Figure 7.
Extension of axon-like processes from intracranially implanted DsRed-iPSC-derived EBs in adult mouse brain. Immunohistochemical analyses with an anti-DsRed antibody at low power showed that DsRed-iPSC-derived exogenous grafts were clustered in the implantation site without widespread migration at 20 d (A). High-power photomicrographs in areas enclosed with white dotted lines in contralateral (c1c3) and ispilateral (i1i3) subcortical white matter tracts are shown in separate images. The images are representative of 5 mice. Scale bar: A, 1 mm; c1c3, i1i3, 100 μm.
Figure 8.
Figure 8.
Neuronal differentiation of iPSC-derived cells captured by in vivo PET imaging of hM4Di with [11C]CNO. AE, Representative [11C]CNO-PET images of coronal mouse brain sections containing the neocortex and hippocampus at 20 d (B), 40 d (A, C), and 60 d (D) after intrahippocampal implantation of DsRed-iPSC-derived (A) or hM4Di-iPSC-derived (BD) neural cells. PET images were generated as in Figure 2. BD demonstrate time course images in the same individual mouse. Red arrows indicate the implantation site. Quantification of [11C]CNO retention estimated as a ratio of radioactivity in the implantation site to that in the contralateral corresponding area (ipsi-to-contra ratio) along the course after grafting is shown in E (n = 4–6 in each graft type). There were significant main effects of genotype of iPSC (F(1, 24) = 53.07, p < 0.01 by two-way ANOVA) and time (F(2, 24) = 21.27, p < 0.01) on the ratio. The accumulation of [11C]CNO in the hippocampus implanted with hM4Di-iPSC-derived cells was significantly increased at 40 and 60 d after implantation compared with the corresponding region implanted with DsRed-iPSC-derived cells (**p < 0.01 by Bonferroni's test for multiple comparisons after ANOVA). FN, hM4Di expression in exogenous iPSC-derived neural cells. The double-channel images illustrating immunostaining of H-175 (F) and DsRed fluorescence (G) in an individual mouse at 40 d after implantation of DsRed-iPSC-derived cells in the hippocampus exhibited no overt H-175 immunoreactivity in the DsRed-positive grafts. There was noticeable H-175 immunoreactivity in the hippocampus at 40 d after implantation of hM4Di-iPSC-derived cells (H). The insert in H demonstrates the immunoreactivity in the corresponding contralateral region. Double-immunostaining brain sections from the same individual with H-175 (I, L, and red in K and N) and antibody against a marker for mature neurons (NeuN; J and green in K) or astrocytes (GFAP; M and green in N) indicated that hM4Di was expressed in neurons, but not in astrocytes. Arrows in IK indicate relatively small neurons derived from grafts with H-175 immunolabeling in cell surface membrane and NeuN(+) cytoplasm, which may be less mature. In putatively well matured, large-sized neurons differentiated from grafted progenitors (IK, arrowheads), H-175 immunoreactivity was nearly fully translocated to neuritic processes and cell surface membranes surrounding NeuN(+) cytoplasm. The immunohistochemical images are representative of 5 mice in each implantation group. Error bars represent SE. Scale bars: FH, 60 μm; insert in H, 200 μm; IN, 20 μm.
Figure 9.
Figure 9.
In vivo imaging assessments of the functionality of hM4Di-iPSC-derived neuronal grafts. AD, Representative postmortem microscopic (A) and antemortem T2-weighted (B) and ASL (C, D) MRI images of an adult mouse brain at 40 d after implantation of hM4Di-iPSC-derived grafts. A low-power photomicrograph illustrates immunolabeling of endogenous and graft-derived M4 mAChRs with H-175 (A). Red and white arrows indicate the ipsilateral hippocampal CA1 sector and hilus, respectively. This mouse underwent repeated ASL-MRI at 40, 46, and 52 d after implantation. Scale bar indicates CBF measures in C and D. E, Quantitative assays of CNO-induced CBF changes in hippocampal CA1 and CA3 sectors. Data are displayed in boxplots. The bottom and top of rectangles indicate the first and third quartiles, respectively. A horizontal line inside the rectangles shows the median and the “whiskers” above and below the rectangles express the maximum and minimum values, respectively. Quantitative analysis of these three assays demonstrated that CBF was decreased significantly in the implantation site (hilus/CA3), as well as the ipsilateral CA1 sector, in response to CNO (n = 3, t = 15.808 and t = 4.635 for CA1 and hilus/CA3, respectively, *p < 0.05, **p < 0.01, by paired t test, versus the corresponding contralateral regions). The brain of this mouse was collected after the last MRI scan for postmortem analysis. F, G, H-175 immunoreactivity in the hippocampal hilus (F) implanted with hM4Di-iPSC-derived cells, in sharp contrast with the absence of detectable signals in the contralateral hilar region (G). Immunofluorescence signals in the dentate gyrus (DG) were primarily derived from expression of endogenous M4 mAChR. Ipsi, Ipsilateral; Contra, contralateral. Scale bar, 100 μm (F, G).

References

    1. Abematsu M, Tsujimura K, Yamano M, Saito M, Kohno K, Kohyama J, Namihira M, Komiya S, Nakashima K. Neurons derived from transplanted neural stem cells restore disrupted neuronal circuitry in a mouse model of spinal cord injury. J Clin Invest. 2010;120:3255–3266. doi: 10.1172/JCI42957. - DOI - PMC - PubMed
    1. Alexander GM, Rogan SC, Abbas AI, Armbruster BN, Pei Y, Allen JA, Nonneman RJ, Hartmann J, Moy SS, Nicolelis MA, McNamara JO, Roth BL. Remote control of neuronal activity in transgenic mice expressing evolved G protein-coupled receptors. Neuron. 2009;63:27–39. doi: 10.1016/j.neuron.2009.06.014. - DOI - PMC - PubMed
    1. Armbruster BN, Li X, Pausch MH, Herlitze S, Roth BL. Evolving the lock to fit the key to create a family of G protein-coupled receptors potently activated by an inert ligand. Proc Natl Acad Sci U S A. 2007;104:5163–5168. doi: 10.1073/pnas.0700293104. - DOI - PMC - PubMed
    1. Bender D, Holschbach M, Stöcklin G. Synthesis of n.c.a. carbon-11 labelled clozapine and its major metabolite clozapine-N-oxide and comparison of their biodistribution in mice. Nucl Med Biol. 1994;21:921–925. doi: 10.1016/0969-8051(94)90080-9. - DOI - PubMed
    1. Conklin BR, Hsiao EC, Claeysen S, Dumuis A, Srinivasan S, Forsayeth JR, Guettier JM, Chang WC, Pei Y, McCarthy KD, Nissenson RA, Wess J, Bockaert J, Roth BL. Engineering GPCR signaling pathways with RASSLs. Nat Methods. 2008;5:673–678. doi: 10.1038/nmeth.1232. - DOI - PMC - PubMed

Publication types

MeSH terms