. 2016 Dec 6;113(49):14133-14138.
doi: 10.1073/pnas.1601513113. Epub 2016 Nov 22.

Optical magnetic detection of single-neuron action potentials using quantum defects in diamond

Affiliations

Optical magnetic detection of single-neuron action potentials using quantum defects in diamond

John F Barry et al. Proc Natl Acad Sci U S A. .

Erratum in

Abstract

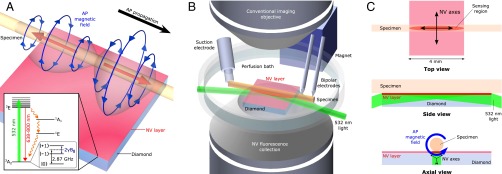
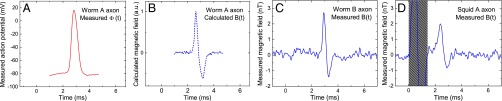
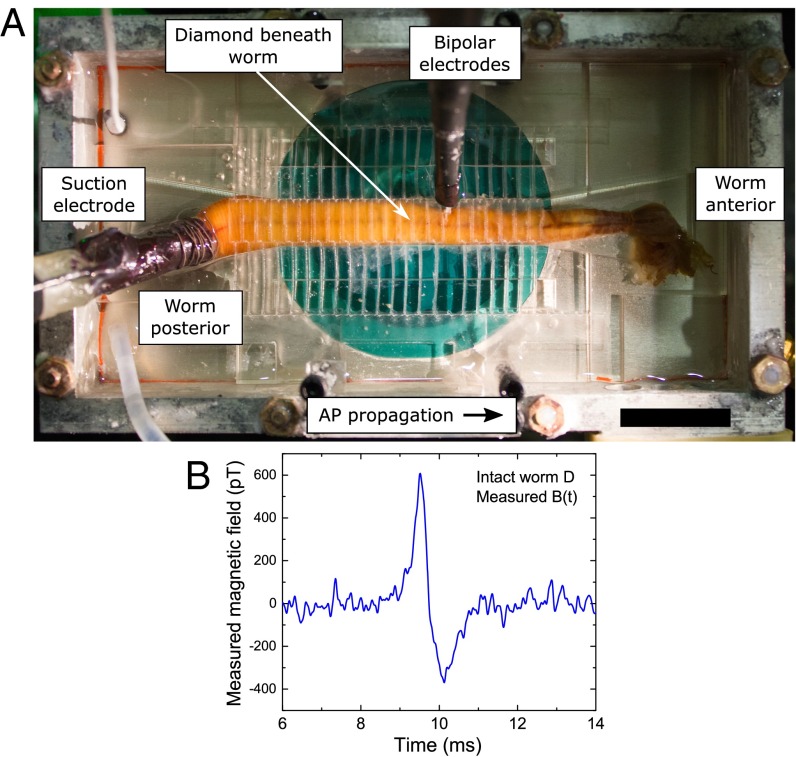
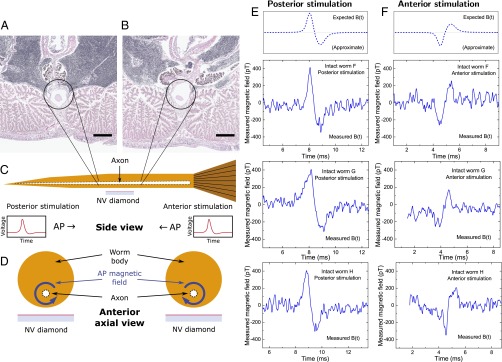
Magnetic fields from neuronal action potentials (APs) pass largely unperturbed through biological tissue, allowing magnetic measurements of AP dynamics to be performed extracellularly or even outside intact organisms. To date, however, magnetic techniques for sensing neuronal activity have either operated at the macroscale with coarse spatial and/or temporal resolution-e.g., magnetic resonance imaging methods and magnetoencephalography-or been restricted to biophysics studies of excised neurons probed with cryogenic or bulky detectors that do not provide single-neuron spatial resolution and are not scalable to functional networks or intact organisms. Here, we show that AP magnetic sensing can be realized with both single-neuron sensitivity and intact organism applicability using optically probed nitrogen-vacancy (NV) quantum defects in diamond, operated under ambient conditions and with the NV diamond sensor in close proximity (∼10 µm) to the biological sample. We demonstrate this method for excised single neurons from marine worm and squid, and then exterior to intact, optically opaque marine worms for extended periods and with no observed adverse effect on the animal. NV diamond magnetometry is noninvasive and label-free and does not cause photodamage. The method provides precise measurement of AP waveforms from individual neurons, as well as magnetic field correlates of the AP conduction velocity, and directly determines the AP propagation direction through the inherent sensitivity of NVs to the associated AP magnetic field vector.

Keywords: action potential; magnetometry; neuron; nitrogen-vacancy center.


Conflict of interest statement

The authors declare no conflict of interest.

Figures

Fig. 1.
Fig. 1.
Experimental overview. (A) Schematic image depicting bipolar azimuthal magnetic field associated with AP propagating from left to right. Red arrows indicate axial current through axon, and blue arrows depict associated magnetic field. Magnetic field projection is detected by 13-μm-thick NV layer on diamond substrate. (Inset) NV center energy level diagram; see SI Appendix for details. (B) Custom-built microscope allows simultaneous magnetic sensing and conventional imaging of specimens. NV centers are excited by 532-nm laser light oriented at grazing incidence to diamond top surface. Inverted aspheric condenser objective collects NV LIF. Magnet applies a uniform 7-G bias field to the diamond. Specimens are placed on top of diamond, and individual APs are stimulated by suction electrode and detected downstream via a pair of bipolar recording electrodes. For clarity, wire loop for MW delivery and axon clamp are not shown. (C) Top, side, and axial views of NV diamond sensor and specimen. Top view shows sensing region from which LIF is collected, as well as top-down projection of the four crystallographic NV axes. AP magnetic field projects onto two NV axes perpendicular to specimen axis. Side view shows 532-nm laser light entering diamond at grazing angle and exciting NV layer. Blue arrow in axial view depicts AP magnetic field; black arrows depict NV axes in sensing region.
Fig. 2.
Fig. 2.
Measured AP voltage and magnetic field from excised single neurons. (A) Measured time trace of AP voltage Φinmeas(t) for giant axon from M. infundibulum (worm). (B) Calculated time trace of AP magnetic field Bcalc(t) for M. infundibulum extracted from data in A. (C) Measured time trace of AP magnetic field Bmeas(t) for M. infundibulum giant axon with Navg = 600. (D) Measured time trace of AP magnetic field Bmeas(t) for L. pealeii (squid) giant axon with Navg = 375. Gray box indicates magnetic artifact from stimulation current.
Fig. 3.
Fig. 3.
Single-neuron AP magnetic sensing exterior to live, intact organism. (A) Overhead view of intact living specimen of M. infundibulum (worm) on top of NV diamond sensor. In configuration shown, animal is stimulated from posterior end by suction electrode, APs propagate toward worm’s anterior end, and bipolar electrodes confirm AP stimulation and propagation. (Scale bar, 20 mm.) (B) Recorded time trace of single-neuron AP magnetic field Bmeas(t) from live intact specimen of M. infundibulum for Navg = 1,650 events.
Fig. 4.
Fig. 4.
Single-channel magnetic sensing of AP propagation exterior to live, intact organism. Transverse sections of M. infundibulum near midpoint of worm illustrate giant axon radius tapering from (A) smaller near posterior to (B) larger near anterior. Sections were taken 1 cm apart. Encircled white structure is giant axon. (Scale bars, 400 μm.) (C) Cartoon cross-section side view of live, intact worm and NV diamond sensor. Black dashed lines indicate tapered giant axon. Cartoon time traces of AP voltage indicate they are typically qualitatively indistinguishable for posterior stimulation (right-propagating AP) and anterior stimulation (left-propagating AP). (D) Cartoon cross-section axial view looking from anterior end. Blue arrows encircling axon indicate opposite azimuthal AP magnetic field vectors for oppositely propagating APs. (E) (Top) Expected AP magnetic field time trace for posterior AP stimulation of M. infundibulum, indicating effect of AP propagation direction and conduction velocity on sign of bipolar magnetic field waveform and magnetic field amplitude. (Bottom) Recorded time trace of AP magnetic field Bmeas(t) from three live intact specimens of M. infundibulum for posterior stimulation and Navg = 1,650 events each. (F) (Top) Expected AP magnetic field time trace for anterior worm stimulation. (Bottom) Recorded time trace of AP magnetic field Bmeas(t) from same three intact live specimens of M. infundibulum as in E for anterior stimulation and Navg = 1,650 events each. Note that the observed sign of Bmeas(t) is reversed depending on AP propagation direction, and the average ratio of the magnetic signal amplitude of posterior-stimulated APs (Bp) and anterior-stimulated APs (Ba) from the three specimens shown (worms F, G, and H) is Bp/Ba = 1.41 ± 0.22 (mean ± SD for three samples, each with Navg = 1,650), consistent with two-point electrophysiology measurements of lower AP conduction velocity for posterior stimulation (see SI Appendix and Fig. S2).

References

    1. Arai K, et al. Fourier magnetic imaging with nanoscale resolution and compressed sensing speed-up using electronic spins in diamond. Nat Nanotechnol. 2015;10(10):859–864. - PubMed
    1. Doherty MW, et al. The nitrogen-vacancy colour centre in diamond. Phys Rep. 2013;528(1):1–45.
    1. Fu RR, et al. Paleomagnetism. Solar nebula magnetic fields recorded in the Semarkona meteorite. Science. 2014;346(6213):1089–1092. - PubMed
    1. Kucsko G, et al. Nanometre-scale thermometry in a living cell. Nature. 2013;500(7460):54–58. - PMC - PubMed
    1. Le Sage D, et al. Optical magnetic imaging of living cells. Nature. 2013;496(7446):486–489. - PMC - PubMed

Publication types