Comparative Study
. 2016 Dec 13;113(50):E8096-E8105.
doi: 10.1073/pnas.1608828113. Epub 2016 Nov 28.

Selective sweep suggests transcriptional regulation may underlie Plasmodium vivax resilience to malaria control measures in Cambodia

Affiliations
Comparative Study

Selective sweep suggests transcriptional regulation may underlie Plasmodium vivax resilience to malaria control measures in Cambodia

Christian M Parobek et al. Proc Natl Acad Sci U S A. .

Abstract

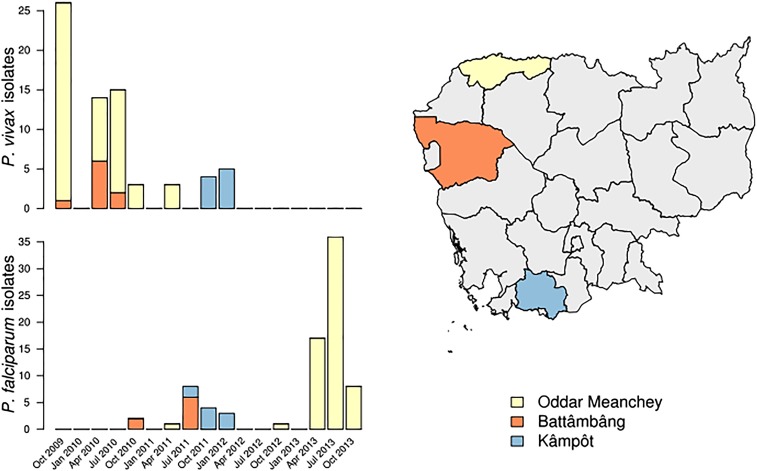
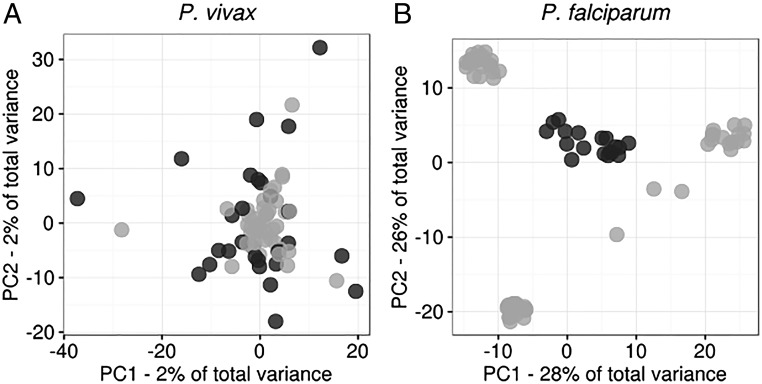
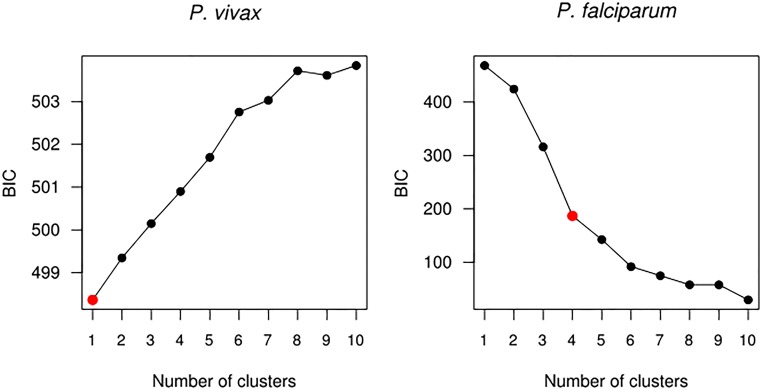
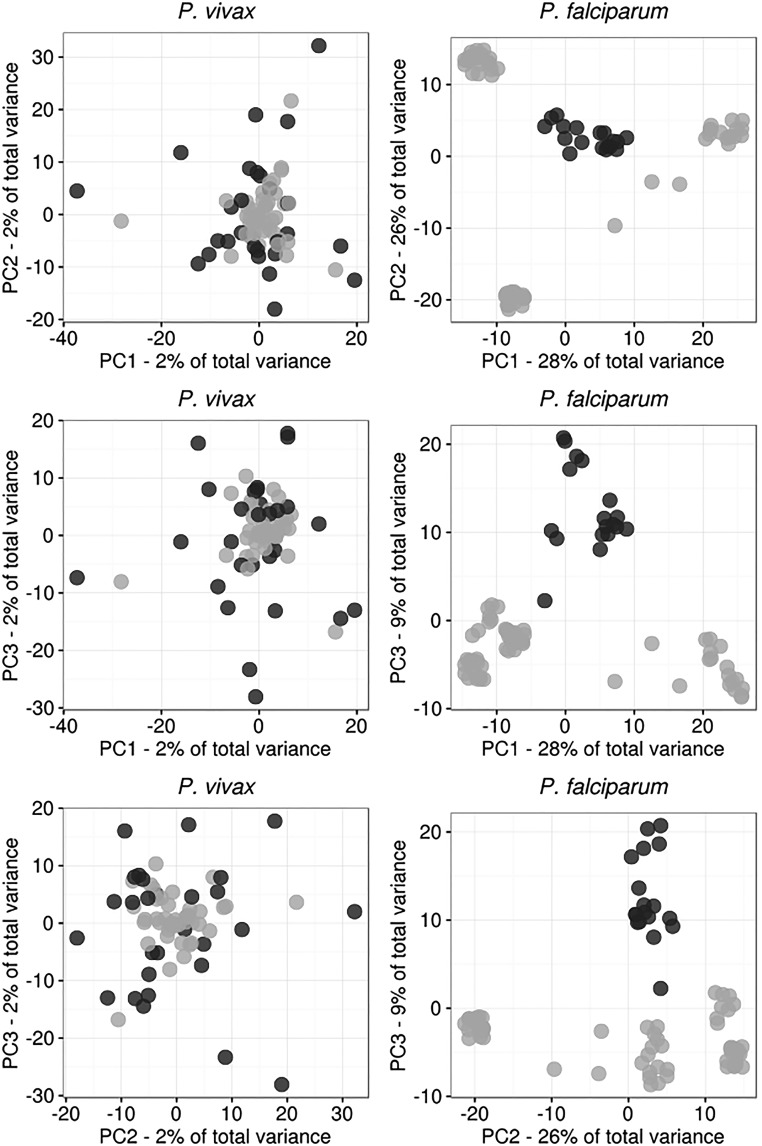
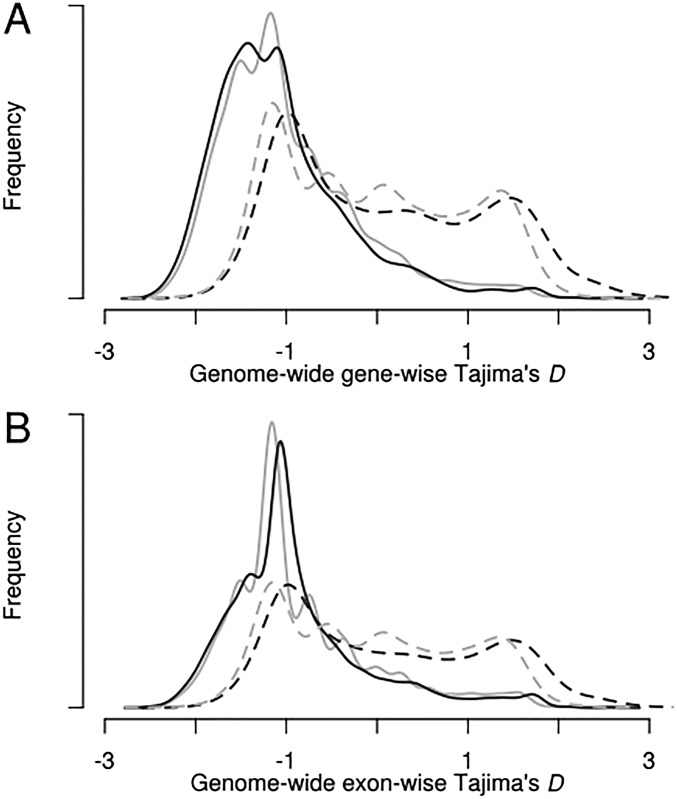
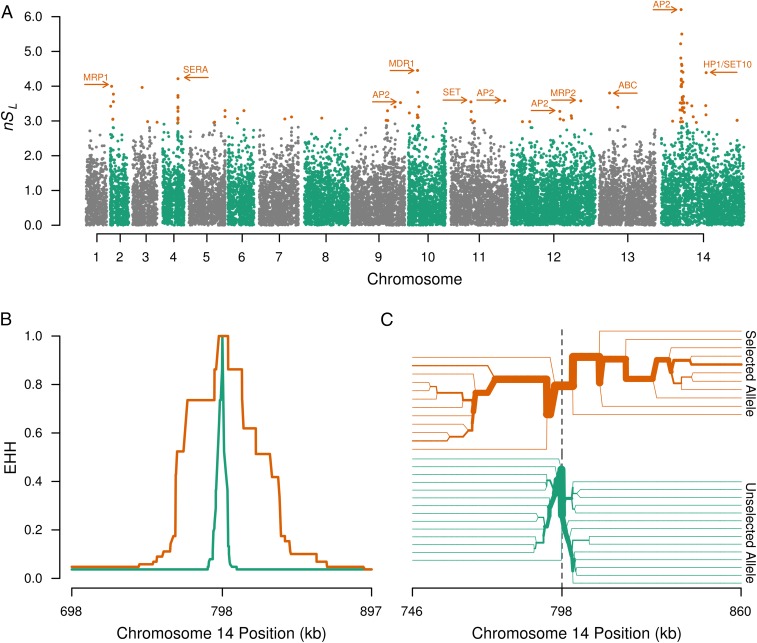
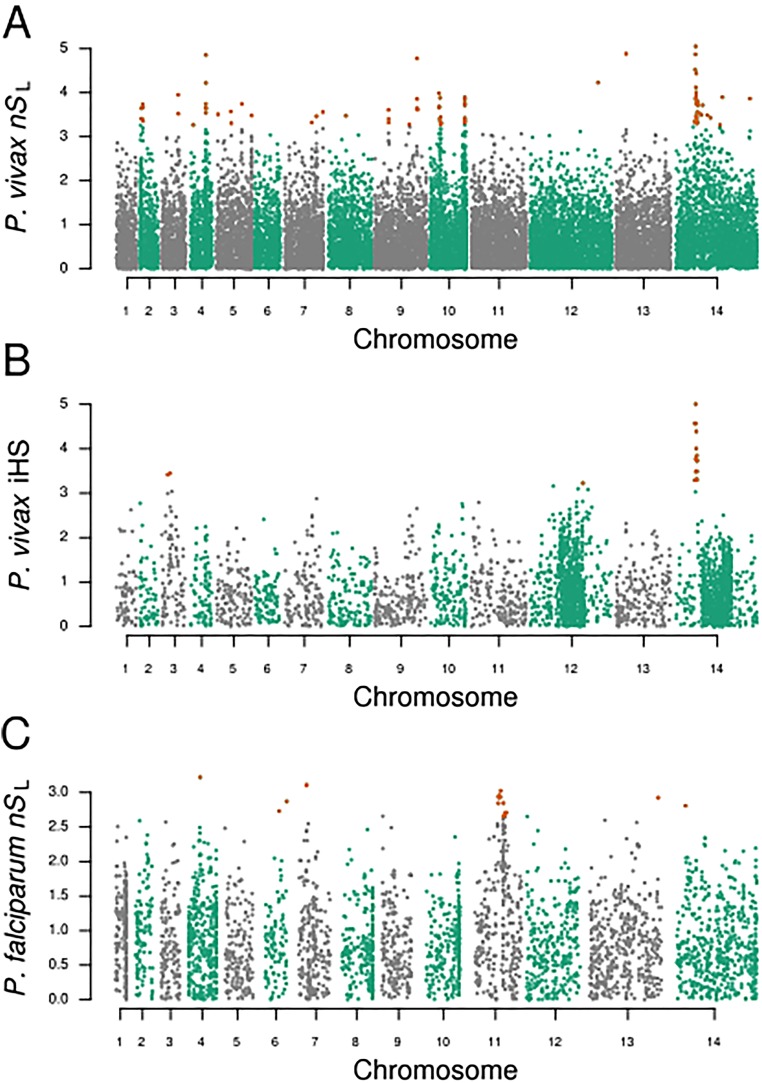
Cambodia, in which both Plasmodium vivax and Plasmodium falciparum are endemic, has been the focus of numerous malaria-control interventions, resulting in a marked decline in overall malaria incidence. Despite this decline, the number of P vivax cases has actually increased. To understand better the factors underlying this resilience, we compared the genetic responses of the two species to recent selective pressures. We sequenced and studied the genomes of 70 P vivax and 80 P falciparum isolates collected between 2009 and 2013. We found that although P falciparum has undergone population fracturing, the coendemic P vivax population has grown undisrupted, resulting in a larger effective population size, no discernable population structure, and frequent multiclonal infections. Signatures of selection suggest recent, species-specific evolutionary differences. Particularly, in contrast to P falciparum, P vivax transcription factors, chromatin modifiers, and histone deacetylases have undergone strong directional selection, including a particularly strong selective sweep at an AP2 transcription factor. Together, our findings point to different population-level adaptive mechanisms used by P vivax and P falciparum parasites. Although population substructuring in P falciparum has resulted in clonal outgrowths of resistant parasites, P vivax may use a nuanced transcriptional regulatory approach to population maintenance, enabling it to preserve a larger, more diverse population better suited to facing selective threats. We conclude that transcriptional control may underlie P vivax's resilience to malaria control measures. Novel strategies to target such processes are likely required to eradicate P vivax and achieve malaria elimination.

Keywords: Plasmodium; genome; malaria; transcription; vivax.


Conflict of interest statement

The authors declare no conflict of interest.

Figures

Fig. S1.
Fig. S1.
Collection dates and locations for samples included in this study. (Left) All P. vivax (Upper) and P. falciparum (Lower) clinical isolates were collected between October 2009 and October 2013, with P. vivax isolates collected, on average, earlier than P. falciparum isolates. (Right) P. vivax and P. falciparum isolates were collected from three unique provinces within Cambodia.
Fig. 1.
Fig. 1.
Higher MOI in P. vivax infections compared with P. falciparum infections. (A) FWS calculated for P. vivax and P. falciparum. Points represent the point estimate of FWS for each sample in the respective population. Vertical bars represent the maximum and minimum value in 1,000 bootstrap replicates, which downsampled the number of SNPs to be equal for P. vivax and P. falciparum, to correct for the increased number of P. vivax SNPs. (B) Summary bar graph representing the number of P. vivax (Pv) and P. falciparum (Pf) clinical isolates considered monoclonal or polyclonal, with a cutoff of FWS <0.95 being considered polyclonal.
Fig. 2.
Fig. 2.
PCA reveals striking differences in population structure between Cambodian P. vivax and P. falciparum. PCA was performed from single-nucleotide genetic variant data for each of 70 P. vivax clinical isolates (A) and 80 P. falciparum clinical isolates (B). Monoclonal P. vivax isolates are shaded dark gray. Among P. falciparum isolates, members of the ancestral-like population are shaded dark gray. Noise was added to the P. falciparum panel to mitigate overplotting.
Fig. S2.
Fig. S2.
Nonparametric k-means clustering of total genetic diversity in P. vivax and P. falciparum isolates identifies distinct subpopulations among P. falciparum but not among P. vivax. For P. vivax, clustering suggests that all parasites are drawn from the same population. For P. falciparum, increasing the number of clusters from n = 3 to n = 4 yields a substantial improvement in Bayesian information criterion (BIC). Although subsequent increases do yield BIC improvements, the improvement in goodness of fit is not commensurate with the cost associated with increased degrees of freedom.
Fig. S3.
Fig. S3.
Additional projections of P. vivax and P. falciparum genetic differentiation. Additional projections for the top three principal components are shown for the P. vivax (Left) and P. falciparum (Right) populations. Noise was added to the P. falciparum dataset to mitigate overplotting.
Fig. 3.
Fig. 3.
Allele-frequency spectra suggest greater population expansion among P. vivax than among P. falciparum. Each column indicates the fraction of the total SNPs that fall into a particular frequency class. Columns are color coded by type of SNP. The x axis represents the number of samples within which each SNP occurs. (Upper) We observed a preponderance of low-frequency alleles in the P. vivax population, compared with coalescent simulations of a no-growth population (black line). Under a Wright–Fisher model of genetic evolution, these data suggest that the P. vivax population has undergone a recent expansion. (Lower) In contrast, for P. falciparum, we observed an excess in intermediate-frequency minor alleles, reflecting the subdivided population structure.
Fig. S4.
Fig. S4.
AFS for P. vivax monoclonal isolates and the P. falciparum ancestral population. Similar to the entire P. vivax population, the P. vivax monoclonal isolates have a strong overrepresentation of low-frequency alleles, suggesting an expanding population size. When considered in isolation, the P. falciparum ancestral population shows no increase in intermediate-frequency alleles.
Fig. 4.
Fig. 4.
Five one-population models were used for demographic inference. The following models were fitted to observed P. vivax and P. falciparum allele-frequency spectra using a diffusion approximation of population evolution: (A) a model of no change in Neff through time; (B) a model of population decline beginning at time T; (C) a model of exponential population expansion, beginning at time T; (D) a two-epoch model of sudden population expansion at time T; (E) a model of rapid population decline followed by exponential growth, beginning at time T. In all cases, the exponential-growth model (C) was at least marginally the best fit scenario. For the P. vivax population, growth models (CE) far outperformed the static (A) or decline (B) models. See Tables S1 and S2.
Fig. S5.
Fig. S5.
Observed and simulated distributions of population summary statistics. Observed (orange) and simulated (green) Tajima’s D values for the ancestral P. falciparum population (Pf_cp2), the monoclonal P. vivax clinical isolates (Pv_Mono), and all P. vivax isolates (Pv_All). Modeling parameters were inferred from one-model best-fit demographic scenarios.
Fig. S6.
Fig. S6.
Observed genewise and exonwise Tajima’s D distributions for P. vivax and P. falciparum. (A) Whole-genome genewise Tajima’s D was calculated for the entire P. vivax isolate set (n = 70; solid gray line), the monoclonal P. vivax isolates (n = 28; solid black line), the entire P. falciparum isolate set (n = 80; dashed black line), and the ancestral P. falciparum subpopulation (n = 18; dashed gray line). Distributions of whole and subset datasets for both species show close correlation, providing evidence that subsetting these genetic data does not bias allele frequencies. (B) Distributions of exonwise Tajima’s D demonstrate characteristics similar to the genewise analysis.
Fig. 5.
Fig. 5.
Evidence for strong selective sweeps in Cambodian P. vivax. (A) A Manhattan plot of normalized nSL values. Each point corresponds to an SNP, and the top 0.5% values (under strong directional selection) are rendered in orange. Polymorphisms without evidence of strong directional selection are rendered in either gray or green, according to chromosome. This view suggests that several genomic regions are under positive selection, including areas near transcription factors (AP2 domain-containing), chromatin regulators (SET10 and HP1), antigens under known positive selection (SERA4 and 5), and drug-resistance genes (MDR1 and MRP1). (B and C) The extent of EHH in the strongest sweep, within chromosome 14 in A. (B) EHH decay for the haplotypes around selected (orange) and unselected (green) alleles. (C) A haplotype bifurcation diagram is shown centered on the focal variant. Line thickness represents the number of identical haplotypes flanking the selected (orange) or unselected (green) alleles. Linkage breaks down with increasing distance from the focal variant. B and C provide evidence that the strong sweep on chromosome 14 extends ∼50 kb in each direction.
Fig. S7.
Fig. S7.
Additional haplotype-based tests of selection confirm the identity of different types of loci under selection in P. vivax and P. falciparum. In each panel, all points correspond to normalized nSL or iHS values, with the 0.5% highlighted. (A) The haplotype-based selection statistic nSL was determined for all P. vivax cases (n = 70) (i.e., including multiclonal infections). Because of haplotype-based tests rely on single-clone haplotypes for selection, this analysis is secondary to the monoinfection-based analysis presented in the main text. Nonetheless, the results of this analysis are largely similar to the monoinfection-based analysis. (B) The iHS was calculated for P. vivax monoinfections (n = 28). This analysis identified the same chromosome 14 linkage group as being under strong directional selection. Because iHS depends on a genetic map, and because a curated genetic map of the P. vivax Sal1 genome is not available at present, this analysis was secondary to the nSL test, which is a map-free statistic. (C) The haplotype-based selection statistic nSL was also determined for the ancestral P. falciparum cases (n = 18), revealing several loci under strong directional selection, including crt, ama1, and kelch K13 (Table 3).

References

    1. Spring MD, et al. Dihydroartemisinin-piperaquine failure associated with a triple mutant including kelch13 C580Y in Cambodia: An observational cohort study. Lancet Infect Dis. 2015;15(6):683–691. - PubMed
    1. Dondorp AM, et al. Artemisinin resistance in Plasmodium falciparum malaria. N Engl J Med. 2009;361(5):455–467. - PMC - PubMed
    1. Zhou G, et al. Spatio-temporal distribution of Plasmodium falciparum and p. Vivax malaria in Thailand. Am J Trop Med Hyg. 2005;72(3):256–262. - PubMed
    1. Cui L, et al. Malaria in the Greater Mekong subregion: Heterogeneity and complexity. Acta Trop. 2012;121(3):227–239. - PMC - PubMed
    1. Wangroongsarb P, Sudathip P, Satimai W. Characteristics and malaria prevalence of migrant populations in malaria-endemic areas along the Thai-Cambodian border. Southeast Asian J Trop Med Public Health. 2012;43(2):261–269. - PubMed

Publication types

MeSH terms

LinkOut - more resources