. 2016 Dec 13;113(50):E8122-E8130.
doi: 10.1073/pnas.1613316113. Epub 2016 Nov 29.

Permissive roles of cytokines interleukin-7 and Flt3 ligand in mouse B-cell lineage commitment

Affiliations

Permissive roles of cytokines interleukin-7 and Flt3 ligand in mouse B-cell lineage commitment

Lilly von Muenchow et al. Proc Natl Acad Sci U S A. .

Abstract

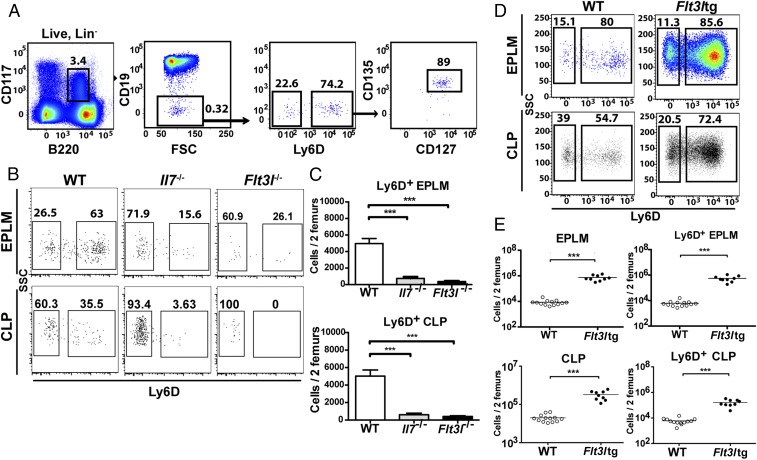
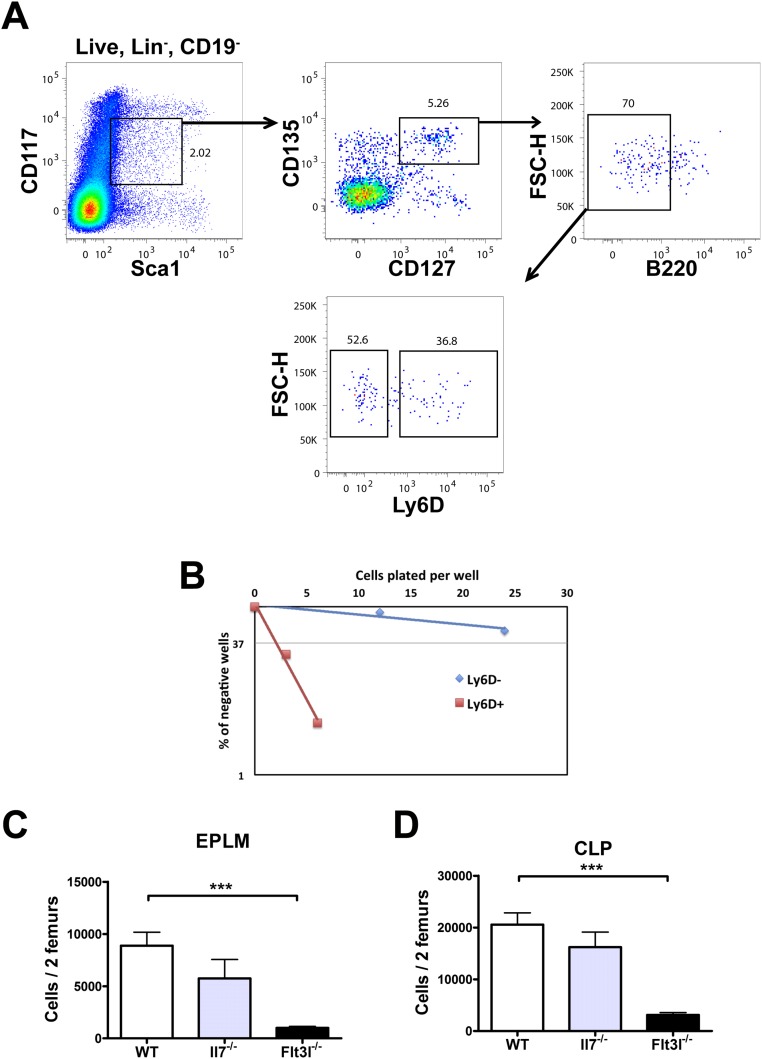
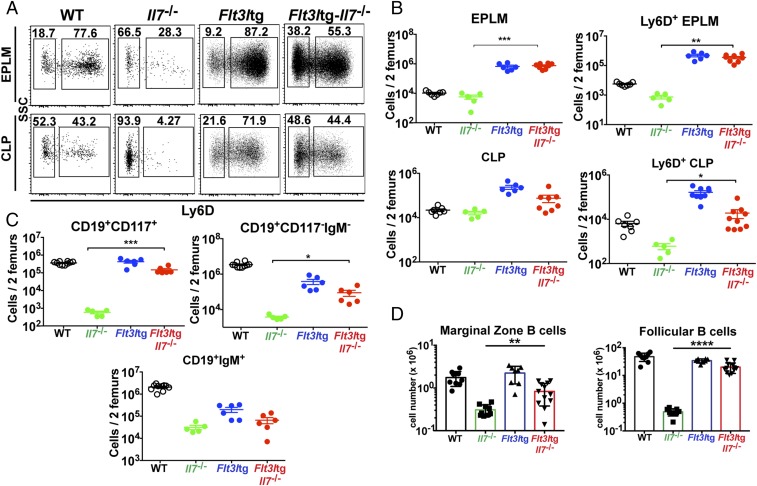
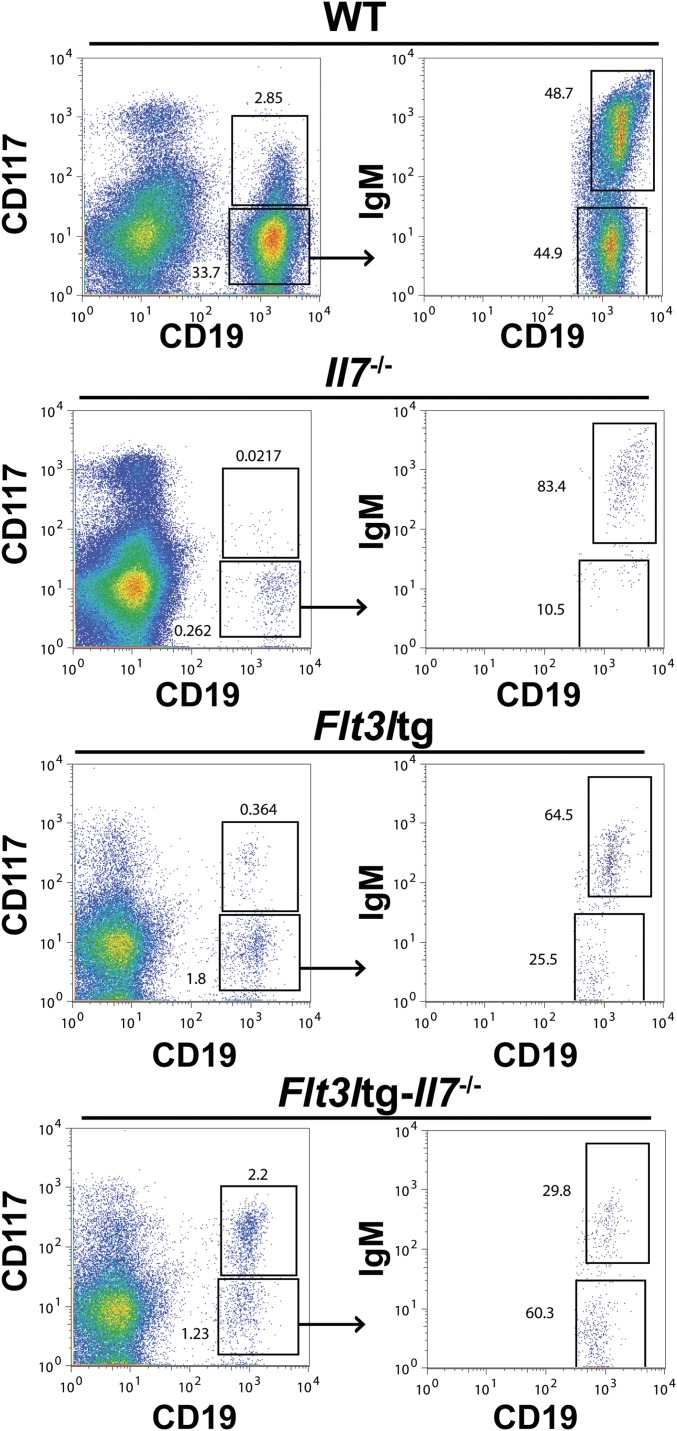
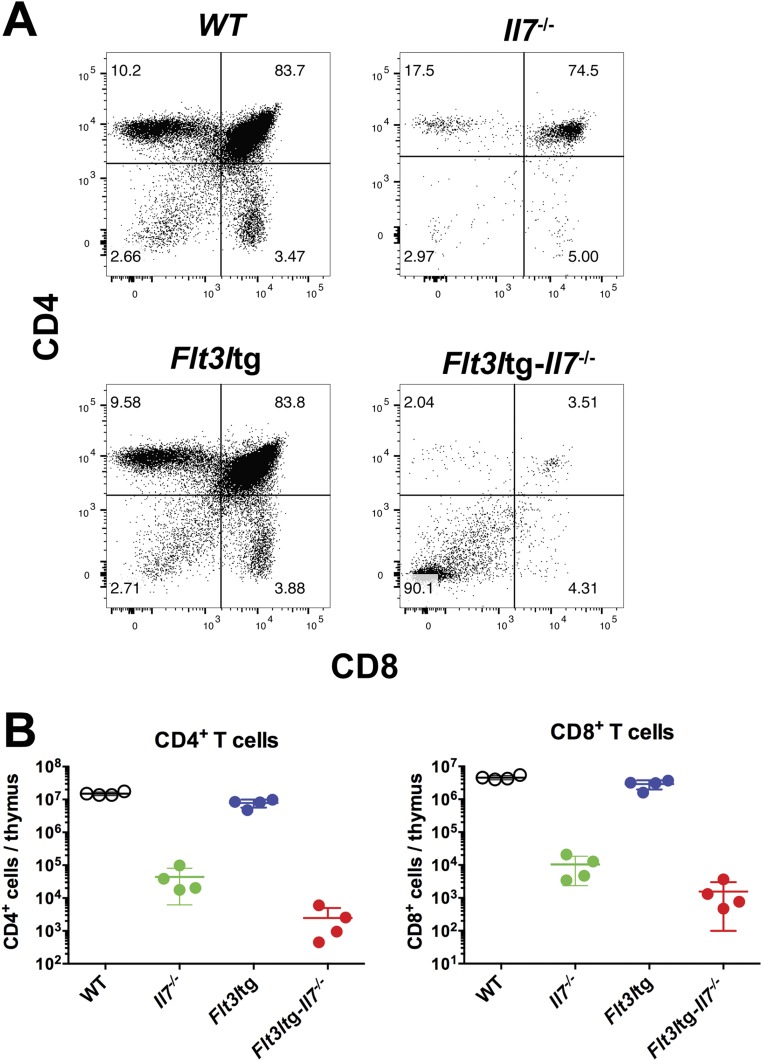
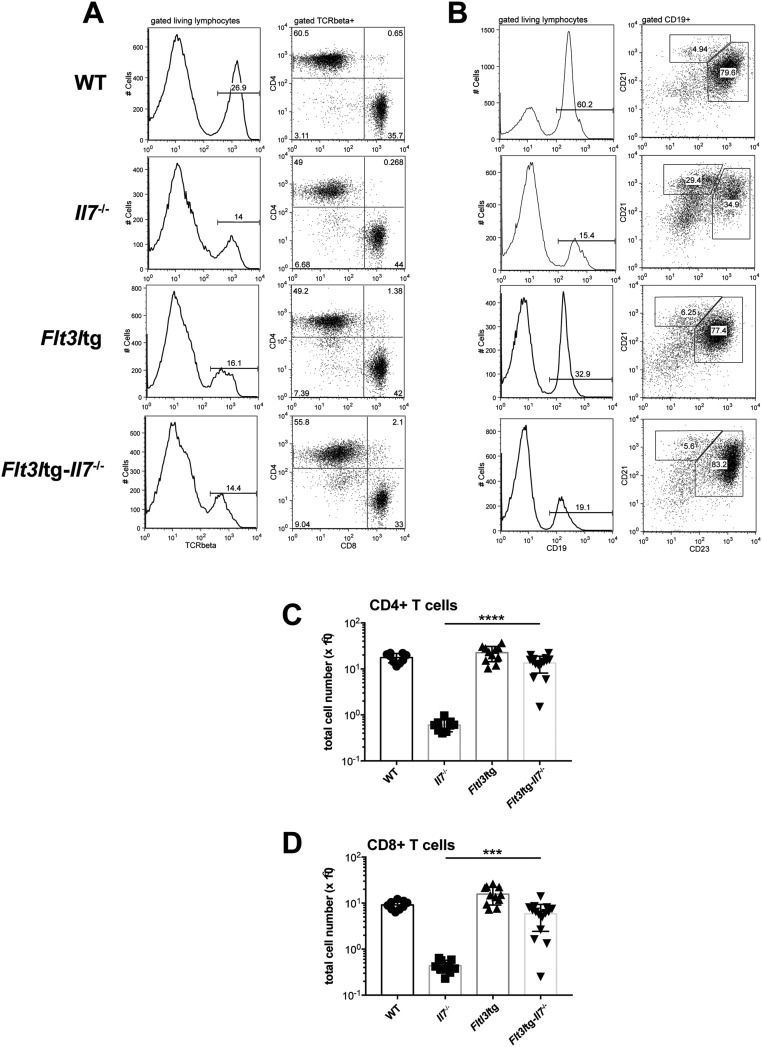
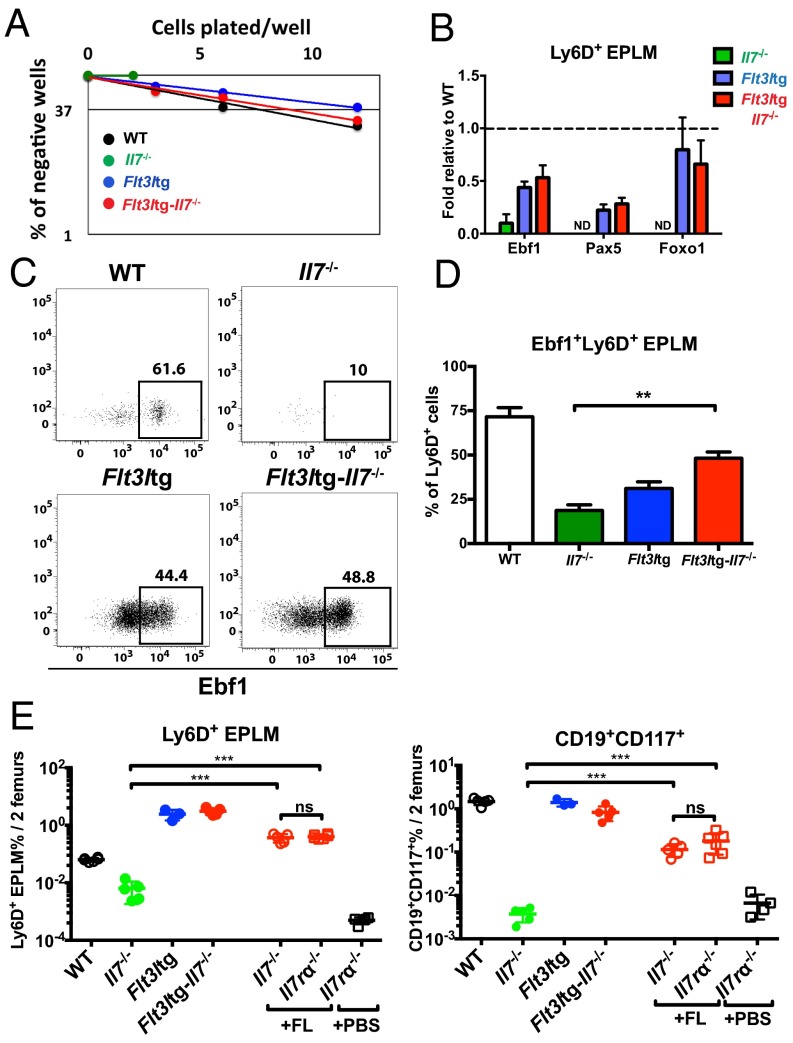
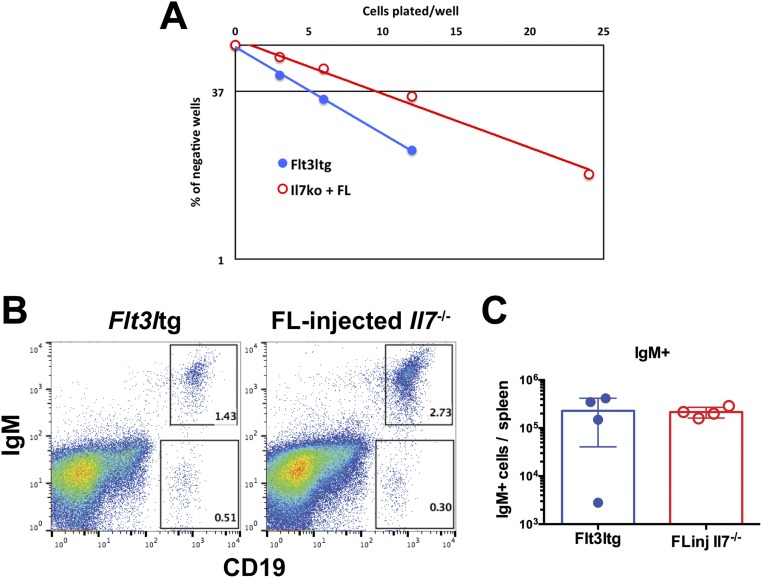
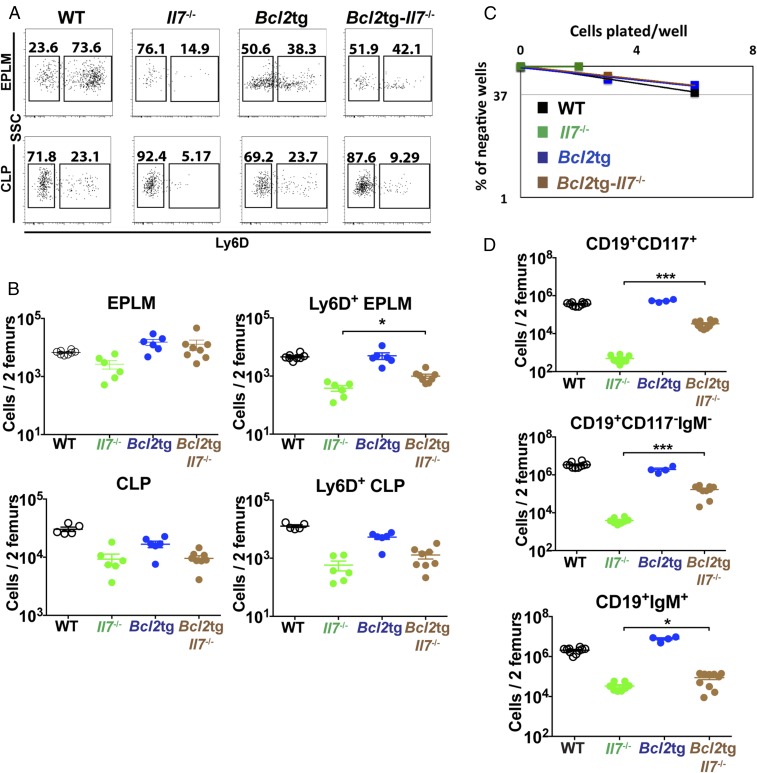
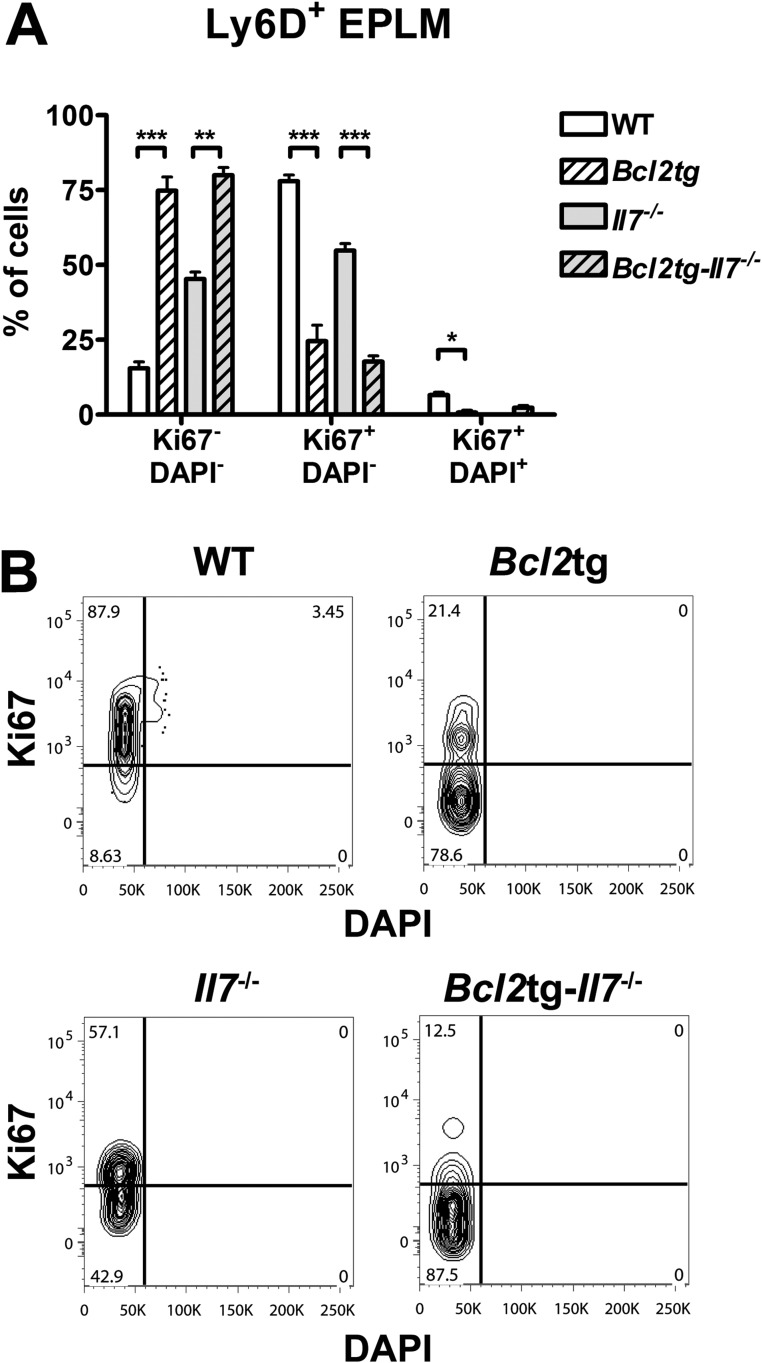
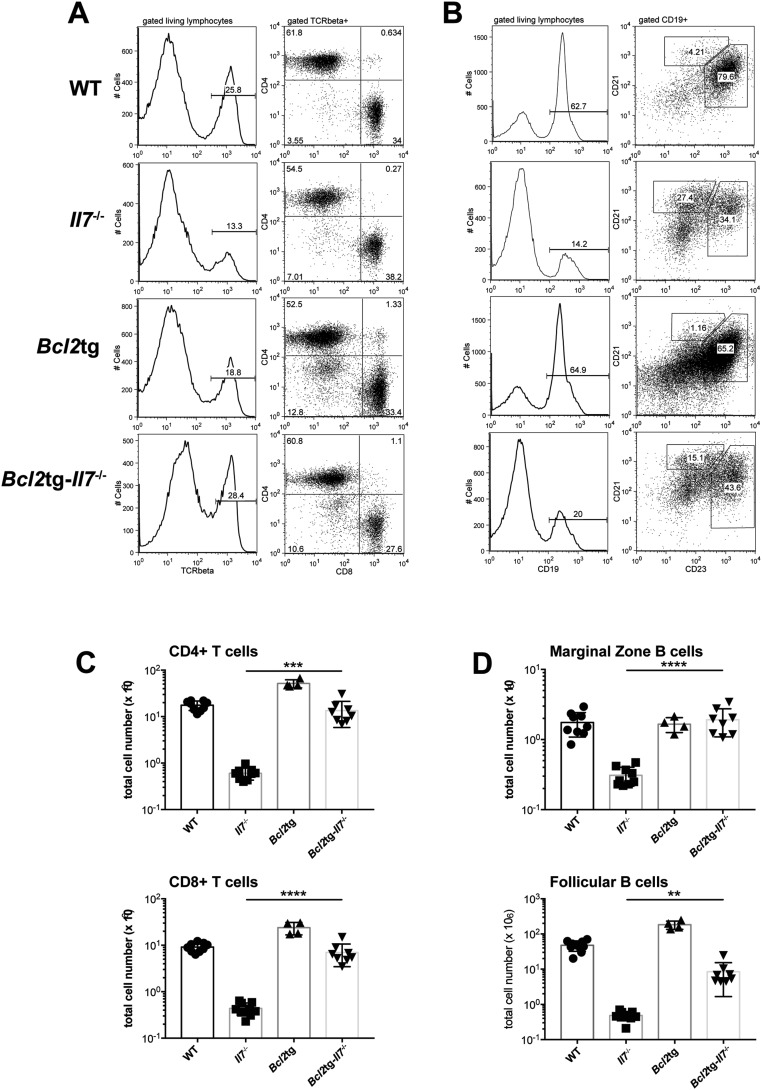
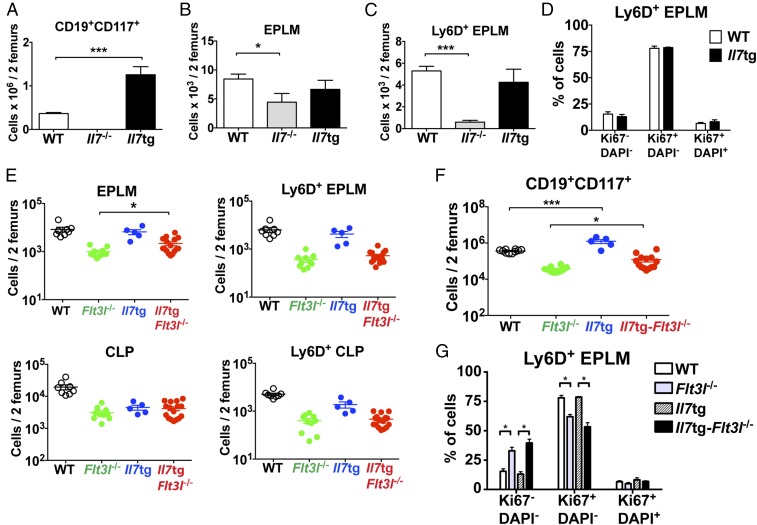
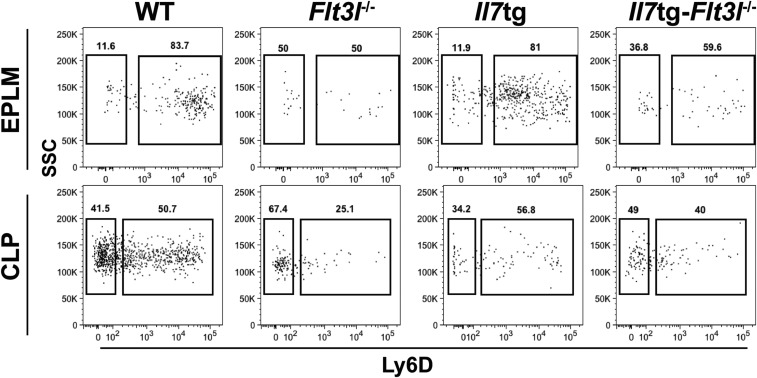
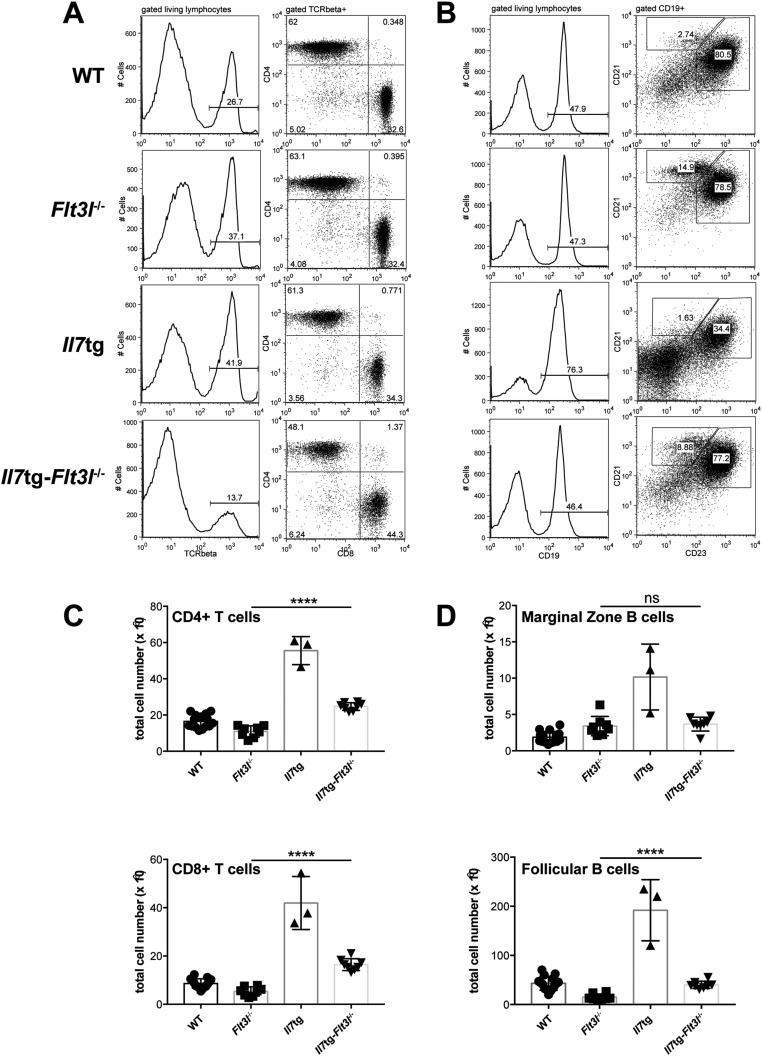
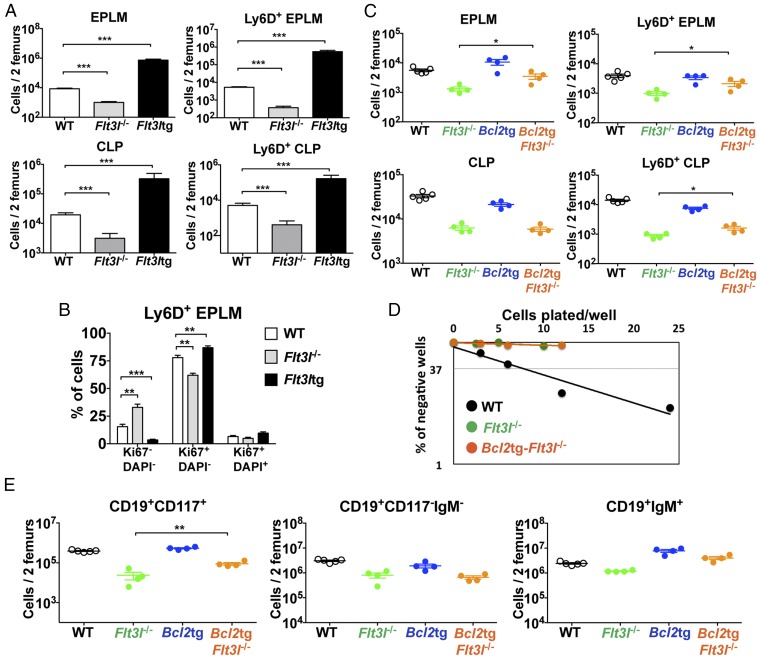
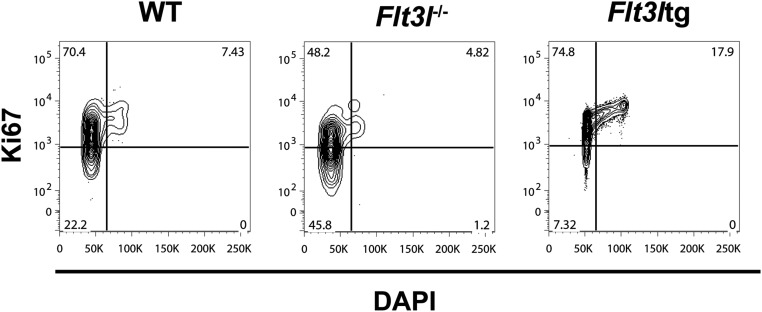
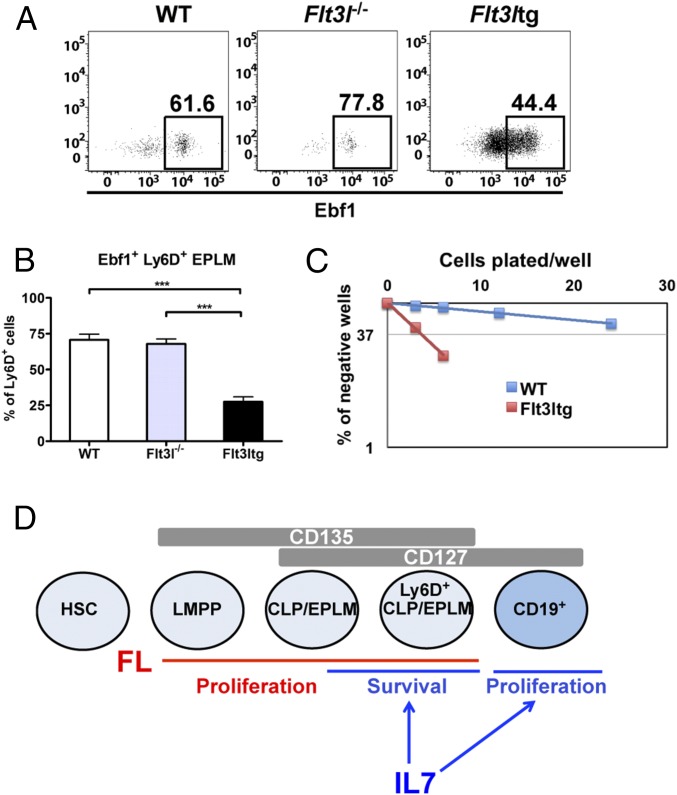
Hematopoietic cells are continuously generated throughout life from hematopoietic stem cells, thus making hematopoiesis a favorable system to study developmental cell lineage commitment. The main factors incorporating environmental signals to developing hematopoietic cells are cytokines, which regulate commitment of hematopoietic progenitors to the different blood lineages by acting either in an instructive or a permissive manner. Fms-like tyrosine kinase-3 (Flt3) ligand (FL) and Interleukin-7 (IL-7) are cytokines pivotal for B-cell development, as manifested by the severely compromised B-cell development in their absence. However, their precise role in regulating B-cell commitment has been the subject of debate. In the present study we assessed the rescue of B-cell commitment in mice lacking IL-7 but simultaneously overexpressing FL. Results obtained demonstrate that FL overexpression in IL-7-deficient mice rescues B-cell commitment, resulting in significant Ebf1 and Pax5 expression in Ly6D+CD135+CD127+CD19- precursors and subsequent generation of normal numbers of CD19+ B-cell progenitors, therefore indicating that IL-7 can be dispensable for commitment to the B-cell lineage. Further analysis of Ly6D+CD135+CD127+CD19- progenitors in IL-7- or FL-deficient mice overexpressing Bcl2, as well as in IL-7 transgenic mice suggests that both FL and IL-7 regulate B-cell commitment in a permissive manner: FL by inducing proliferation of Ly6D+CD135+CD127+CD19- progenitors and IL-7 by providing survival signals to these progenitors.

Keywords: commitment; cytokines; hematopoiesis; immunology.


Conflict of interest statement

The authors declare no conflict of interest.

Figures

Fig. 1.
Fig. 1.
IL-7 and FL are necessary for the generation of a normal Ly6D+CD135+CD127+CD19 compartment. (A) FACS plots showing the gating strategy used for identification of Ly6D+ EPLM and their percentage of CD135 and CD127 expression. Lineage staining was as follows: SiglecH, CD115, CD11c, NK1.1, Gr-1. (B) Representative FACS plots of EPLM (Upper row) and CLP (Lower row) from the bone marrow of WT, Il7−/−, and Flt3l−/− mice. (C) Absolute numbers of Ly6D+ EPLM (Upper graph) and CLP (Lower graph) from the bone marrow of WT (n = 13), Il7−/− (n = 5), and Flt3l−/− (n = 10) mice. (D) Representative FACS plots of EPLM and CLP from WT and Flt3ltg mice. (E) Absolute numbers of total EPLM and CLP (Left graphs) and Ly6D+ EPLM and CLP (Right graphs) from WT and Flt3ltg mice. ***P ≤ 0.001.
Fig. S1.
Fig. S1.
(A) CLP FACS staining in WT mice. FACS plots showing the gating strategy used for the identification of Ly6D+ CLP. Lineage staining was as follows: SiglecH, CD115, CD11c, NK1.1, Gr-1. (B) In vitro limiting dilution analysis of Ly6D+ and Ly6D EPLM B-cell potential. Cells were sorted as shown in Fig. 1A and plated at the indicated concentrations on OP9 stromal cells together with IL-7. A representative of three independent experiments is shown. (C and D) Numbers of EPLM (C) and CLP (D) progenitors in WT (n = 13), Il7−/− (n = 5), and Flt3l−/− (n = 10) mice. EPLM were stained as shown in Fig. 1A and CLP as shown in A. Student’s t test. ***P ≤ 0.001. Bars show mean ± SEM.
Fig. 2.
Fig. 2.
Increased in vivo FL levels rescue B-cell generation in Il7−/− mice. (A) Representative FACS plots of EPLM (Upper) and CLP (Lower) from WT, Il7−/−, Flt3ltg, and Flt3ltg-Il7−/− mice. (B) Numbers of EPLM (Upper Left), CLP (Lower Left), Ly6D+ EPLM (Upper Right), and Ly6D+ CLP (Lower Right) from the mouse genotypes indicated on the x axes. For each mouse genotype, mean ± SEM is shown. (C) Numbers of CD19+CD117+ (Upper Left), CD19+CD117IgM (Upper Right), and CD19+IgM+ (Lower) bone marrow cells from the mice indicated on the x axes. For each mouse genotype, mean ± SEM is shown. (D) Numbers of CD19+CD21highCD23low marginal zone (Left) and CD19+CD21+CD23+ follicular (Right) B cells in the spleens of WT or mutant mice, as indicated on the x axes. For each mouse genotype, mean ± SD is shown. *P ≤ 0.05, **P ≤ 0.01, ***P ≤ 0.001, ****P ≤ 0.0001.
Fig. S2.
Fig. S2.
Rescue of CD19+ bone marrow B-cell progenitors in Flt3ltg-Il7−/− mice. Representative FACS plots for the identification of CD19+CD117+, CD19+CD117IgM, and CD19+IgM+ bone marrow cells are shown.
Fig. S3.
Fig. S3.
Thymic T-cell development in Flt3ltg-Il7−/− mice. (A) Representative FACS plots showing CD4/CD8 thymocyte staining from 6- to 8-wk-old WT, Il7−/−, Flt3ltg, and Flt3ltg-Il7−/− mice (n = 4 per group). (B) Total numbers of CD4+ (Left) and CD8+ (Right) single-positive thymocytes from the mouse genotypes indicated on the x axes.
Fig. S4.
Fig. S4.
(A) Representative FACS plots illustrating T cells in the spleens of WT (first row), Il7−/− (second row), Flt3ltg (third row), and Flt3ltg-Il7−/− (fourth row) mice. After gating on living lymphocytes, TCRβ+ cells are further subgrouped in CD4+ and CD8+ T cells. (B) Representative FACS plots illustrating B cells in the spleens of WT (first row), Il7−/− (second row), Flt3ltg (third row), and Flt3ltg-Il7−/− (fourth row) mice. After gating on living lymphocytes, CD19+ cells are further subgrouped in CD21highCD23low marginal zone B cells and CD21+CD23+ follicular B cells. (C and D) Numbers of splenic CD4+ (C) and CD8+ (D) T cells, stained as shown in A, from WT and mutant mice as indicated on the x axes. ***P ≤ 0.001, ****P ≤ 0.0001. Student’s t test; n = 9–15. Data shown above are mean ± SD.
Fig. 3.
Fig. 3.
Increased in vivo FL rescues B-cell commitment in the absence of IL-7 and/or TSLP. (A) In vitro limiting dilution analysis of Ly6D+ EPLM B-cell potential. Ly6D+ EPLM were sorted from WT, Il7−/−, Flt3ltg, and Flt3ltg-Il7−/− mice and plated at the indicated concentrations on OP9 stromal cells together with IL-7. One representative out of four independent experiments is shown. (B) RT-qPCR analysis showing expression of Ebf1, Pax5, and Foxo1 mRNAs in Ly6D+ EPLM sorted from the indicated mouse genotypes. Bars show fold expression relative to WT (set as 1). Error bars represent the SEM from three to six independent experiments. (C) Representative FACS plots showing expression of Ebf1 protein within the Ly6D+ EPLM of the indicated WT or mutant mice. (D) Percentages of Ebf1-expressing Ly6D+ EPLM from WT (n = 7), Il7−/− (n = 3), Flt3ltg (n = 11), and Flt3ltg-Il7−/− (n = 6) mice. Bars show mean ± SEM (E) Ly6D+ EPLM (Left), and CD19+CD117+ (Right) numbers from WT (n = 5), Il7−/− (n = 5), Flt3ltg (n = 3), and Flt3ltg-Il7−/− (n = 5) mice, as well as from Il7−/− (n = 5) and Il7rα−/− (n = 6) mice injected intraperitoneally with 10 daily doses of 10 μg FL each (indicated as +FL) or PBS (+PBS, n = 4). Shown is the mean ± SEM. n.s., not significant, **P ≤ 0.01, ***P ≤ 0.001.
Fig. S5.
Fig. S5.
B-cell potential of Ly6D+ EPLM cells from Il7−/− mice injected with FL. Il7−/− mice were injected with FL (10 daily doses of 10 μg per mouse) and Ly6D+ EPLM were sorted from their bone marrows 1 d after the last injection. (A) In vitro limiting dilution analysis of the B-cell potential of FL-injected Il7−/− Ly6D+ EPLM. Cells were plated at the indicated concentrations on OP9 stromal cells plus IL-7. Flt3ltg Ly6D+ EPLM were used as positive controls. (B and C) In vivo B-cell potential of FL-injected Il7−/− Ly6D+ EPLM. Five thousand Ly6D+ EPLM from FL-injected Il7−/− or Flt3ltg mice were i.v. injected into sublethally irradiated Rag2−/− mice. Four weeks after cell transfer, spleens were analyzed for expression of CD19 and IgM. (B) Representative FACS plots of recipient spleens. (C) Numbers of CD19+IgM+ B cells harvested from the analyzed spleens (n = 4 mice per group).
Fig. 4.
Fig. 4.
Bcl2 overexpression partially rescues B-cell commitment in Il7−/− mice. (A) Representative FACS plots of EPLM (Upper) and CLP (Lower) from WT, Il7−/−, Bcl2tg, and Bcl2tg-Il7−/− mice. (B) Numbers of EPLM (Upper Left), CLP (Lower Left), Ly6D+ EPLM (Upper Right), and Ly6D+ CLP (Lower Right) from WT and mutant mice, as indicated on the x axes. For each mouse genotype, mean ± SEM is shown. (C) In vitro limiting dilution analysis of Ly6D+ EPLM B-cell potential. Ly6D+ EPLM were sorted from WT, Il7−/−, Bcl2tg, and Bcl2tg-Il7−/− mice and plated at the indicated concentrations on OP9 stromal cells together with IL-7. One representative of three independent experiments is shown. (D) Numbers of CD19+CD117+ (Top), CD19+CD117IgM (Middle), and CD19+IgM+ (Bottom) bone marrow cells from WT and mutant mice, as indicated on the x axes. For each mouse genotype, mean ± SEM is shown. *P ≤ 0.05, ***P ≤ 0.001.
Fig. S6.
Fig. S6.
Quiescent state of Bcl2-rescued cells in vivo. (A) Cell cycle analysis of Ly6D+ EPLM from WT (n = 5), Bcl2tg (n = 2), Il7−/− (n = 2), and Bcl2tg-Il7−/− (n = 4) mice. Graph shows percentages of Ki67DAPI, Ki67+DAPI, and Ki67+DAPI+ Ly6D+ EPLM. *P ≤ 0.05, **P ≤ 0.01, ***P ≤ 0.001. Student’s t test. Bars show mean ± SEM. (B) Representative Ki67/DAPI FACS plots of the Ly6D+ EPLM cell cycle analysis collectively presented in A.
Fig. S7.
Fig. S7.
Bcl2-mediated rescue of splenic T and B cells in the absence of IL-7. (A) Representative FACS plots illustrating T cells in the spleens of WT (first row), Il7−/− (second row), Bcl2tg (third row), and Bcl2tg-Il7−/− (fourth row) mice. After gating on living lymphocytes, TCRβ+ cells are further subgrouped in CD4+ and CD8+ T cells. (B) Representative FACS plots illustrating B cells in the spleens of WT (first row), Il7−/− (second row), Bcl2tg (third row), and Bcl2tg-Il7−/− (fourth row) mice. After gating on living lymphocytes CD19+ cells are further subgrouped in CD21highCD23low marginal zone B cells and CD21+CD23+ follicular B cells. (C) Numbers of splenic CD4+ (Upper) and CD8+ (Lower) T cells, stained as shown in A, from WT and mutant mice as indicated on the x axes. (D) Numbers of splenic marginal zone (Upper) and follicular (Lower) B cells, stained as shown in B, from WT and mutant mice as indicated on the x axes. **P ≤ 0.01, ***P ≤ 0.001, ****P ≤ 0.0001. Student’s t test; n = 4–9. Data shown above are mean ± SD.
Fig. 5.
Fig. 5.
IL-7 does not induce proliferation of Ly6D+CD135+CD127+CD19 progenitors. (A) CD19+CD117+ numbers in bone marrow of WT (n = 10), Il7−/− (n = 5), and Il7tg (n = 8) mice. (B) EPLM numbers in bone marrow of WT (n = 14), Il7−/− (n = 7), and Il7tg (n = 5) mice. (C) Ly6D+ EPLM numbers in bone marrow of WT (n = 14), Il7−/− (n = 7), and Il7tg (n = 5) mice. (D) Cell cycle analysis of Ly6D+ EPLM from WT (n = 5) and Il7tg (n = 2) mice. Graph shows percentages of Ki67DAPI, Ki67+DAPI, and Ki67+DAPI+ Ly6D+ EPLM. Bars in AD show mean ± SEM. (E) Numbers of EPLM (Upper Left), CLP (Lower Left), Ly6D+ EPLM (Upper Right), and Ly6D+ CLP (Lower Right) from WT and mutant mice, as indicated on the x axes. For each mouse genotype, mean ± SEM is shown. (F) Numbers of CD19+CD117+ bone marrow cells from WT and mutant mice, as indicated on the x axis. For each mouse genotype, mean ± SEM is shown. (G) Cell cycle analysis of Ly6D+ EPLM from WT (n = 5), Flt3l−/− (n = 3), Il7tg (n = 2), and Il7tg-Flt3l−/− (n = 3) mice. Graph shows percentages of Ki67DAPI, Ki67+DAPI, and Ki67+DAPI+ Ly6D+ EPLM. Bars show mean ± SEM. *P ≤ 0.05, ***P ≤ 0.001.
Fig. S8.
Fig. S8.
Representative FACS plots of EPLM (Upper) and CLP (Lower) from WT, Flt3l−/−, Il7tg, and Il7tg-Flt3l−/− mice.
Fig. S9.
Fig. S9.
Effect of IL-7 overexpression on WT and Flt3l−/− splenic T and B cells. (A) Representative FACS plots illustrating T cells in the spleens of WT (first row), Flt3l−/− (second row), Il7tg (third row), and Il7tg-Flt3l−/− (fourth row) mice. After gating on living lymphocytes, TCRβ+ cells are further subgrouped in CD4+ and CD8+ T cells. (B) Representative FACS plots illustrating B cells in the spleens of WT (first row), Flt3l−/− (second row), Il7tg (third row), and Il7tg-Flt3l−/− (fourth row) mice. After gating on living lymphocytes, CD19+ cells are further subgrouped in CD21highCD23low marginal zone B cells and CD21+CD23+ follicular B cells. (C) Numbers of splenic CD4+ (Upper) and CD8+ (Lower) T cells, stained as shown in A, from WT and mutant mice as indicated on the x axes. (D) Numbers of splenic marginal zone (Upper) and follicular (Lower) B cells, stained as shown in B, from WT and mutant mice as indicated on the x axes. ns, not significant or P > 0.05, ****P ≤ 0.0001. Student’s t test; n = 3–15. Data shown above are mean ± SD.
Fig. 6.
Fig. 6.
FL promotes proliferation but not survival of Ly6D+CD135+CD127+CD19 progenitors. (A) Numbers of EPLM (Upper Left), CLP (Lower Left), Ly6D+ EPLM (Upper Right), and Ly6D+ CLP (Lower Right) from WT (n = 14), Flt3l−/− (n = 10) and Flt3ltg (n = 9) mice. Bars show mean ± SEM. (B) Cell cycle analysis of Ly6D+ EPLM from WT (n = 5), Flt3l−/− (n = 3), and Flt3ltg (n = 9) mice. Graph shows percentages of Ki67DAPI, Ki67+DAPI, and Ki67+DAPI+ Ly6D+ EPLM. Bars show mean ± SEM. (C) Numbers of EPLM (Upper Left), CLP (Lower Left), Ly6D+ EPLM (Upper Right), and Ly6D+ CLP (Lower Right) from WT and mutant mice, as indicated on the x axes. For each mouse genotype, mean ± SEM is shown. (D) In vitro limiting dilution analysis of Ly6D+ EPLM B-cell potential. Ly6D+ EPLM were sorted from WT, Flt3l−/−, and Bcl2tg-Flt3l−/− mice and plated at the indicated concentrations on OP9 stromal cells together with IL-7. (E) Numbers of CD19+CD117+ (Left), CD19+CD117IgM (Middle), and CD19+IgM+ (Right) bone marrow cells from WT and mutant mice, as indicated on the x axes. For each mouse genotype, mean ± SEM is shown. *P ≤ 0.05, **P ≤ 0.01, ***P ≤ 0.001.
Fig. S10.
Fig. S10.
Effect of in vivo FL levels on Ly6D+ EPLM cell cycle. Representative Ki67/DAPI FACS plots of the Ly6D+ EPLM cell cycle analysis collectively presented in Fig. 6B.
Fig. 7.
Fig. 7.
FL does not instruct Ebf1 expression and B-cell commitment. (A) Representative FACS plots showing expression of Ebf1 protein within the Ly6D+ EPLM of WT, Flt3l−/−, and Flt3ltg mice. (B) Percentages of Ebf1-expressing Ly6D+ EPLM from WT (n = 7), Flt3l−/− (n = 5), and Flt3ltg (n = 12) mice. Bars show mean ± SEM. (C) In vitro limiting dilution analysis of Ly6D+ EPLM T-cell potential. Ly6D+ EPLM were sorted from WT and Flt3ltg mice and plated at the indicated concentrations on OP9-DL1 stromal cells together with IL-7. One representative of four independent experiments is shown. (D) Schematic model for the permissive role of IL-7 and FL acting on hematopoietic progenitors and CD19+ committed B-cell precursors. LMPP, lymphoid-primed multipotent progenitor. ***P ≤ 0.001.

References

    1. Metcalf D. Hematopoietic cytokines. Blood. 2008;111(2):485–491. - PMC - PubMed
    1. Endele M, Etzrodt M, Schroeder T. Instruction of hematopoietic lineage choice by cytokine signaling. Exp Cell Res. 2014;329(2):207–213. - PubMed
    1. Enver T, Heyworth CM, Dexter TM. Do stem cells play dice? Blood. 1998;92(2):348–351, discussion 352. - PubMed
    1. Metcalf D. Lineage commitment and maturation in hematopoietic cells: The case for extrinsic regulation. Blood. 1998;92(2):345–347, discussion 352. - PubMed
    1. Grover A, et al. Erythropoietin guides multipotent hematopoietic progenitor cells toward an erythroid fate. J Exp Med. 2014;211(2):181–188. - PMC - PubMed

Publication types

MeSH terms

LinkOut - more resources