. 2016 Dec 13;113(50):14456-14461.
doi: 10.1073/pnas.1617699113. Epub 2016 Nov 22.

High-performance multiplexed fluorescence in situ hybridization in culture and tissue with matrix imprinting and clearing

Affiliations

High-performance multiplexed fluorescence in situ hybridization in culture and tissue with matrix imprinting and clearing

Jeffrey R Moffitt et al. Proc Natl Acad Sci U S A. .

Abstract

Highly multiplexed single-molecule FISH has emerged as a promising approach to spatially resolved single-cell transcriptomics because of its ability to directly image and profile numerous RNA species in their native cellular context. However, background-from off-target binding of FISH probes and cellular autofluorescence-can become limiting in a number of important applications, such as increasing the degree of multiplexing, imaging shorter RNAs, and imaging tissue samples. Here, we developed a sample clearing approach for FISH measurements. We identified off-target binding of FISH probes to cellular components other than RNA, such as proteins, as a major source of background. To remove this source of background, we embedded samples in polyacrylamide, anchored RNAs to this polyacrylamide matrix, and cleared cellular proteins and lipids, which are also sources of autofluorescence. To demonstrate the efficacy of this approach, we measured the copy number of 130 RNA species in cleared samples using multiplexed error-robust FISH (MERFISH). We observed a reduction both in the background because of off-target probe binding and in the cellular autofluorescence without detectable loss in RNA. This process led to an improved detection efficiency and detection limit of MERFISH, and an increased measurement throughput via extension of MERFISH into four color channels. We further demonstrated MERFISH measurements of complex tissue samples from the mouse brain using this matrix-imprinting and -clearing approach. We envision that this method will improve the performance of a wide range of in situ hybridization-based techniques in both cell culture and tissues.

Keywords: brain; fluorescence in situ hybridization; multiplexed imaging; single-cell transcriptomics; tissue clearing.


Conflict of interest statement

X.Z., J.R.M., J.H., and T.L. are inventors on patents applied for by Harvard University that cover the multiplexed error-robust FISH and matrix-imprinting–based clearing methods.

Figures
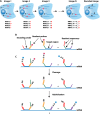
Fig. S1.
Fig. S1.
Schematic diagram of MERFISH. (A) Illustration of a barcoding process used by MERFISH to identify RNAs. In this implementation of MERFISH, each individual RNA species is assigned a unique binary barcode. This barcode is then read out through a series of smFISH staining and imaging rounds. Each smFISH image is associated with a specific bit in the binary barcode, and only a subset of the targeted RNAs is labeled such that it will fluoresce in each image. If an RNA fluoresces in a given image, then it is assigned a “1” in the corresponding bit. If it does not, then it is assigned a “0.” In this fashion, the specific on/off pattern of fluorescence across n smFISH images is used to construct a binary barcode for each measured RNA in the sample, and this measured binary barcode is then used to decode the identity of that RNA: for example, A, B, C. (B) Schematic depiction of the design of MERFISH probes used in this work. Individual RNAs are labeled with multiple “encoding” oligonucleotide probes. These encoding probes contain a central target region that has a sequence complementary to a portion of the RNA to which the encoding probes are targeted. This sequence is flanked by multiple readout sequences. These readout sequences are custom-designed, 20-nt sequences, and there is one unique readout sequence associated with each bit in the barcodes. If an RNA species is assigned a barcode with a “1” in a given bit, then the readout sequence associated with that bit will be contained within the encoding probes that target that RNA; thus, the set of readout sequences associated with each RNA define its barcode. In the MHD4 code used in this work to encode RNAs, each valid 16-bit barcode contains only four “1” bits and, hence, the set of encoding probes targeting each RNA together contain four different readout sequences. To limit the length of the encoding probes, we randomly chose three of the four readout sequences to be associated with each encoding probe. After staining the RNAs with encoding probes, the barcodes associated with the RNAs are then measured by a series of hybridizations with fluorescently labeled readout probes, each complementary to a readout sequence. (C) Schematic depiction of the MERFISH readout process used here. During each round of readout hybridization, one or more readout probes are added to the sample. Multiple different readout probes can be hybridized to the sample simultaneously if each is conjugated to a spectrally distinct dye, allowing multiple bits to be read out simultaneously. Illustrated here is a two-color readout scheme with the two distinct dyes marked as red and blue circles. The sample is imaged in two color channels and the presence or absence of a fluorescent spot determines if the corresponding readout sequence is present and, thus, if the barcode associated with each RNA copy has a “1” or a “0” in the corresponding bit. To remove the fluorescent signal before the next round of hybridization and imaging, a disulfide bond linking the fluorophores to the readout probes is reductively cleaved and the free fluorophores are washed away. The sample is then restained with a different set of readout probes and the process repeated to read out the remaining bits in the barcodes.
Fig. 1.
Fig. 1.
Matrix imprinting and clearing reduces background in smFISH measurements. (A) A human fibroblast cell (IMR-90) stained with smFISH probes targeting the FLNA mRNA before (Left and Center) and after (Right) treatment with RNase A. The contrast of the Center and Right panels has been increased fivefold from that of the Left panel to better visualize the background from probes bound off-target. (Scale bars, 10 µm.) (B) Schematic diagram of a matrix-imprinting and -clearing approach to reduce background in smFISH measurements. Cells are stained with smFISH probes or encoding probes for MERFISH measurements, and a poly-dT anchor probe, which targets the polyA tail of mRNAs. Cells are then embedded in a PA matrix, to which the poly-dT anchor probes are covalently linked via a terminal acrydite moiety. Proteins and lipids are then digested and extracted, freeing off-target bound smFISH probes to diffuse out of the PA matrix and removing cellular components that contribute to autofluorescence. (C) U-2 OS cells labeled with MERFISH-encoding probes targeting 130 RNAs followed by staining with a readout probe conjugated to Cy5 that binds to the encoding probes in an uncleared sample (Upper) and a sample treated with the matrix-imprinting and -clearing protocol (Lower). (Scale bars, 20 µm.)
Fig. S2.
Fig. S2.
Off-target binding of FISH probes is largely insensitive to RNase treatment. Images of different background sources in IMR-90 cells: cells stained with encoding probes but no fluorescently labeled readout probe (Left), cells stained with a fluorescently labeled readout probe but no encoding probes (Center), and cells stained with encoding probes, a fluorescently labeled readout probe that can bind to a readout sequence on these encoding probes, and then treated with RNase A to remove all specific RNA signals (Right). All three images are displayed at the same contrast to illustrate the relative intensity of the signal from the autofluorescence background of the cell (Left), the very low level (if any) of nonspecific binding of readout probes, and the signal from the off-target (RNase-insensitive) binding of encoding probes followed by binding of the readout probes to the encoding probes. The encoding probes used here target the FLNA mRNA only, and the readout probe used here is the Bit-1 readout probe conjugated to Cy5 (Table S1). (Scale bars, 5 µm.)
Fig. S3.
Fig. S3.
Protease digestion and detergent treatment efficiently remove protein and lipid from PA-embedded cells. (A) Images of U-2 OS cells stained with Krypton, a nonspecific protein dye, before (Uncleared) or after matrix imprinting and clearing (Cleared). The contrast at which the Right image is displayed has been increased 10× relative to the Center image to better illustrate the reduction in fluorescence signal. (B) The average fluorescence signal observed from the samples in A. The average fluorescence has been normalized to the fluorescence observed in the uncleared sample. The error bar represents SEM (n = 3 replicates). (C) As in A but for DiD, a nonspecific lipid stain. (D) As in B but for the samples stained with DiD. (Scale bars, 20 µm.)
Fig. S4.
Fig. S4.
Matrix imprinting and clearing in PA films does not reduce the rate of readout probe binding or reductive cleavage of fluorescent dyes. (A) The average brightness of individual RNA spots as a function of time exposed to a readout probe conjugated to Cy5 in uncleared samples (orange) or matrix imprinted and cleared samples (blue). The average brightness was normalized to the average of the brightness observed in the final two time points. (B) The average brightness of individual RNA spots as a function of time exposed to cleavage buffer (SI Materials and Methods). The average brightness has been normalized to that observed before exposure to cleavage buffer. Both measurements were conducted on IMR-90 cells stained with encoding probes targeting the FLNA mRNA and the first readout probe (Bit 1) (Table S1). The readout hybridization buffer used in A differed slightly from that described previously (14) in that it contained 3 nM of the readout probe and no dextran sulfate. All error bars represent SEM (n = 3 replicates).
Fig. 2.
Fig. 2.
Matrix imprinting and clearing improves MERFISH performance with no loss in RNA. (A, Left) Two-color smFISH images from each of the eight rounds of hybridization and imaging in a MERFISH measurement of 130 RNA species in matrix-imprinted and -cleared U-2 OS cells using readout probes labeled with Cy5 (green) or Alexa750 (red). Yellow represents the overlay between the two dyes. Only a small portion of the MERFISH imaging FOV is shown. (Scale bars, 2 µm.) (Right) All identified RNAs (colored markers) detected in a single FOV with the barcodes of the RNAs represented by the colors of the markers. The white box represents the portion of this FOV displayed on the Left. (Scale bar, 25 µm.) (B) The average copy numbers per cell observed for these RNA species in matrix-imprinted and -cleared U-2 OS cells versus the copy numbers obtained from previously published measurements in an uncleared sample (14). Copy numbers were corrected by subtracting the average copy number observed for the blank barcodes. Uncorrected copy numbers are displayed in Fig. S5B. The log10 counts correlate with a Pearson correlation coefficient of 0.94 (P value: 10−54). The dashed line represents equality. (C) The average ratio of the copy number per cell for a sample that was matrix imprinted and cleared to that observed for an uncleared sample for RNAs within the specified RNA length range. Error bars represent SEM (n = 26 genes for each bin). (D) Average copy number per cell of the blank barcodes (i.e., barcodes not assigned to an RNA) in an uncleared sample and in a matrix-imprinted and -cleared sample. Error bars represent SEM (n = 10 blank barcodes).
Fig. S5.
Fig. S5.
Matrix imprinting and clearing reduces bias in the detection of low abundance RNAs. (A) The ratio of the copy number per cell determined via MERFISH to the abundance determined via RNA-seq (46) as measured in FPKM for uncleared samples (blue) and for matrix-imprinted and -cleared samples (red). Error bars represent SEM (n = 26 RNAs in each abundance range). (B) The copy number per cell determined via MERFISH in a matrix-imprinted and -cleared sample compared with that determined for an uncleared sample. These copy numbers have not been corrected for the average rate of blank barcode detection as in Fig. 2B. The dashed line represents equality. The deviation from equality in B and the excess MERFISH counts relative to those estimated from bulk RNA-seq at the low abundance range are consistent with the increased rate of blank barcode detection observed for uncleared samples (Fig. 2D).
Fig. 3.
Fig. 3.
Autofluorescence reduction by matrix imprinting and clearing facilitates four-color MERFISH. (A) The average autofluorescence observed for unstained U-2 OS cells before (blue) and after (red) matrix imprinting and clearing when excited with 750-, 647-, 561-, or 488-nm light. Error bars represent SEM (n = 3 replicates). (B) Images of cleared U-2 OS cells stained with MERFISH-encoding probes targeting 130 RNAs and the first four readout probes each conjugated to one of the following dyes: Alexa750, Cy5, ATTO565, or Alexa488. Samples were imaged with excitation light listed in A. (Scale bars, 10 µm.) (C) Average copy number per cell determined via four-color MERFISH to that determined with two-color MERFISH, both in cleared samples. The copy numbers have been corrected by subtracting the average rate of blank barcode detection as in Fig. 2B. The dashed line represents equality. The Pearson correlation coefficient between the log10 abundances is 0.99 (P value: 10−98). (D) The average rate of observing a “1” to “0” error (blue) or a “0” to “1” error (red) per bit for bits that are read out with each of the four color channels, as indicated by the excitation wavelength. Each error rate (“1” to “0” or “0” to “1”) was calculated for each individual bit using the frequency at which errors were corrected at that bit, as described previously (13), and then these per bit error rates were averaged over the bits that were detected in the same color channel (Table S1). Error bars represent SEM (n = 4 bits read out with each color channel).
Fig. S6.
Fig. S6.
Two- and four-color MERFISH measurements in matrix imprinted and cleared samples are reproducible. Comparison of the average copy number per cell measured in different two-color or four-color MERFISH measurements in matrix imprinted and cleared U-2 OS cells. ρ10 represents the Pearson correlation coefficient between the log10 copy numbers for all RNAs. The P values associated with all ρ10 are less than 10−44.
Fig. 4.
Fig. 4.
MERFISH measurements of adult mouse brain tissue. (A) NissI-stained images of coronal and sagittal slices of an adult mouse brain taken from the Allen brain atlas (42). The black box and dashed line represent the region of the mouse hypothalamus studied. (Scale bar, 2 mm.) (B) Image of a single, 10-µm-thick cryosection of the mouse hypothalamus stained with DAPI. The complete volume of the central 2-mm × 2-mm region of this slice was imaged with MERFISH using seven 1.5-µm-thick optical sections per FOV. (Scale bar, 1 mm.) (C and D) Images of a small portion of a mouse hypothalamus slice stained with an encoding probe set used for a MERFISH measurement of 130 RNAs and a readout probe conjugated to Cy5. (C) Single optical section image of an uncleared sample. (D) Single optical section image of a matrix-imprinted and -cleared sample. (Scale bars, 50 µm.) (E) Zoom-in of the region of D marked with the white dashed box. (F) Decoded RNAs (different colors represent different barcodes) from all seven optical sections of the region shown in E. Not all RNA molecules shown in F are observed in E because E represents only one of the seven optical sections and one of the 16 bits. (Scale bars, 10 μm.) (G) The average rate of observing a “1” to “0” error (blue) or a “0” to “1” error (red) per bit for bits that are read out with each of the two color channels, as indicated by the excitation wavelength. Error rates were calculated as in Fig. 3D. Error bars represent SEM (n = 8 bits read out with each color channel). (H) The density of 130 RNA species as determined via MERFISH versus the abundance as determined via bulk RNA-seq for the region of the mouse hypothalamus shown in A. The Pearson correlation coefficient between the log10 abundances is 0.84 (P value: 10−35).

References

    1. Femino AM, Fay FS, Fogarty K, Singer RH. Visualization of single RNA transcripts in situ. Science. 1998;280(5363):585–590. - PubMed
    1. Raj A, van den Bogaard P, Rifkin SA, van Oudenaarden A, Tyagi S. Imaging individual mRNA molecules using multiple singly labeled probes. Nat Methods. 2008;5(10):877–879. - PMC - PubMed
    1. Raj A, van Oudenaarden A. Nature, nurture, or chance: Stochastic gene expression and its consequences. Cell. 2008;135(2):216–226. - PMC - PubMed
    1. Sanchez A, Golding I. Genetic determinants and cellular constraints in noisy gene expression. Science. 2013;342(6163):1188–1193. - PMC - PubMed
    1. Holt CE, Schuman EM. The central dogma decentralized: New perspectives on RNA function and local translation in neurons. Neuron. 2013;80(3):648–657. - PMC - PubMed

Publication types