. 2016 Dec 1;167(6):1481-1494.e18.
doi: 10.1016/j.cell.2016.11.013.

Impaired Amino Acid Transport at the Blood Brain Barrier Is a Cause of Autism Spectrum Disorder

Affiliations

Impaired Amino Acid Transport at the Blood Brain Barrier Is a Cause of Autism Spectrum Disorder

Dora C Tărlungeanu et al. Cell. .

Abstract

Autism spectrum disorders (ASD) are a group of genetic disorders often overlapping with other neurological conditions. We previously described abnormalities in the branched-chain amino acid (BCAA) catabolic pathway as a cause of ASD. Here, we show that the solute carrier transporter 7a5 (SLC7A5), a large neutral amino acid transporter localized at the blood brain barrier (BBB), has an essential role in maintaining normal levels of brain BCAAs. In mice, deletion of Slc7a5 from the endothelial cells of the BBB leads to atypical brain amino acid profile, abnormal mRNA translation, and severe neurological abnormalities. Furthermore, we identified several patients with autistic traits and motor delay carrying deleterious homozygous mutations in the SLC7A5 gene. Finally, we demonstrate that BCAA intracerebroventricular administration ameliorates abnormal behaviors in adult mutant mice. Our data elucidate a neurological syndrome defined by SLC7A5 mutations and support an essential role for the BCAA in human brain function.

Keywords: ASD; amino acid transporter; autism; blood brain barrier; excitation and inhibition imbalance; motor deficits.


Conflict of interest statement

The authors declare no conflict of interests.

Figures

Figure 1
Figure 1. Slc7a5 mediates BCAA flux at the BBB
(A) Representative images showing Slc7a5 (green) localization at the BBB in control animals (Slc7a5fl/fl, left) and its complete deletion in endothelial cells of the BBB in Cre positive mice (Tie2Cre;Slc7a5fl/fl, right). Immunostainings were performed in cortical slices at embryonic day 14.5 (E14.5 top), postnatal day 2 (P2, middle) and adulthood (>P40, bottom). Nuclei were stained with DAPI (blue). (B–D) Brain amino acid levels in Tie2Cre;Slc7a5fl/fl mice at E14.5 (B), P2-14 (C) and >P40 (D). Levels of amino acids were normalized on protein concentration and shown as fold change (log2 transformed) to levels in age-matched controls. In red are represented the amino acids with a fold change >1.3 and P value <0.05 (n>4 mice/genotype/time point). See also Figure S1, S2 and Table S1.
Figure 2
Figure 2. Activation of the amino acid response pathway in the brain of Slc7a5 mutant mice
(A) RNA sequencing of adult brain in Tie2Cre;Slc7a5fl/+ and Tie2Cre;Slc7a5fl/fl mice revealed 131 differentially expressed genes (FDR-adjusted P-value ≤ 0.05). The heat map displays log transformed count data normalized to library size. Genes expressed at lower levels in Tie2Cre;Slc7a5fl/fl (40 genes) are displayed at the top and genes up-regulated in Tie2Cre;Slc7a5fl/fl (91 genes) are shown at the bottom. Zoomed rows on the right emphasize differentially expressed genes associated with amino acid import (GO:0089718), tRNA aminoacylation (GO:0006418) and amino acid response, respectively (n=3 mice/genotype). (B) Results of GO Enrichment analysis on the set of 131 differentially expressed genes. Terms are sorted according to P-value with the most significantly enriched terms at the top: GO terms for molecular functions (GO:MF, left, blue); GO terms for biological processes (GO:BP, right, green). The length of each bar indicates the P-value while the width indicates the amount of genes in the set associated with the term. (C) Western blot analysis from cortical lysates of Tie2Cre;Slc7a5fl/+ (control) and Tie2Cre;Slc7a5fl/fl mice, indicating that mutants exhibit increased phospho-eIF2α and total 4EBP1 protein levels but normal levels of total eIF2α, phospho-4EBP1, phospho-S6K, S6K, phospho-eIF4E and eIF4E. Tubulin was used as internal control. Representative blots (left) and fold change ratio (right); *P<0.05 (means ± SEM; n≥4 mice/genotype). (D) Polysome profile from cortical lysates of control and Tie2Cre;Slc7a5fl/fl mice. Typical tracings indicating positions of 40S, 60S and 80S ribosome peaks and polysome (P)/monosome (M) ratio quantifications; ***P<0.001 (right inset: means ± SEM; n=10 control and n=9 mutant mice).
Figure 3
Figure 3. Neurobehavioral abnormalities in the Tie2Cre;Slc7a5fl/fl mice
(A–D) Decreased exploratory behavior and locomotion abnormalities in the Tie2Cre;Slc7a5fl/fl mice. (A) Open field test. Representative trajectories (left) and quantification of the total distance moved (middle) and the velocity (right) indicating that Tie2Cre;Slc7a5fl/fl mice are outperformed by controls; **P<0.01 (means ± SEM; n=10 mice/genotype). (B) Comparison of the number of rearings pointing out deficiencies in the mutants; **P<0.01 (means ± SEM; n=10 mice/genotype) (C) Walking beam performance on training days (Day 1, Day 2) and on the three trials of the test day (Day 3), showing elevated latency to cross the beam in the mutants; *P<0.05, **P<0.01 (means ± SEM; n=7 mice/genotype). (D) Representative images of control (left) and Tie2Cre;Slc7a5fl/fl strides (right) in the gait test. Forepaw (red) and hindpaw (blue). (E) Altered gait of the Tie2Cre;Slc7a5fl/fl mice is evidenced by inter-genotype comparison of stride, sway and stance length quantifications; *P<0.05, **P<0.01, ***P<0.001 (means ± SEM; n=7 mice/genotype). (F) Three chamber social interaction test (left) and quantifications (right) of the number of contacts with the caged mouse (M) or with the caged object (O) revealing abnormal social interaction pattern in the mutant mice (mutants show no preference for the M over the O, as opposed to controls); **P<0.01, N.S. not significant (means ± SEM; n=12 mice/genotype). (G) Juvenile Tie2Cre;Slc7a5fl/fl mice display fewer reciprocal social interactions. Slc7a5 mutant mice tend to stay farther apart from their cage mate (heat-map and bottom left graph) and exhibit fewer nose-to-nose contacts (bottom right graph). WT= Slc7a5fl/+; KO= Tie2Cre;Slc7a5fl/fl. *P<0.05 (means ± SEM; n=8 mice/genotype). (H) Isolation induced USV at various postnatal days show that Tie2Cre;Slc7a5fl/fl mice emit an increased number of calls starting at P8. *P<0.05 (means ± SEM; n=10 mice/genotype). See also Figure S3.
Figure 4
Figure 4. Excitation/inhibition imbalance in Tie2Cre;Slc7a5fl/fl somatosensory cortex
(A–B) Left: Representative mEPSC (A) and mIPSC (B) recordings from Tie2Cre;Slc7a5fl/+ and Tie2Cre;Slc7a5fl/fl somatosensory cortex (SCX) layers 2–3 pyramidal neurons; Right: Cumulative probability distributions of peak amplitudes and inter-event intervals of mEPSC (A) and mIPSC (B) in the two genotypes. Insets: quantifications of mean amplitudes and mean frequencies of the corresponding currents, with significant differences in mutants versus controls. D=0.093, P<10−11 (mEPSC amplitudes) and D=0.099, P<10−15 (mIPSC interevent intervals); (means ± SEM, ncells/nanimals/genotype: 14/7/Tie2Cre;Slc7a5fl/+ and 13/5/Tie2Cre;Slc7a5fl/fl (mEPSC); 16/7/Tie2Cre;Slc7a5fl/+ and 18/5/Tie2Cre;Slc7a5fl/fl (mIPSC). (C) Representative confocal images of VGAT-positive synaptic puncta (green) in control (left) and Tie2Cre;Slc7a5fl/fl (right) cortical sections displaying decreased staining intensity in the mutants. Nuclei were stained with DAPI (blue). (D) Confocal imaging of cortical sections labeled for Neuroligin 2 (NLGN2, red) of control (left) and Tie2Cre;Slc7a5fl/fl (right) animals revealing no difference between genotypes. Nuclei were stained with DAPI (blue). Scale bar as in (C). (E) Western blot analysis from cortical lysates indicating decreased VGAT (top) and similar NLGN2 protein levels (middle) in Tie2Cre;Slc7a5fl/fl mice compared with controls. GAPDH (bottom) was used as internal control. (F) Electron microscopy imaging of the SCX layers 2–3 showing that Tie2Cre;Slc7a5fl/fl mice have a decreased area of GABAergic boutons and decreased density of vesicles per bouton. Typical micrograph images (left), summary graphs of presynaptic area (middle) and vesicle density (right); ***P<0.001 (means ± SEM; nsynapses/genotype: 27/control and 22/mutant). See also Figure S4 and S5.
Figure 5
Figure 5. Mutations in the human SLC7A5 lead to ASD and motor deficits
(A) SLC7A5 mutations identified in families 1426 and 1465 in individuals with ASD, motor deficits and microcephaly. Pedigrees 1426 and 1465 display first-cousin consanguinity, five and two affected patients (solid symbols) respectively and unaffected members (open symbols) (B) MRI from one patient for each family showing microcephaly and thin corpus callosum but normal axial T1 sequence of the brain. Control child brain MRIs were obtained from unrelated individuals. (C) Clinical presentation of patients from family 1426 and 1465. HC, head circumference; SD, standard deviation; GTC, generalized tonic clonic; N/A not available; CC, corpus callosum. See also Table S2.
Figure 6
Figure 6. A246V and P375L mutations compromise SLC7A5 function
(A) Conservation of the SLC7A5 A246 and P375 in several species. (B) Side, top and bottom views of the predicted structure of SLC7A5 in complex with tryptophan showing SLC7A5 backbone atoms (gray ribbon), atoms of the residues constituting the missense mutations (yellow spheres) and the ligand tryptophan (green sticks); oxygen atoms (red) and nitrogen atoms (blue). (C) SLC7A5 wild-type, A246V and A246G mutants over-expressed and purified by fast protein liquid chromatography were reconstituted in proteoliposomes. Transport is followed as uptake (red arrow) of external [3H]His in exchange with internal His. Transport was started by adding external 5 µM [3H]His at time zero to proteoliposomes containing 10 mM His reconstituted with SLC7A5-WT (○), SLC7A5-A246V ( formula image
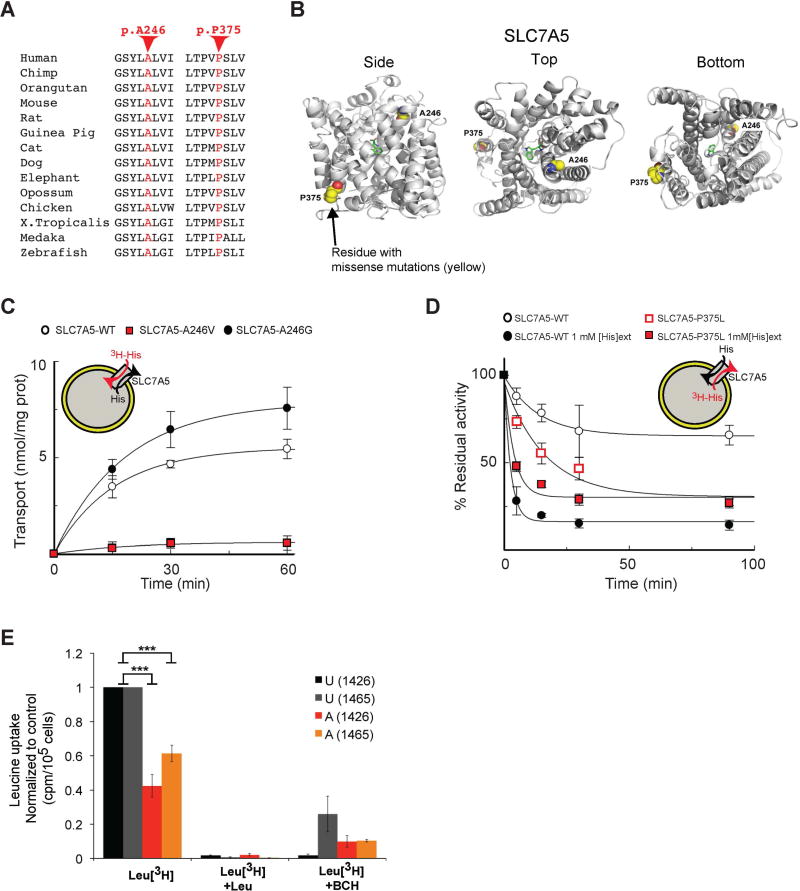
) or SLC7A5-A246G (●) and stopped at the indicated times (means ± SD; n=5 experiments). (D) Time dependence of [3H]His efflux from proteoliposomes reconstituted with SLC7A5-WT or SLC7A5-P375L was measured. Proteoliposomes reconstituted with SLC7A5-WT (○, ●) or SLC7A5-P375L ( formula image, formula image), containing 2 mM His were radioactivity-preloaded. Efflux was measured in absence (○, formula image; uniport) or presence of external 1 mM His (●, formula image
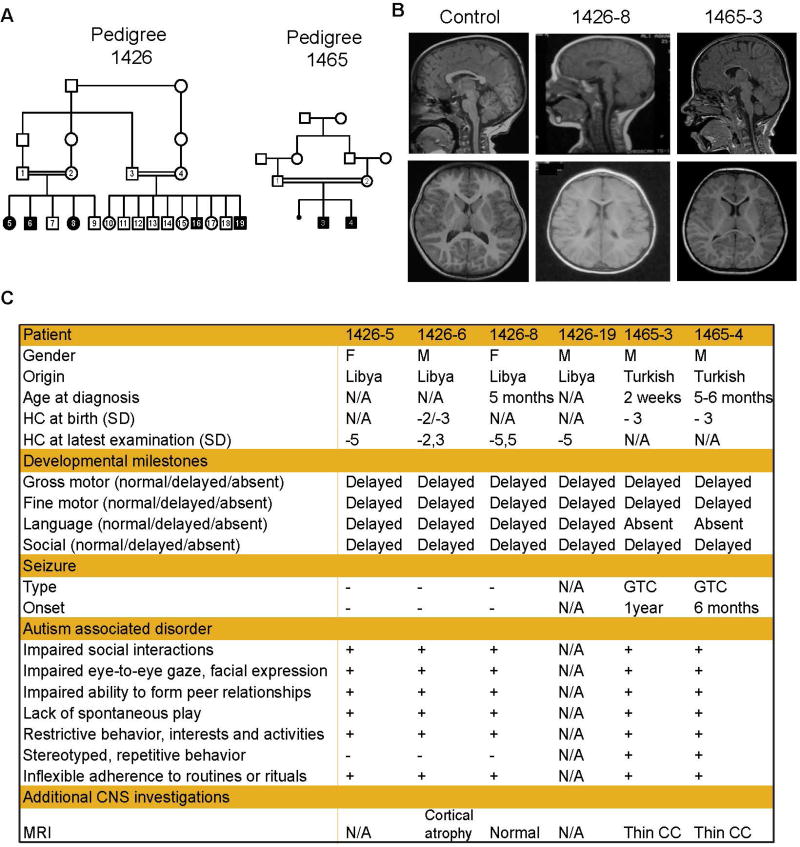
; antiport). Percentage of His efflux was calculated with respect to time 0 (means ± SD; n=4 experiments). (E) Radio-labeled leucine ([3H]Leu) transport analysis in human fibroblasts from affected (A) and unaffected (U) members of families 1426 and 1465 illustrating a significant reduction in leucine uptake by the cells of affected patients. Specificity of leucine uptake was assessed by competition with 10mM cold leucine (Leu) or 10 mM 2 BCH; ***P<0.001 (means ± SEM; N≥3 experiments performed with fibroblasts from two patients and one healthy control/family). See also Figure S7.
Figure 7
Figure 7. Normalization of Tie2Cre;Slc7a5fl/fl mouse behavior after leucine and isoleucine i.c.v. administration
(A) Timeline of treatment and HPLC and behavioral tests. (B) Brain levels of leucine (left) and isoleucine (right) in age-matched animals receiving (+) or not receiving (−) the i.c.v. treatment. Amino acid levels were normalized to protein concentration and to wild-type levels. **P<0.01, ***P<0.001 (means ± SEM; n=8 mice/genotype). (C) Quantification of the total distance moved (left), velocity (middle) and number of rearings (right) in the open field revealing similar behavior in treated (+) Tie2Cre;Slc7a5fl/fl mice and non-treated (−) or treated (+) controls (Tie2Cre;Slc7a5fl/+) but significant differences with non-treated (−) Tie2Cre;Slc7a5fl/fl mice; *P<0.05, **P<0.01 (means ± SEM; n=10 (−) control, n=4 (+) control, n=11 (−) mutant and n=8 (+) mutant). (D) Similar sway length in treated (+) mutant mice and non-treated (−) or treated (+) control (Tie2Cre;Slc7a5fl/+) animals but significant difference with non-treated (−) Tie2Cre;Slc7a5fl/fl mice; **P<0.01 (means ± SEM; n=10 (−) control, n=4 (+) control, n=11 (−) mutant and n=8 (+) mutant). See also Table S3.

References

    1. Angelastro JM, Ignatova TN, Kukekov VG, Steindler DA, Stengren GB, Mendelsohn C, Greene LA. Regulated expression of ATF5 is required for the progression of neural progenitor cells to neurons. The Journal of neuroscience : the official journal of the Society for Neuroscience. 2003;23:4590–4600. - PMC - PubMed
    1. Bailey A, Le Couteur A, Gottesman I, Bolton P, Simonoff E, Yuzda E, Rutter M. Autism as a strongly genetic disorder: evidence from a British twin study. Psychol Med. 1995;25:63–77. - PubMed
    1. Banko JL, Klann E. Cap-dependent translation initiation and memory. Progress in brain research. 2008;169:59–80. - PubMed
    1. Braat S, Kooy RF. The GABAA Receptor as a Therapeutic Target for Neurodevelopmental Disorders. Neuron. 2015;86:1119–1130. - PubMed
    1. Braun LD, Cornford EM, Oldendorf WH. Newborn rabbit blood-brain barrier is selectively permeable and differs substantially from the adult. Journal of neurochemistry. 1980;34:147–152. - PubMed

MeSH terms