. 1989 Oct;65(4):997-1020.
doi: 10.1161/01.res.65.4.997.

Blood-tissue exchange via transport and transformation by capillary endothelial cells

Affiliations

Blood-tissue exchange via transport and transformation by capillary endothelial cells

J B Bassingthwaighte et al. Circ Res. 1989 Oct.

Abstract

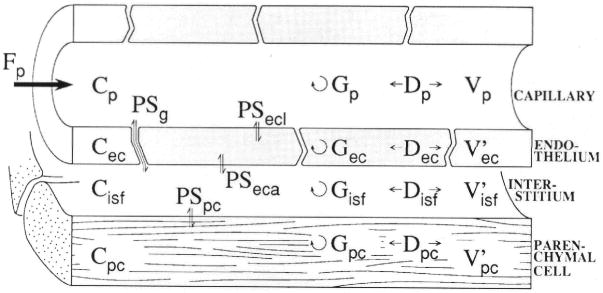
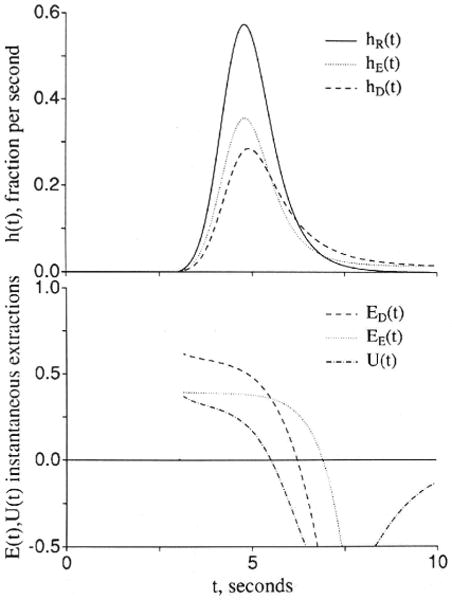
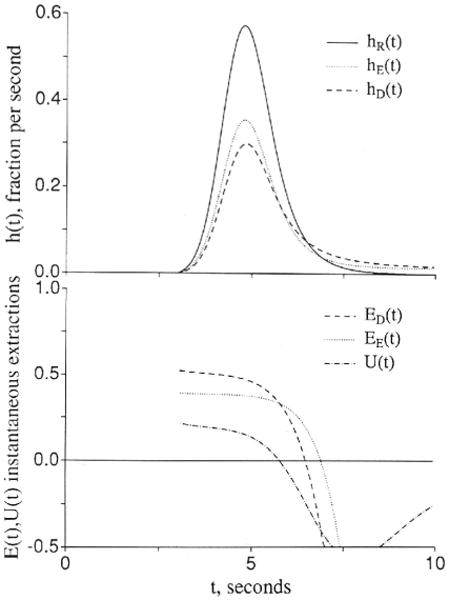
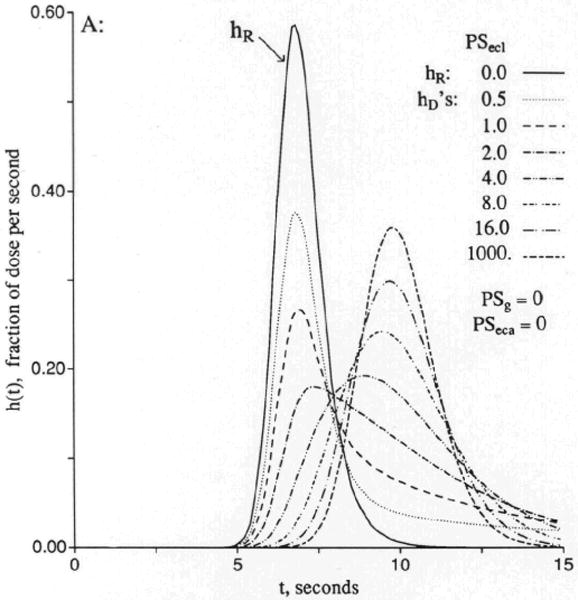
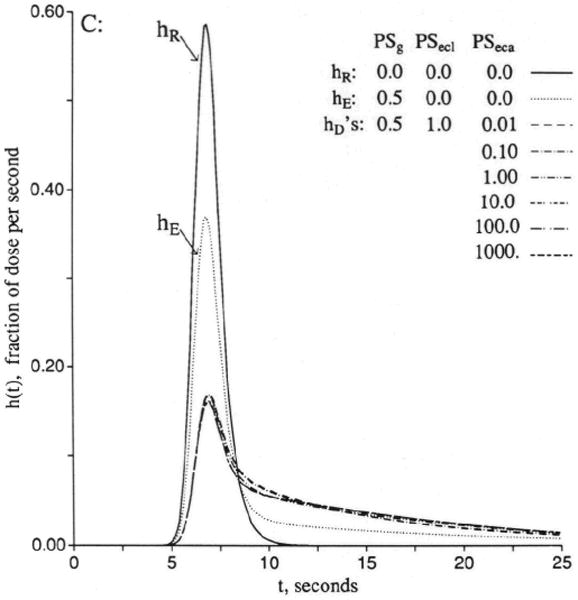
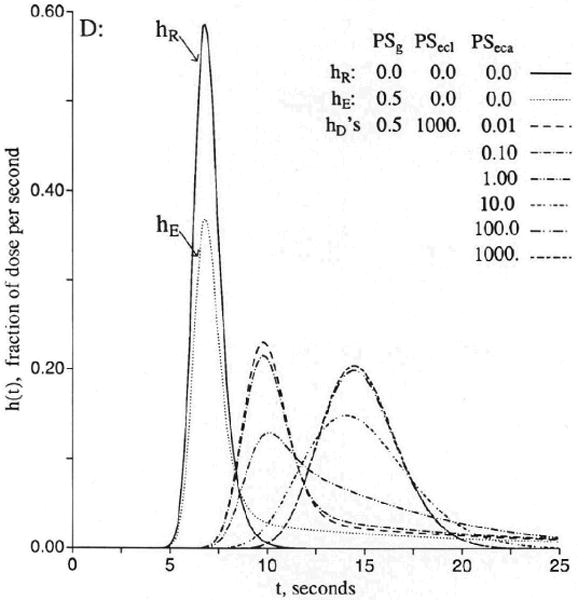
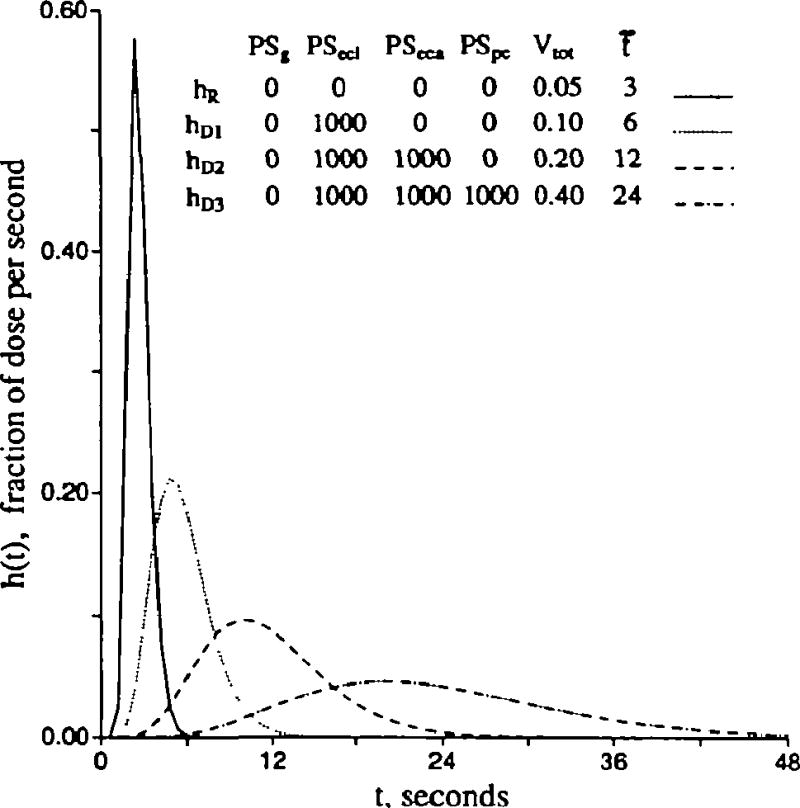
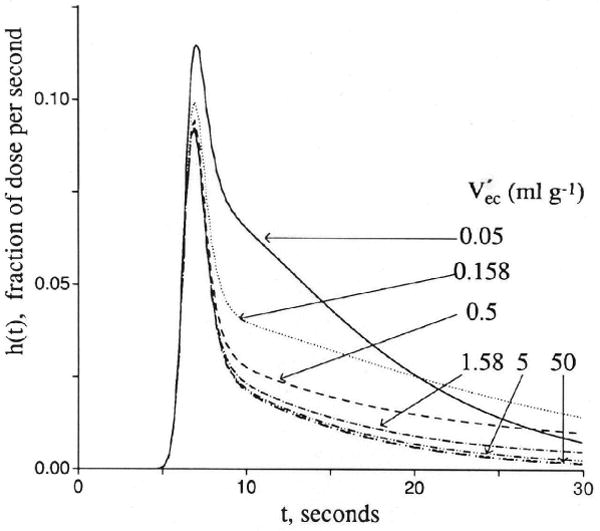
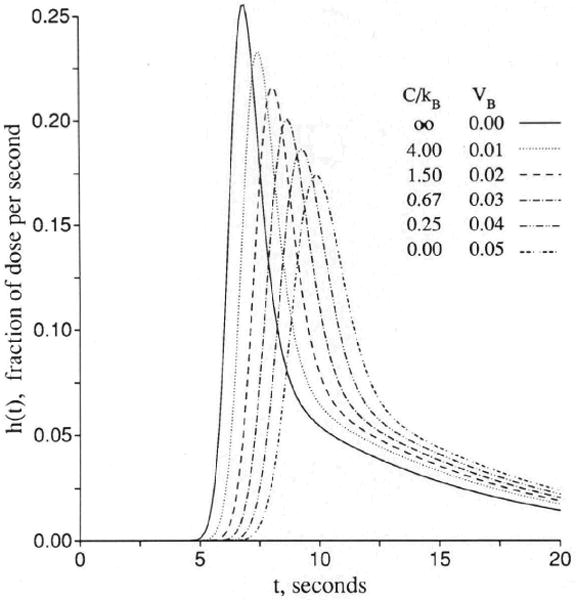
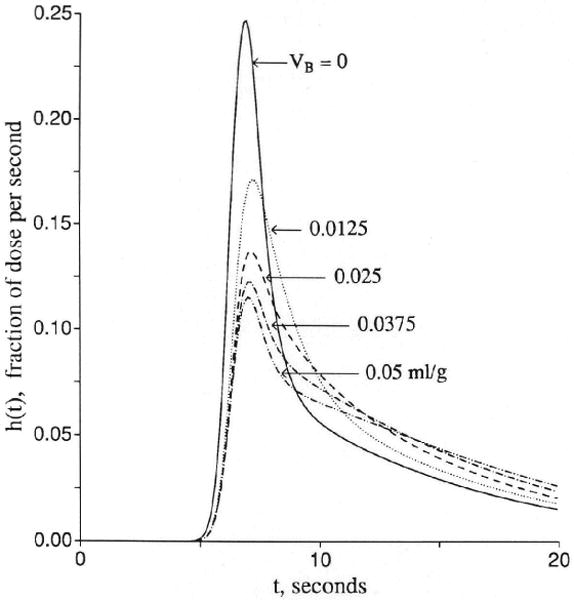
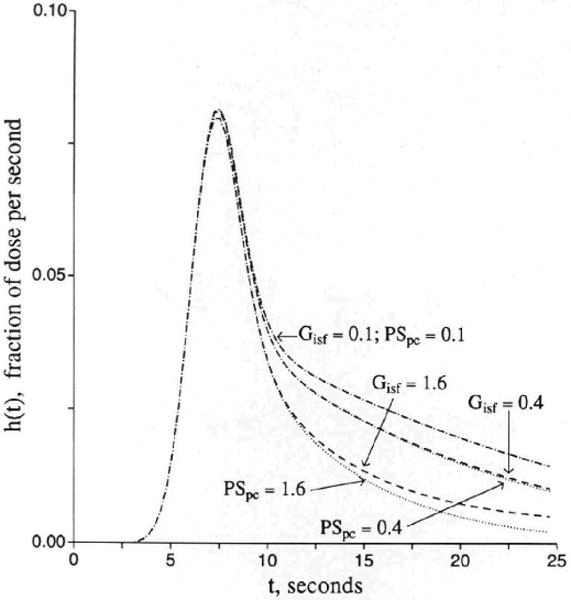
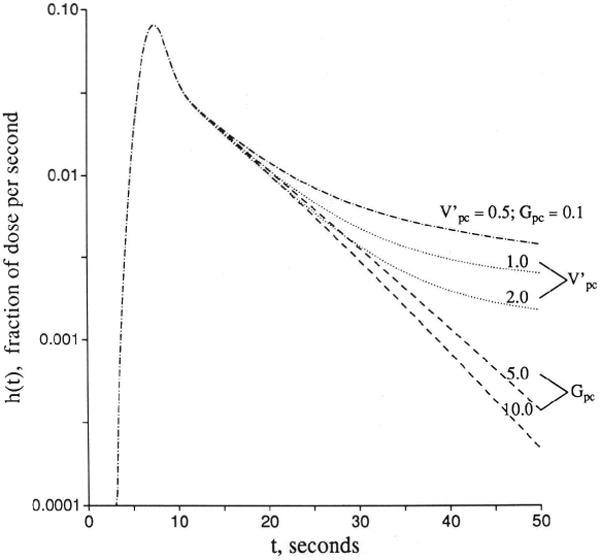
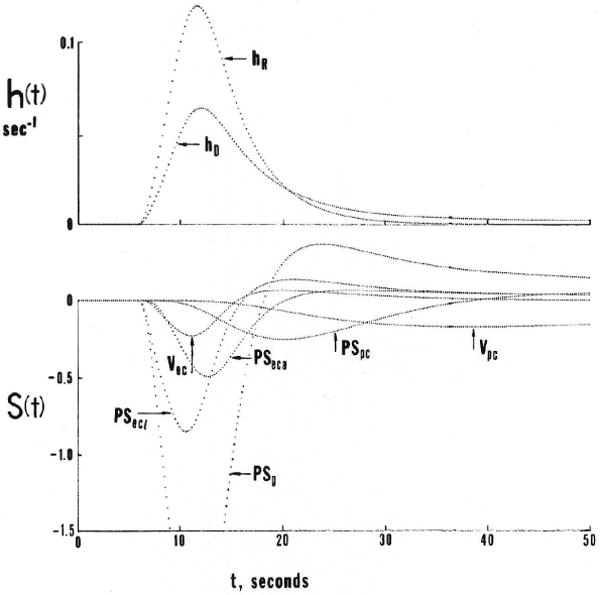
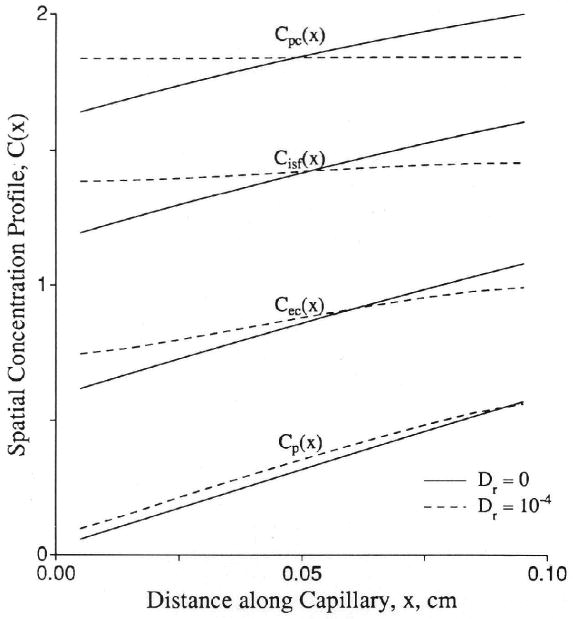
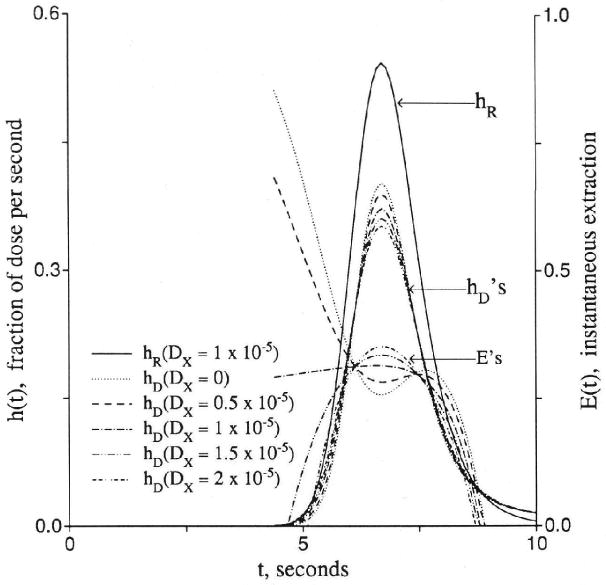
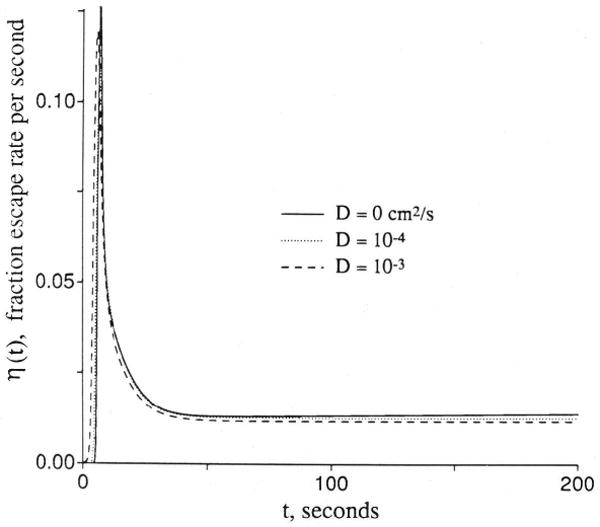
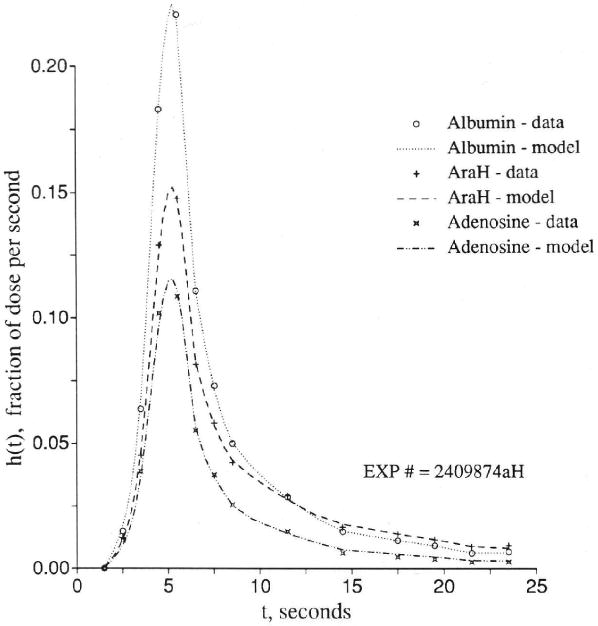
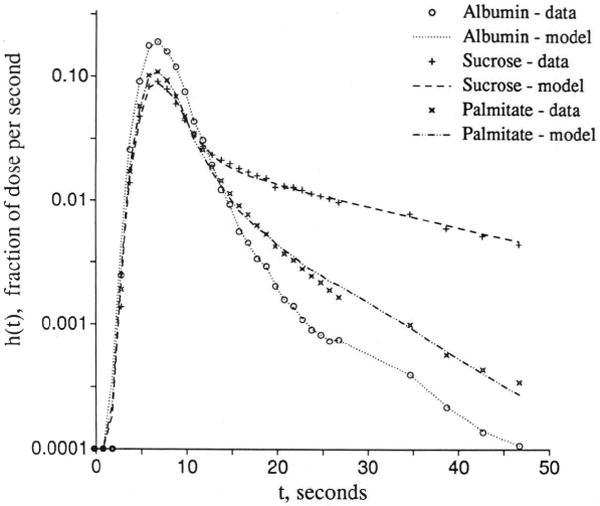
The escape of solutes from the blood during passage along capillaries in heart and skeletal muscle occurs via diffusion through clefts between endothelial cells and, for some solutes, via adsorption to or transport across the luminal plasmalemma of the endothelial cell. To quantitate the rates of permeation via these two routes of transport across capillary wall, we have developed a linear model for transendothelial transport and illustrated its suitability for the design and analysis of multiple simultaneous indicator dilution curves from an organ. Data should be obtained for at least three solutes: 1) an intravascular reference, albumin; 2) a solute transported by endothelial cells; and 3) another reference solute, of the same molecular size as solute 2, which neither binds nor traverses cell membranes. The capillary-tissue convection-permeation model is spatially distributed and accounts for axial variation in concentrations, transport through and around endothelial cells, accumulation and consumption within them, exchange with the interstitium and parenchymal cells, and heterogeneity of regional flows. The upslope of the dilution curves is highly sensitive to unidirectional rate of loss at the luminal endothelial surface. There is less sensitivity to transport across the antiluminal surface, except when endothelial retention is low. The model is useful for receptor kinetics using tracers during steady-state conditions and allows distinction between equilibrium binding and reaction rate limitations. Uptake rates at the luminal surface are readily estimated by fitting the model to the experimental dilution curves. For adenosine and fatty acids, endothelial transport accounts for 30-99% of the transcapillary extraction.


Figures

Figure 1
Figure 1
Schematic representation of four-region axially distributed single capillary-tissue unit composed of plasma at flow Fp and surrounding capillary endothelial wall, interstitial fluid space, and parenchymal cells of the organ. The Vs are volumes of distribution. Barrier conductances are given by the permeability surface area product (PS). The capillary wall is permeated by passive transport through interendothelial clefts as well as transport across the endothelial plasmalemma. Axial dispersion (D) approximately accounts for intravascular velocity profiles and molecular diffusion. Intra-regional reactions or metabolic consumption are given by the “gulosities” or clearances (G). p, plasma; g, interendothelial cleft or gap PS; ecl, luminal surface of endothelial cell; ec, endothelial cell; isf, interstitium; eca, antiluminal surface of endothelial cell; pc, parenchymal cell.
Figure 2
Figure 2
Graphs showing comparisons of outflow dilution curves [h(t)s] and apparent extractions E(t)s when an extracellular solute (subscripted E) and a test solute (subscripted D) have the same overall conductance between the plasma and interstitial fluid spaces. The input function was a lagged normal density function with a mean time of 2.0 seconds, relative dispersion of 0.4, and skewness of 0.9. U(t) is 1 − hD(t)/hE(t) and represents extraction of the test solute relative to the extracellular reference solute. Left panel: The extracellular and the endothelial permeating solutes use totally different paths. Fp = 1.0, PSgE = 0.5, PSgD = 0, PSecl = 1, PSeca = 1, and PSpc = 0 (ml/g)/min; VP=Vec=0.025ml/g, and Visf=0.15ml/g. (For definition of terms, refer to Figure 1.) Right panel: The aqueous cleft pathway provides for half the capillary permeability of the test solute. PSgD = 0.25, PSecl = 0.5, and PSeca = 0.5 (ml/g)/min, and other parameters are the same as in the left panel.
Figure 2
Figure 2
Graphs showing comparisons of outflow dilution curves [h(t)s] and apparent extractions E(t)s when an extracellular solute (subscripted E) and a test solute (subscripted D) have the same overall conductance between the plasma and interstitial fluid spaces. The input function was a lagged normal density function with a mean time of 2.0 seconds, relative dispersion of 0.4, and skewness of 0.9. U(t) is 1 − hD(t)/hE(t) and represents extraction of the test solute relative to the extracellular reference solute. Left panel: The extracellular and the endothelial permeating solutes use totally different paths. Fp = 1.0, PSgE = 0.5, PSgD = 0, PSecl = 1, PSeca = 1, and PSpc = 0 (ml/g)/min; VP=Vec=0.025ml/g, and Visf=0.15ml/g. (For definition of terms, refer to Figure 1.) Right panel: The aqueous cleft pathway provides for half the capillary permeability of the test solute. PSgD = 0.25, PSecl = 0.5, and PSeca = 0.5 (ml/g)/min, and other parameters are the same as in the left panel.
Figure 3
Figure 3
Graphs showing outflow dilution curves [h(t)s] for solute entry into three regions of the four-region capillary–endothelial cell–interstitial fluid–parenchymal cell model. hR, intravascular reference tracer; hD, test diffusible solute; hE, extracellular reference tracer. For all panels, other values were Fp=1, PSpc = 0, and all Gs = 0 (ml/g)/min and Vp = 0.05, Vec=0.05, and Visf=0.08ml/g. (For definition of terms, refer to Figure 1.) Input function was a lagged normal density function with a mean of 4.0 seconds, relative dispersion of 0.20, and skewness of 0.9. Panel 3A: With the cleft permeability PSg = 0, increasing PSecl gives increasingly rapid access to Vec and, finally, flow-limited exchange at PSecl = 1,000. Panel 3B: With finite cleft permeability, PSg = 0.5 (ml/g)/min, entry into and reflux from ISF creates a long tail, and a smaller fraction enters the endothelial cell. Panel 3C: With restricting barriers at both cleft and endothelial luminal surface, PSg = 0.5 (ml/g)/min and PSecl = 1.0 (ml/g)/min, changing PSeca has maximal effect at 8 and 20 seconds. Panel 3D: When PSecl is high, there is great sensitivity to PSeca because, at levels equal to or higher than PSg, it controls entry into ISF. At high values of PSecl and PSeca, the transport is again flow-limited, analogous to the high PSecl curves in panel 3A.
Figure 3
Figure 3
Graphs showing outflow dilution curves [h(t)s] for solute entry into three regions of the four-region capillary–endothelial cell–interstitial fluid–parenchymal cell model. hR, intravascular reference tracer; hD, test diffusible solute; hE, extracellular reference tracer. For all panels, other values were Fp=1, PSpc = 0, and all Gs = 0 (ml/g)/min and Vp = 0.05, Vec=0.05, and Visf=0.08ml/g. (For definition of terms, refer to Figure 1.) Input function was a lagged normal density function with a mean of 4.0 seconds, relative dispersion of 0.20, and skewness of 0.9. Panel 3A: With the cleft permeability PSg = 0, increasing PSecl gives increasingly rapid access to Vec and, finally, flow-limited exchange at PSecl = 1,000. Panel 3B: With finite cleft permeability, PSg = 0.5 (ml/g)/min, entry into and reflux from ISF creates a long tail, and a smaller fraction enters the endothelial cell. Panel 3C: With restricting barriers at both cleft and endothelial luminal surface, PSg = 0.5 (ml/g)/min and PSecl = 1.0 (ml/g)/min, changing PSeca has maximal effect at 8 and 20 seconds. Panel 3D: When PSecl is high, there is great sensitivity to PSeca because, at levels equal to or higher than PSg, it controls entry into ISF. At high values of PSecl and PSeca, the transport is again flow-limited, analogous to the high PSecl curves in panel 3A.
Figure 4
Figure 4
Graph showing flow-limited exchange between plasma and surrounding regions. The response hR(t) is a vascular reference curve identical to that of Figure 3. The outflow curves [h(t)s] for the permeant represent three cases with free entry and exchange with endothelial cells only (hD1), with endothelial cells plus interstitial fluid (hD2), and with all three extravascular regions (hD3). hR is the intravascular reference tracer. The mean transit time, t̄, for each case is the total volume of distribution divided by the flow Fs = 1.0 (ml/g)/min. The volumes were Vp = 0.05, Vec=0.05, Visf=0.10, and Vpc=0.2ml/g. (For definition of terms, refer to Figure 1.) Vtot is the total volume accessible to solute, ml/g.
Figure 5
Figure 5
Graphs showing contrasting effects of increasing endothelial volume (Vec) versus increasing intraendothelial gulosity or consumption (Gec) on the outflow dilution curves [h(t)s]. Control conditions (upper curves in both panels) are Fp = 1, PSg = 1, PSecl = 1, PSeca = 0, PSpc = 0, and all Gs = 0 (ml/g)/min and Vp = 0.05, Vec=0.05, and Visf=0.08ml/g. (For definition of terms, refer to Figure 1; input function is the same as in Figure 3.) Left panel: Enlarging Vec by successive multiplication by 101/2 from 0.05 to 50 ml/g has no effect on the early upslope, causes some reduction in peak height, and has its main effect on reduction of return flux in the early downslope portion. Right panel: Gec increased by successive 10-fold increases from 0.001 to 100 (ml/g)/min reduces backflux in both the early and late times after the peak.
Figure 5
Figure 5
Graphs showing contrasting effects of increasing endothelial volume (Vec) versus increasing intraendothelial gulosity or consumption (Gec) on the outflow dilution curves [h(t)s]. Control conditions (upper curves in both panels) are Fp = 1, PSg = 1, PSecl = 1, PSeca = 0, PSpc = 0, and all Gs = 0 (ml/g)/min and Vp = 0.05, Vec=0.05, and Visf=0.08ml/g. (For definition of terms, refer to Figure 1; input function is the same as in Figure 3.) Left panel: Enlarging Vec by successive multiplication by 101/2 from 0.05 to 50 ml/g has no effect on the early upslope, causes some reduction in peak height, and has its main effect on reduction of return flux in the early downslope portion. Right panel: Gec increased by successive 10-fold increases from 0.001 to 100 (ml/g)/min reduces backflux in both the early and late times after the peak.
Figure 6
Figure 6
Graphs showing receptor binding: effects of rapid equilibrative surface binding versus slow exchange with a surface receptor site in parallel with entry into endothelial cells. Left panel: An equilibrating surface binding site acts simply as an enlarged volume of distribution. Because binding and unbinding are “infinitely” rapid there is no limitation to exchange with the additional space, and the outflow curve shows a flow-limited form similar to that for which there is no binding. h(t) is the normalized outflow dilution curve. Parameters to represent surface binding are PSB = 1,000 (ml/g)/min, Vp = 0.05 ml/g, and VB = 0−0.05 ml/g; others are the same as in right panel. Right panel: Slow exchange with a receptor on the endothelial luminal surface is analogous, for tracer, with first-order exchange with another region. In these curves the tracer exchanges with both the endothelial cell and with a binding site. Both are first-order exchanges, applicable to a situation with constant concentrations of nontracer mother solute; even the transport or binding processes may be concentration dependent. The conditions for this figure are Fp = 1.0, PSecl = 1.0, PSeca = 0, PSg = 0, Gec = 0, and PSB = 1.0 (ml/g)/min, while Vec=0.08ml/g and VB varied from 0 to 0.05 ml/g. (For definition of terms, refer to Figure 1; input function is the same as in Figure 3; kB and VB are defined with Equation 52.)
Figure 6
Figure 6
Graphs showing receptor binding: effects of rapid equilibrative surface binding versus slow exchange with a surface receptor site in parallel with entry into endothelial cells. Left panel: An equilibrating surface binding site acts simply as an enlarged volume of distribution. Because binding and unbinding are “infinitely” rapid there is no limitation to exchange with the additional space, and the outflow curve shows a flow-limited form similar to that for which there is no binding. h(t) is the normalized outflow dilution curve. Parameters to represent surface binding are PSB = 1,000 (ml/g)/min, Vp = 0.05 ml/g, and VB = 0−0.05 ml/g; others are the same as in right panel. Right panel: Slow exchange with a receptor on the endothelial luminal surface is analogous, for tracer, with first-order exchange with another region. In these curves the tracer exchanges with both the endothelial cell and with a binding site. Both are first-order exchanges, applicable to a situation with constant concentrations of nontracer mother solute; even the transport or binding processes may be concentration dependent. The conditions for this figure are Fp = 1.0, PSecl = 1.0, PSeca = 0, PSg = 0, Gec = 0, and PSB = 1.0 (ml/g)/min, while Vec=0.08ml/g and VB varied from 0 to 0.05 ml/g. (For definition of terms, refer to Figure 1; input function is the same as in Figure 3; kB and VB are defined with Equation 52.)
Figure 7
Figure 7
Graph showing influence of luminal endothelial permeability (PSecl) on outflow dilution curve [h(t)] when the endothelial volume is small and antiluminal endothelial permeability is zero. hR, intravascular reference tracer. Other parameters are Vp = 0.05, Vec=0.025, Visf=0.2, and Vpc=0.5ml/g; PSg = 0.5, PSeca = 0, and PSpc = 1.0 (ml/g)/min; Fp = 1 (ml/g)/min. (For definition of terms, refer to Figure 1.)
Figure 8
Figure 8
Graph showing influences of interstitial consumption and cellular uptake on outflow dilution curve [h(t)]. Other parameters are the same as for Figure 3.
Figure 8
Figure 8
Graph showing influences of interstitial consumption and cellular uptake on outflow dilution curve [h(t)]. Other parameters are the same as for Figure 3.
Figure 9
Figure 9
Graphs showing sensitivity functions for the four-region capillary-endothelial-interstitial cell model. Upper curves show the model responses to a dispersed input function [h(t)] for both a vascular reference solute (hR) and a permeating solute hD. Lower panels show sensitivity function [S(t)] for several parameters. Left panel: PSg and PSecl are relatively low. Right panel: With higher PSg, the sensitivities to more distant events, governed by PSpc and Vpc, are increased. (For definition of terms, refer to Figure 1.)
Figure 9
Figure 9
Graphs showing sensitivity functions for the four-region capillary-endothelial-interstitial cell model. Upper curves show the model responses to a dispersed input function [h(t)] for both a vascular reference solute (hR) and a permeating solute hD. Lower panels show sensitivity function [S(t)] for several parameters. Left panel: PSg and PSecl are relatively low. Right panel: With higher PSg, the sensitivities to more distant events, governed by PSpc and Vpc, are increased. (For definition of terms, refer to Figure 1.)
Figure 10
Figure 10
Graph showing spatial concentration (C) profiles in a capillary-tissue exchange unit at t = 200 seconds. At this time, the concentration in each location relative to the peak concentration in the downstream corner remains at a constant ratio. The parameters were Fp = PSecl = PSeca = PSpc = 1.0 (ml/g)/min; PSg = 0; Vp = 0.05, Vec=0.025, Visf=0.2, and Vpc=0.5ml/g. (For definition of terms, refer to Figure 1.) Control axial diffusion (Dr) = 0 (solid lines); all Dr = 10−4 cm2/sec (dashed lines). At t = 200 seconds, the residue function is 0.044 for the control case and 0.045 for the test case. The fractional escape rates η(t) at t = 200 sec were 0.00771/sec for Dr = 0 and 0.00755/sec for Dr = 10−4 cm2/sec.
Figure 11
Figure 11
Graphs showing effects of axial diffusion (D or Dx) on the shape of outflow dilution curve [h(t)], instantaneous extraction [E(t)], and fractional escape rate [η(t)]. Upper panel: Curves for intravascular reference tracer (hR), test diffusible solute (hD), and E(t) at different ratios of intraplasma diffusion coefficients. Lower panel: Fractional escape rates η(t) = h(t)/R(t) for the permeating tracer at different diffusion coefficients. All permeability–surface area products are 1.0 (ml/g)/min.
Figure 11
Figure 11
Graphs showing effects of axial diffusion (D or Dx) on the shape of outflow dilution curve [h(t)], instantaneous extraction [E(t)], and fractional escape rate [η(t)]. Upper panel: Curves for intravascular reference tracer (hR), test diffusible solute (hD), and E(t) at different ratios of intraplasma diffusion coefficients. Lower panel: Fractional escape rates η(t) = h(t)/R(t) for the permeating tracer at different diffusion coefficients. All permeability–surface area products are 1.0 (ml/g)/min.
Figure 12
Figure 12
Graph showing adenosine, arabinofuranosyl hypoxanthine (AraH), and albumin outflow dilution curve [h(t)] in an isolated perfused guinea pig heart. Fp = 5.2 (ml/g)/min. Model-to-data coefficients of variation were 5.0% for albumin curve, 3.1% for sucrose, and 5.7% for adenosine. Flow heterogeneity was accounted for by using five capillary tissue units in parallel with a relative dispersion of 50%. Visf=0.19ml/g for AraH and adenosine. The cleft PSg was 1.34 (ml/g)/min for AraH and adenosine. Other adenosine parameters were PSecl= 2.25, PSeca = 20, Gec = 30, PSpc = 6, and Gpc = 10 (ml/g)/min, and Vpc=0.62, Vp = 0.04, and Vec=0.02ml/g (For definition of terms, refer to Figure 1.)
Figure 13
Figure 13
Graph showing palmitate uptake in the isolated rabbit heart. Outflow dilution curves [h(t)s] for albumin, sucrose, and [14C]palmitate were obtained with Krebs-Ringer perfusate containing 0.4 mM albumin and 0.4 mM total palmitate at Fp = 1.6 (ml/g)/min. Model-to-data coefficients of variation were 9.5% for albumin curve, 6.4% for sucrose, and 7.3% for adenosine. Flow heterogeneity was accounted for by five paths with a relative dispersion of 50%. Visf=0.36ml/g for sucrose. The cleft PSg was 1.31 (ml/g)/min for sucrose and 0 for palmitate. Other palmitate parameters were PSecl = 1.02, PSeca = 1.4, Gec = 0, PSpc = 2.7, and Gpc = 8.1 (ml/g)/min and Vpc=4.3, Vp = 0.04, and Vec=0.02ml/g (G. van der Vusse and S. Little, unpublished data). (For definition of terms, refer to Figure 1.)

References

    1. Rose CP, Goresky CA, Bach GG. The capillary and sarcolemmal barriers in the heart: An exploration of labeled water permeability. Circ Res. 1977;41:515–533. - PubMed
    1. Perl W, Chinard FP. A convection-diffusion model of indicator transport through an organ. Circ Res. 1968;22:273–298. - PubMed
    1. Bassingthwaighte JB, Yipintsoi BT, Knopp TJ. Diffusional arteriovenous shunting in the heart. Microvasc Res. 1984;28:233–253. - PMC - PubMed
    1. Bassingthwaighte JB. A concurrent flow model for extraction during transcapillary passage. Circ Res. 1974;35:483–503. - PMC - PubMed
    1. Kuikka J, Levin M, Bassingthwaighte JB. Multiple tracer dilution estimates of D- and 2-deoxy-D-glucose uptake by the heart. Am J Physiol. 1986;250(Heart Circ Physiol 19):H29–H42. - PMC - PubMed

Publication types