. 2016 Dec 3;16(1):1216.
doi: 10.1186/s12889-016-3887-y.

HCV prevalence can predict HIV epidemic potential among people who inject drugs: mathematical modeling analysis

Affiliations

HCV prevalence can predict HIV epidemic potential among people who inject drugs: mathematical modeling analysis

Vajiheh Akbarzadeh et al. BMC Public Health. .

Abstract

Background: Hepatitis C virus (HCV) and HIV are both transmitted through percutaneous exposures among people who inject drugs (PWID). Ecological analyses on global epidemiological data have identified a positive association between HCV and HIV prevalence among PWID. Our objective was to demonstrate how HCV prevalence can be used to predict HIV epidemic potential among PWID.

Methods: Two population-level models were constructed to simulate the evolution of HCV and HIV epidemics among PWID. The models described HCV and HIV parenteral transmission, and were solved both deterministically and stochastically.

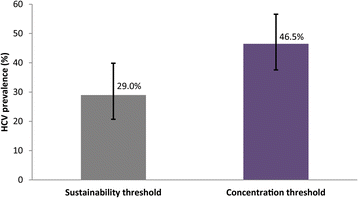
Results: The modeling results provided a good fit to the epidemiological data describing the ecological HCV and HIV association among PWID. HCV was estimated to be eight times more transmissible per shared injection than HIV. A threshold HCV prevalence of 29.0% (95% uncertainty interval (UI): 20.7-39.8) and 46.5% (95% UI: 37.6-56.6) were identified for a sustainable HIV epidemic (HIV prevalence >1%) and concentrated HIV epidemic (HIV prevalence >5%), respectively. The association between HCV and HIV was further described with six dynamical regimes depicting the overlapping epidemiology of the two infections, and was quantified using defined and estimated measures of association. Modeling predictions across a wide range of HCV prevalence indicated overall acceptable precision in predicting HIV prevalence at endemic equilibrium. Modeling predictions were found to be robust with respect to stochasticity and behavioral and biological parameter uncertainty. In an illustrative application of the methodology, the modeling predictions of endemic HIV prevalence in Iran agreed with the scale and time course of the HIV epidemic in this country.

Conclusions: Our results show that HCV prevalence can be used as a proxy biomarker of HIV epidemic potential among PWID, and that the scale and evolution of HIV epidemic expansion can be predicted with sufficient precision to inform HIV policy, programming, and resource allocation.

Keywords: HIV; Hepatitis C virus; Mathematical modeling; People who inject drugs; Prediction.


Figures

Fig. 1
Fig. 1
HCV mathematical model description, equations, and parameter definitions. The details pertaining to the force of infection can be found in Additional file 1
Fig. 2
Fig. 2
HIV mathematical model description, equations, and parameter definitions. The details pertaining to the force of infection can be found in Additional file 1
Fig. 3
Fig. 3
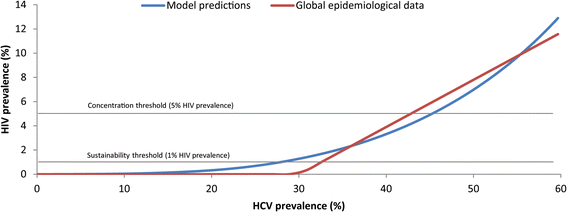
Relationship between HCV and HIV prevalence at endemic equilibrium among people who inject drugs, and model fitting to the segmented linear regression statistical model that summarizes the global epidemiological data as derived by Vickerman et al. [10]
Fig. 4
Fig. 4
Sensitivity analyses on the HCV threshold for sustainable HIV epidemic (HIV prevalence >1%). These graphs illustrate the effect, on the HCV threshold for sustainable HIV epidemic, of the HCV/HIV infectiousness ratio (a), the degree of assortative mixing (b), the scale (c) and shape (d) parameters of the gamma distribution of the population across risk groups, the exponent parameter of the power law distribution of risk behavior (e), duration of injecting (f), and anti-retroviral therapy (ART) coverage (g). For each set of parameter values in these graphs, the average injecting risk behavior was varied; endemic HCV and HIV prevalence for each value of average injecting risk behavior were generated; and the HCV threshold for sustainable HIV epidemic was identified and plotted
Fig. 5
Fig. 5
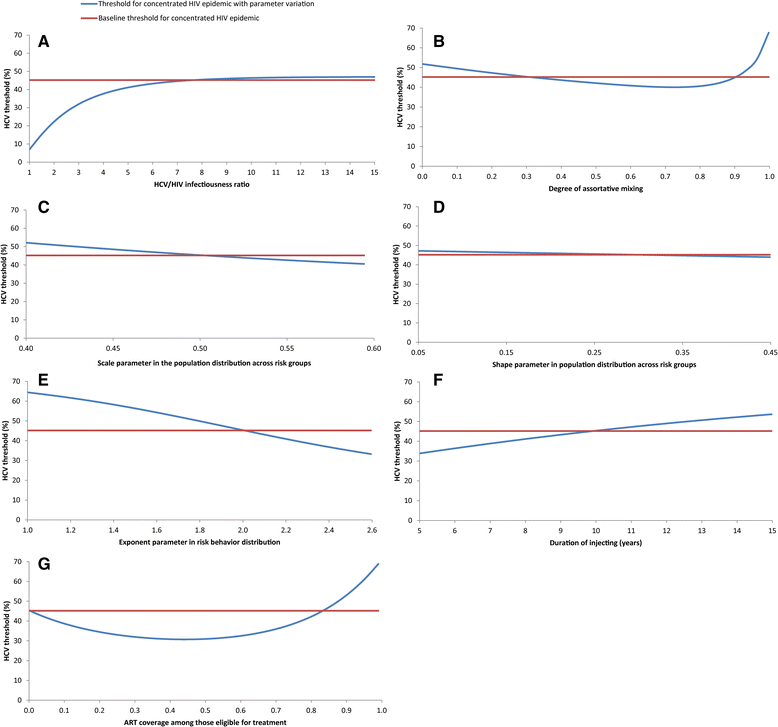
Sensitivity analyses on the HCV threshold for concentrated HIV epidemic (HIV prevalence >5%). These graphs illustrate the effect, on the HCV threshold for concentrated HIV epidemic, of the HCV/HIV infectiousness ratio (a), the degree of assortative mixing (b), the scale (c) and shape (d) parameters of the gamma distribution of the population across risk groups, the exponent parameter of the power law distribution of risk behavior (e), duration of injecting (f), and anti-retroviral therapy (ART) coverage (g). For each set of parameter values in these graphs, the average injecting risk behavior was varied; endemic HCV and HIV prevalence for each value of average injecting risk behavior were generated; and the HCV threshold for concentrated HIV epidemic was identified and plotted
Fig. 6
Fig. 6
Estimated HCV thresholds for sustainable and concentrated HIV epidemic among PWID. The error bars represent the upper and lower bounds of the 95% uncertainty interval around the predicted HCV prevalence
Fig. 7
Fig. 7
Epidemiological overlap between HCV and HIV infections among people who inject drugs. These graphs describe the epidemiological relationship between HCV and HIV infections by plotting endemic HCV and HIV prevalence (a), the risk ratio of endemic HCV to HIV prevalence (RR HCV/HIV) (b), and the odds ratio of endemic HCV to HIV prevalence (OR HCV/HIV) (c), as a function of the average injecting risk behavior (effective partnership change rate). Six epidemiological regimes linking HIV prevalence and HCV prevalence are discerned (a). The RR HCV/HIV (b) and OR HCV/HIV (c) are displayed for regimes III-VI with sustainable epidemics for both infections
Fig. 8
Fig. 8
Effect of behavioral uncertainty on the HCV predictability of HIV epidemic expansion. The graph displays, for each HCV prevalence level, the difference between the baseline prediction of HIV prevalence and 50 random predictions of HIV prevalence, at this specific HCV prevalence level, that accommodate behavioral uncertainty
Fig. 9
Fig. 9
Representative stochastic simulations of HIV epidemic expansion at different HCV endemic prevalence levels among people who inject drugs in Iran, and comparison with epidemiological data

References

    1. Anderson SJ, Cherutich P, Kilonzo N, Cremin I, Fecht D, Kimanga D, Harper M, Masha RL, Ngongo PB, Maina W, et al. Maximising the effect of combination HIV prevention through prioritisation of the people and places in greatest need: a modelling study. Lancet. 2014;384(9939):249–256. doi: 10.1016/S0140-6736(14)61053-9. - DOI - PubMed
    1. Saba HF, Kouyoumjian SP, Mumtaz GR, Abu-Raddad LJ. Characterising the progress in HIV/AIDS research in the Middle East and North Africa. Sex Transm Infect. 2013;89(Suppl 3):iii5–9. doi: 10.1136/sextrans-2012-050888. - DOI - PMC - PubMed
    1. Mumtaz GR, Weiss HA, Thomas SL, Riome S, Setayesh H, Riedner G, Semini I, Tawil O, Akala FA, Wilson D, et al. HIV among people who inject drugs in the Middle East and North Africa: systematic review and data synthesis. PLoS Med. 2014;11(6):e1001663. doi: 10.1371/journal.pmed.1001663. - DOI - PMC - PubMed
    1. Nelson K, Williams CM, editors. Infectious disease epidemiology: theory and practice, Second edition edn. Boston, MA: Jones and Barlett publishers; 2007.
    1. Cainelli F. Hepatitis C virus and human immunodeficiency virus transmission routes: differences and similarities. World J Hepatol. 2013;5(5):234–236. doi: 10.4254/wjh.v5.i5.234. - DOI - PMC - PubMed