. 2016 Dec 20;45(6):1219-1231.
doi: 10.1016/j.immuni.2016.11.004. Epub 2016 Nov 29.

Hematopoietic Stem Cell Niches Produce Lineage-Instructive Signals to Control Multipotent Progenitor Differentiation

Affiliations

Hematopoietic Stem Cell Niches Produce Lineage-Instructive Signals to Control Multipotent Progenitor Differentiation

Ana Cordeiro Gomes et al. Immunity. .

Abstract

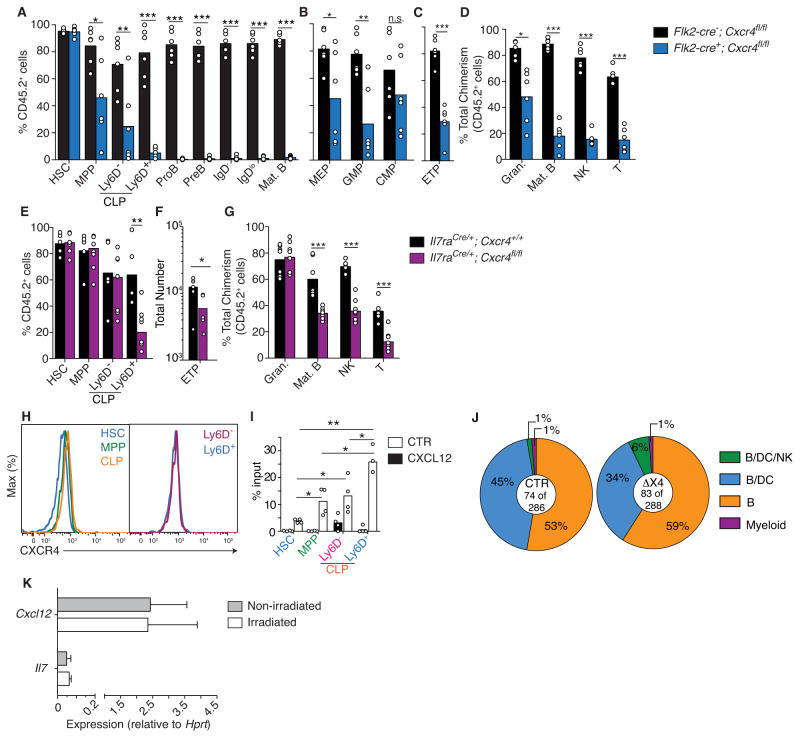
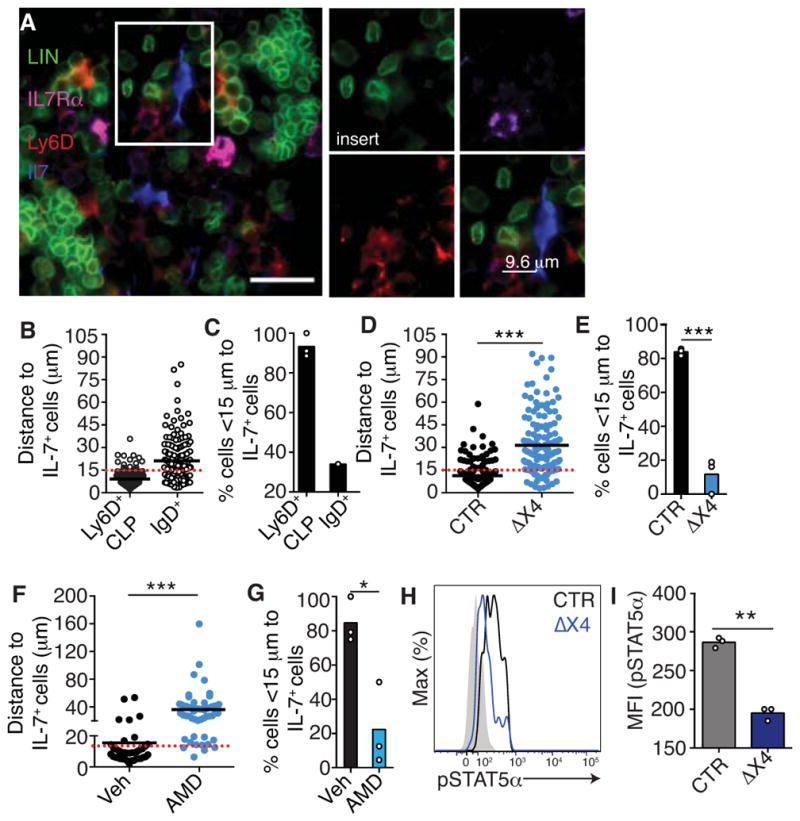
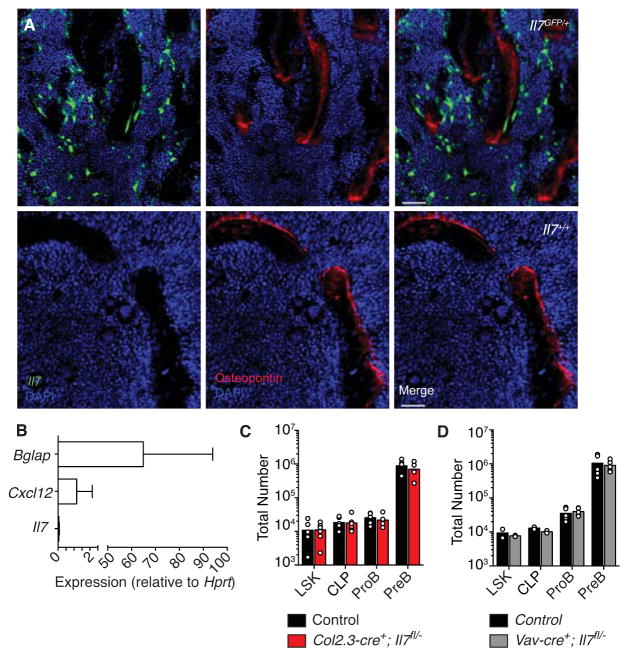
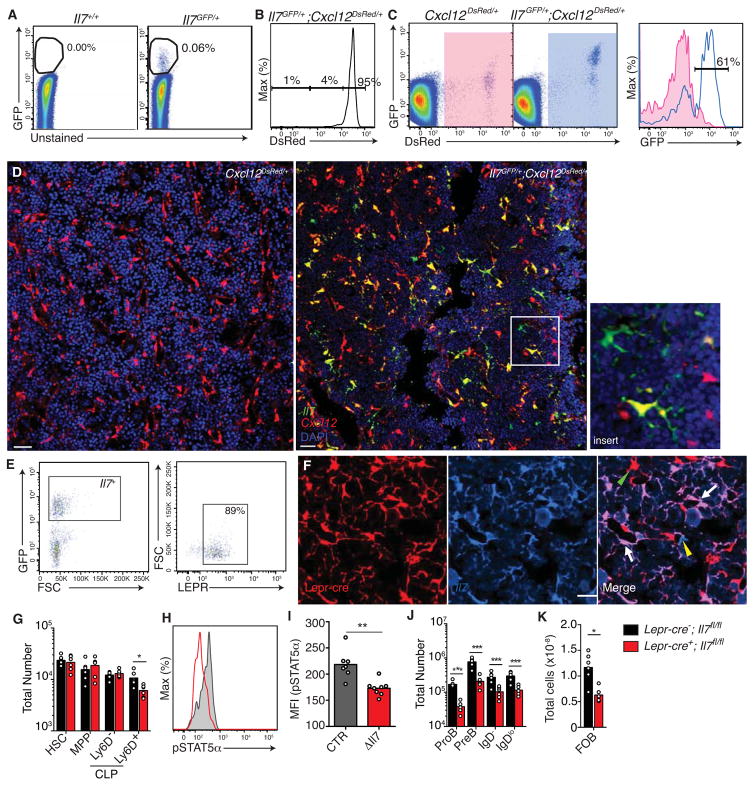
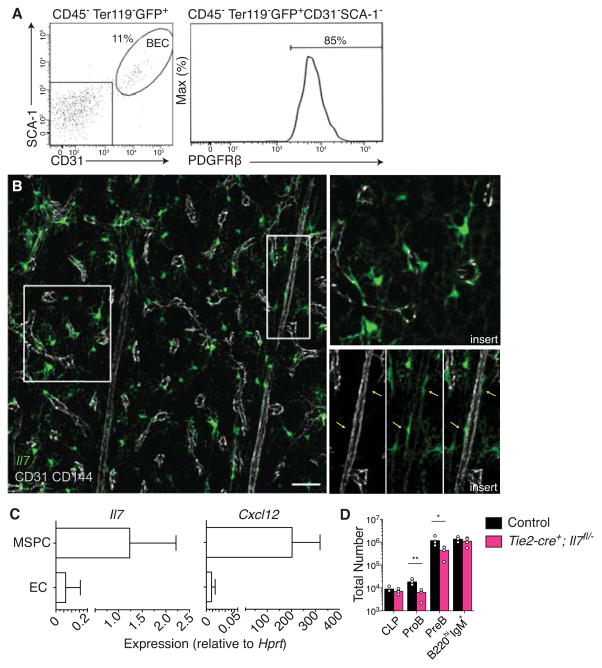
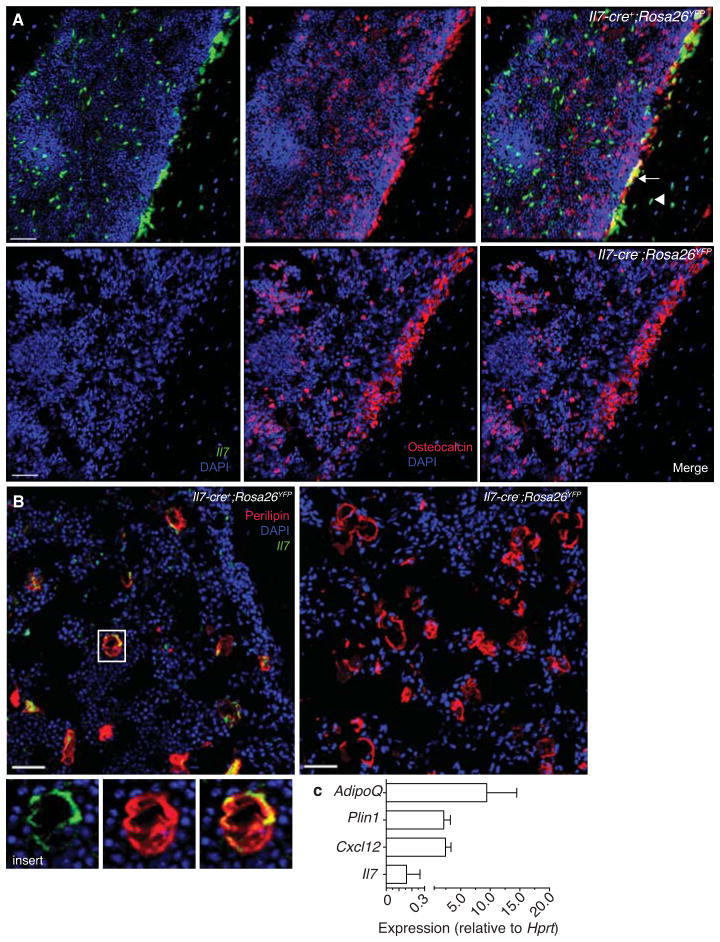
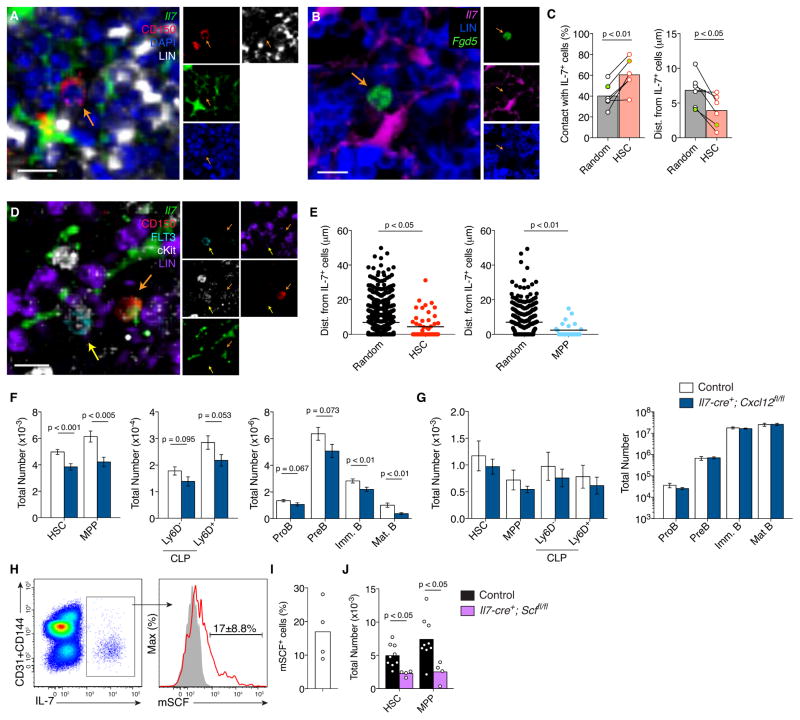
Hematopoietic stem cells (HSCs) self-renew in bone marrow niches formed by mesenchymal progenitors and endothelial cells expressing the chemokine CXCL12, but whether a separate niche instructs multipotent progenitor (MPP) differentiation remains unclear. We show that MPPs resided in HSC niches, where they encountered lineage-instructive differentiation signals. Conditional deletion of the chemokine receptor CXCR4 in MPPs reduced differentiation into common lymphoid progenitors (CLPs), which decreased lymphopoiesis. CXCR4 was required for CLP positioning near Interleukin-7+ (IL-7) cells and for optimal IL-7 receptor signaling. IL-7+ cells expressed CXCL12 and the cytokine SCF, were mesenchymal progenitors capable of differentiation into osteoblasts and adipocytes, and comprised a minor subset of sinusoidal endothelial cells. Conditional Il7 deletion in mesenchymal progenitors reduced B-lineage committed CLPs, while conditional Cxcl12 or Scf deletion from IL-7+ cells reduced HSC and MPP numbers. Thus, HSC maintenance and multilineage differentiation are distinct cell lineage decisions that are both controlled by HSC niches.


Figures

Figure 1
Figure 1. Intrinsic expression of CXCR4 in MPPs and CLPs is critical for lymphoid cell development
A–D, Frequency of CD45.2+ hematopoietic cell subsets in BM (A and B), thymus (C), and in all lymphoid organs (BM, blood, spleen, thymus, lymph nodes, Peyer’s patch, peritoneal cavity, lung and liver, D) of mice reconstituted with 90% CD45.2+ Flk2-cre;Cxcr4fl/fl or Flk2-cre+;Cxcr4fl/fl cells mixed with 10% CD45.1+ WT cells (data pooled from three independent experiments). E, Frequency of CD45.2+ HSCs, MPPs and CLP subsets in BM of mice reconstituted with 90% CD45.2+ Il7raCre/+;Cxcr4fl/fl or Il7raCre/+;Cxcr4+/+ cells and 10% WT CD45.1+ cells. F, ETP number in Il7raCre/+;Cxcr4fl/fl and control mice. G, Frequency of CD45.2+ hematopoietic cell subsets isolated from all lymphoid organs of mice reconstituted with 90% CD45.2+ Il7raCre/+; Cxcr4fl/fl or Il7raCre/+; Cxcr4+/+ cells and 10% WT CD45.1+ cells. Data are representative of 3 independent experiments with 3–6 mice in each group and each experiment. Bars indicate the average; circles depict individual mice. H, CXCR4 surface expression in HSCs, MPPs, total CLPs, and in Ly6D and Ly6D+ CLPs. I, In vitro cell chemotaxis through 5-μm transwells: nil, CXCL12 (300 ng/mL). Bars indicate mean, circles depict individual experiments. J, In vitro single cell CLP differentiation on OP-9 stromal cells for 12 days in the presence of IL-7 (50ng/mL). K, Il7 and Cxcl12 mRNA expression in non-irradiated and irradiated OP-9 stromal cells. Expression is relative to Hprt. Data in panels H–K are representative of at least 3 independent experiments. * P<0.05, **P<0.01, ***P<0.001 (unpaired, two-tailed Student’s t-test). See also Figures S1 and S2.
Figure 2
Figure 2. CXCR4 controls CLP positioning near IL-7+ cells in BM
A, 7μm-thick section of Il7-ECFP transgenic femur. Lin., IL-7Rα, Ly6D and Il7. Scale bar, 20 μm. B, Ly6D+ CLP (n=166), IgD+ (n=164), and IL-7+ cell distribution in BM. C, Ly6D+ CLP and IgD+ cell frequency near IL-7+ cells (<15 μm). D and E, Distribution of Flk2-cre+;Cxcr4fl/fl (ΔX4) or Flk2-cre;Cxcr4fl/fl (CTR) Ly6D+ CLPs, and IL-7+ cells (D); cell frequency near IL-7+ cells (<15 μm) (E). F and G, Distribution of Ly6D+ CLPs and IL-7+ cells after AMD3100 (AMD) or vehicle (Veh) treatment for 3 days (F). Cell frequency near IL-7+ cells (<15 μm) (G). Data in panels AG are representative of 2–3 independent experiments. H and I, pSTAT5a in Il7raCre/+;Cxcr4fl/+ (CTR) and Il7raCre/+;Cxcr4fl/fl (ΔX4), Ly6D+ CLPs. Shaded histogram shows pSTAT5α in Ly6D+ CLPs isolated from Il7−/− mice. (H). pSTAT5α geometric mean intensity (I). Data in panels H and I are representative of two independent experiments with at least 3 mice in each group per experiment. Bars indicate mean; circles depict individual mice. * P<0.05, **P<0.01, ***P<0.001 (unpaired, two-tailed Student’s t-test). See also Figure S3.
Figure 3
Figure 3. Osteoblast-derived IL-7 is not required for B-lymphopoiesis
A, Distribution of IL-7+ and osteopontin+ cells in BM. B, Bglap (osteocalcin), Cxcl12, and Il7 expression in osteoblasts by qPCR. Gene expression is relative to Hprt. Data in A and B are representative of 3–5 independent experiments. C, Total number of hematopoietic cell subsets in BM of Il7fl/−; Col2.3-cre+ mice and control littermates. D, Total number of hematopoietic cell subsets in BM of Il7fl/−; Vav-cre+ mice and control littermates. Bars indicate average, circles depict individual mice. Data panels C and D are representative of at least 3 independent experiments with 4–6 mice per group. See also Figure S4.
Figure 4
Figure 4. Most IL-7+ cells are a subset of CXCL12-abundant reticular cells
A, Frequency of IL-7+ cells in BM. B, Cxcl12 expression in IL-7+ CD45 cells. C, Cxcl12 and Il7 expression in CD45 cells (left and middle). Il7 expression in Cxcl12+ cells (right). D, 25μm-thick section of Il7GFP/+;Cxcl12DsRed/+ mouse femur stained to detect IL-7+ cells. CXCL12+ cells were directly visualized. Scale bar is 50 μm. Insert, example of an IL-7+ CXCL12 cell, and of an IL-7+ CXCL12+ cell. E Left, gated IL-7+ cells; right, LEPR expression in gated IL-7+ cells. Data in panels A–D is representative of more than 5 mice analyzed. F, Lineage mapping of Il7 expressing cells using Lepr-cre transgenic mice. 8 μm-thick femur section of Lepr-cre; Rosa26tdtomato/+; Il7GFP/+ mice. Scale bar is 50 μm. Arrow and arrowhead indicate Lepr-cre-derived IL-7+ cells and Lepr-cre-derived IL-7 cells respectively. Yellow arrow indicates IL-7+ Lepr-cre cells. Data are representative of 2 independent experiments. G, HSC, MPP, and CLP number in BM of Lepr-cre+; Il7fl/fl and Lepr-cre; Il7fl/fl mice. H, histogram of pSTAT5α in Ly6D+ CLPs from Lepr-cre+; Il7fl/fl and Lepr-cre; Il7fl/fl mice. I, pSTAT5α geometric mean intensity in Ly6D+ CLPs in Lepr-cre; Il7fl/fl mice and in Lepr-cre+; Il7fl/fl (ΔIl7) mice. J and K, Developing B cell numbers in BM (J); splenic B cells (K) in Lepr-cre+; Il7fl/fl and Lepr-cre; Il7fl/fl mice. In panels G, I, J and K, bars indicate mean, circles depict individual mice. Data are representative of 2 independent experiments with 4–6 mice per group. * P<0.05, **P<0.01, ***P<0.001 (unpaired, two-tailed Student’s t-test). See also Figure S5.
Figure 5
Figure 5. Endothelial cell-derived IL-7 contributes to B cell development
A, Flow cytometric analysis of SCA-1 and CD31 expression in IL-7+ BM cells. Blood endothelial cells (BECs). B, Il7 colocalization with CD31 and VE-Cadherin. Scale bar is 50 μm. Data are representative of more than 5 mice analyzed. C, Il7 and Cxcl12 expression in FACS sorted CD45Ter119CD144CD31LEPR+ MSPCs and endothelial cells (ECs, CD45Ter119CD144+CD31+LEPR). Gene expression is relative to Hprt. Bars indicate average ± SD of 3-independent cell sorting experiments. D, Total number of hematopoietic cell subsets in BM of Il7fl/; Tie2-cre+ mice and control littermates. Bars indicate average, circles depict individual mice. Data are representative of 2 independent experiments with 4–6 mice per group. * P<0.05, (unpaired, two-tailed Student’s t-test). See also Figure S6.
Figure 6
Figure 6. IL-7+ BM cells are mesenchymal progenitor cells
A, 25μm-thick sections of Il7-cre; Rosa26YFP/+ or control mouse femurs stained to detect osteocalcin+ cells and YFP+ cells. Arrow indicates osteoblasts derived from IL-7+ cells, arrowhead indicates osteocyte derived from IL-7+ cell. Scale bar is 50 μm. B, 25μm-thick sections of irradiated Il7-cre; Rosa26YFP/+ or control mouse femurs stained to detect perilipin+ cells and YFP+ cells. Scale bar is 50 μm. Insert shows Il7-cre-derived adipocyte. C, Adipoq, Plin1, Cxcl12, and Il7 mRNA expression in adipocytes. mRNA expression is relative to Hprt. Data in all panels are representative of two independent experiments.
Figure 7
Figure 7. HSCs and MPPs reside in, and are maintained by, niches formed by IL-7+ cells
A, Femur whole-mount from Il7-ECFP mice stained with antibodies to detect CFP, lineage, nuclei (DAPI), and CD150. Scale bar is 10 μm. Orange arrow indicates HSC. B, Femur whole-mount from Il7-ECFP mice transplanted with Fgd5Zsgreen/+ BM cells stained with antibodies to detect CFP and lineage (blue). Zsgreen+ cells were directly visualized. Scale bar is 10 μm. Orange arrow indicates HSC. C, Quantification of HSCs and randomly selected cells in contact with IL-7+ (CFP+) BM cells (left), and average distances to nearest IL-7+ cell (right). Circles indicate average of at least 9 HSCs or > 100 randomly selected cells in individual mice analyzed. Green filled circle indicates chimera from Fgd5Zsgreen/+ BM; lines connect random cells and observed HSCs in individual mice. Statistical significance calculated with paired t test. D, Femur whole-mount section from Il7-ECFP mice stained with antibodies to detect CFP, lineage, cKit, FLT3, and CD150. Scale bar is 10 μm. Orange arrow indicates HSC; yellow arrow indicates MPP. E, Quantification of cell distance to nearest IL-7+ cell: HSCs (n = 52), MPPs (n = 25) and randomly selected cells. Circles indicate individual cells analyzed from 5 independent experiments for HSCs, and 2 independent experiments for MPPs. Statistical significance calculated with unpaired t test. F and G, Enumeration of hematopoietic cell subsets in BM (n=15–20) (F) and spleen (n=9) (G) of Il7-cre+; Cxcl12fl/fl and littermate controls. Bars indicate the mean±S.E.M. Statistical significance calculated with unpaired t test. H, Membrane-bound SCF expression in IL-7+ BM cells. Left panel indicates CD31+CD144 expression versus IL-7-GFP in gated live CD45+Ter119 BM cells. Right panel shows mSCF expression in gated IL-7+ cells; filled histogram is staining control. I, Frequency of mSCF+ cells within the IL-7+ BM cell gate. Bar indicates average, circles represent individual mice analyzed. J, Enumeration of HSCs and MPPs in BM of Il7-cre+; Scffl/fl mice and littermate controls. Bars indicate the mean, circles depict individual mice analyzed. Statistical significance calculated with unpaired t test. See also Figure S7.

Comment in

References

    1. Ara T, Tokoyoda K, Sugiyama T, Egawa T, Kawabata K, Nagasawa T. Long-term hematopoietic stem cells require stromal cell-derived factor-1 for colonizing bone marrow during ontogeny. Immunity. 2003;19:257–267. - PubMed
    1. Avecilla ST, Hattori K, Heissig B, Tejada R, Liao F, Shido K, Jin DK, Dias S, Zhang F, Hartman TE, et al. Chemokine-mediated interaction of hematopoietic progenitors with the bone marrow vascular niche is required for thrombopoiesis. Nat Med. 2004;10:64–71. - PubMed
    1. Beck TC, Gomes AC, Cyster JG, Pereira JP. CXCR4 and a cell-extrinsic mechanism control immature B lymphocyte egress from bone marrow. The Journal of experimental medicine. 2014;211:2567–2581. - PMC - PubMed
    1. Boyer SW, Schroeder AV, Smith-Berdan S, Forsberg EC. All hematopoietic cells develop from hematopoietic stem cells through Flk2/Flt3-positive progenitor cells. Cell Stem Cell. 2011;9:64–73. - PMC - PubMed
    1. Bryon PA, Gentilhomme O, Fiere D. Histomorphometric analysis of bone-marrow adipose density and heterogeneity in myeloid aplasia and dysplasia (author’s transl) Pathol Biol (Paris) 1979;27:209–213. - PubMed

Publication types