. 2017 Feb;16(2):310-326.
doi: 10.1074/mcp.O116.065219. Epub 2016 Dec 2.

A Proteomic Approach to Analyze the Aspirin-mediated Lysine Acetylome

Affiliations

A Proteomic Approach to Analyze the Aspirin-mediated Lysine Acetylome

Michael H Tatham et al. Mol Cell Proteomics. 2017 Feb.

Abstract

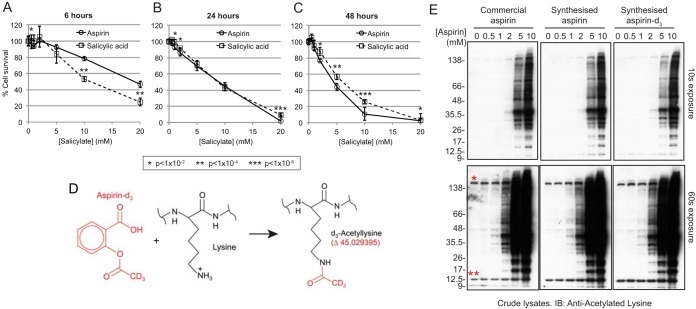
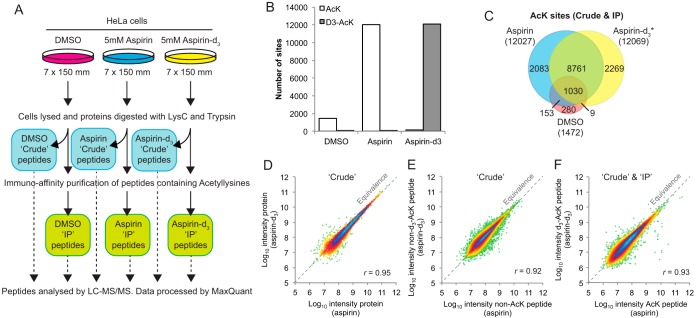
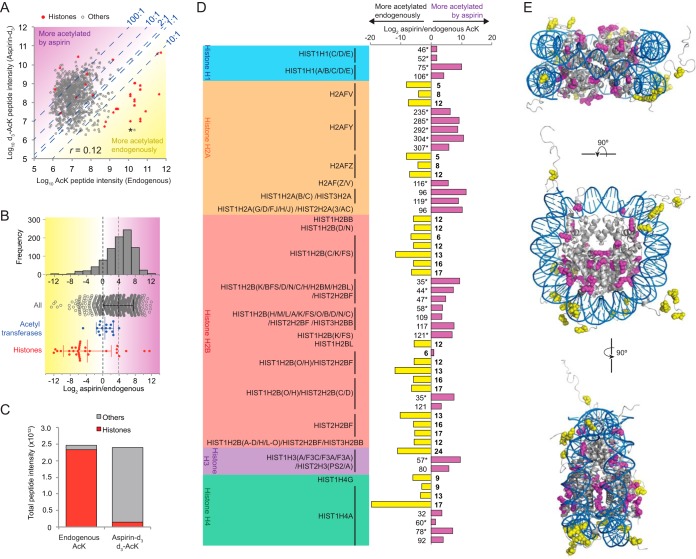
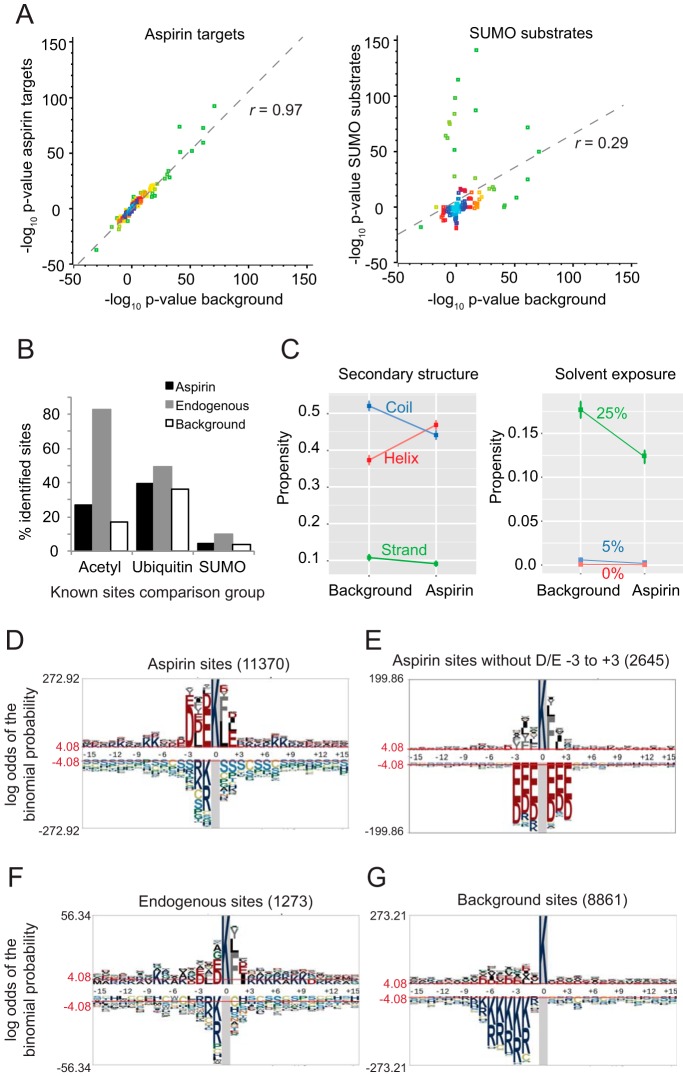
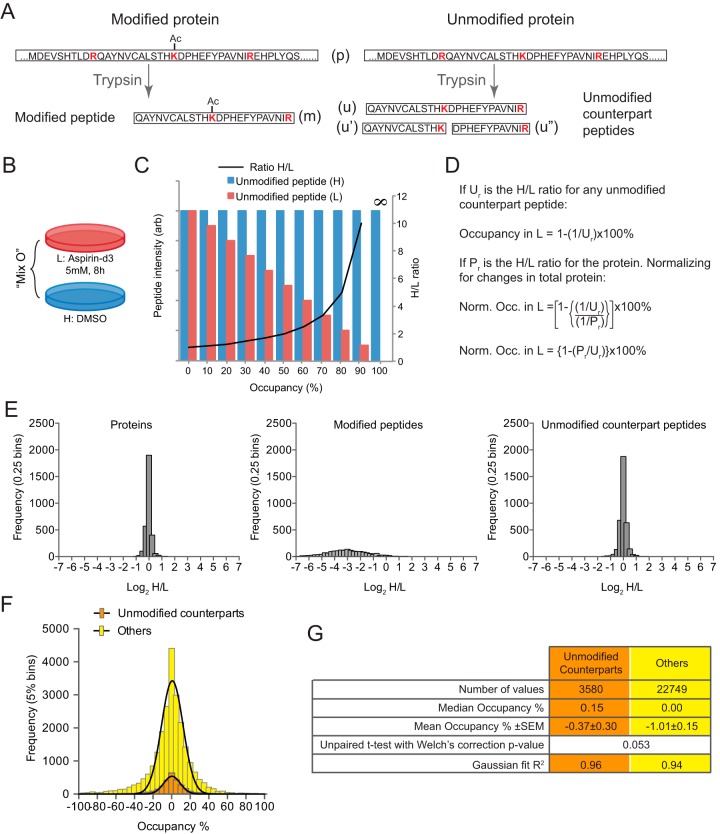
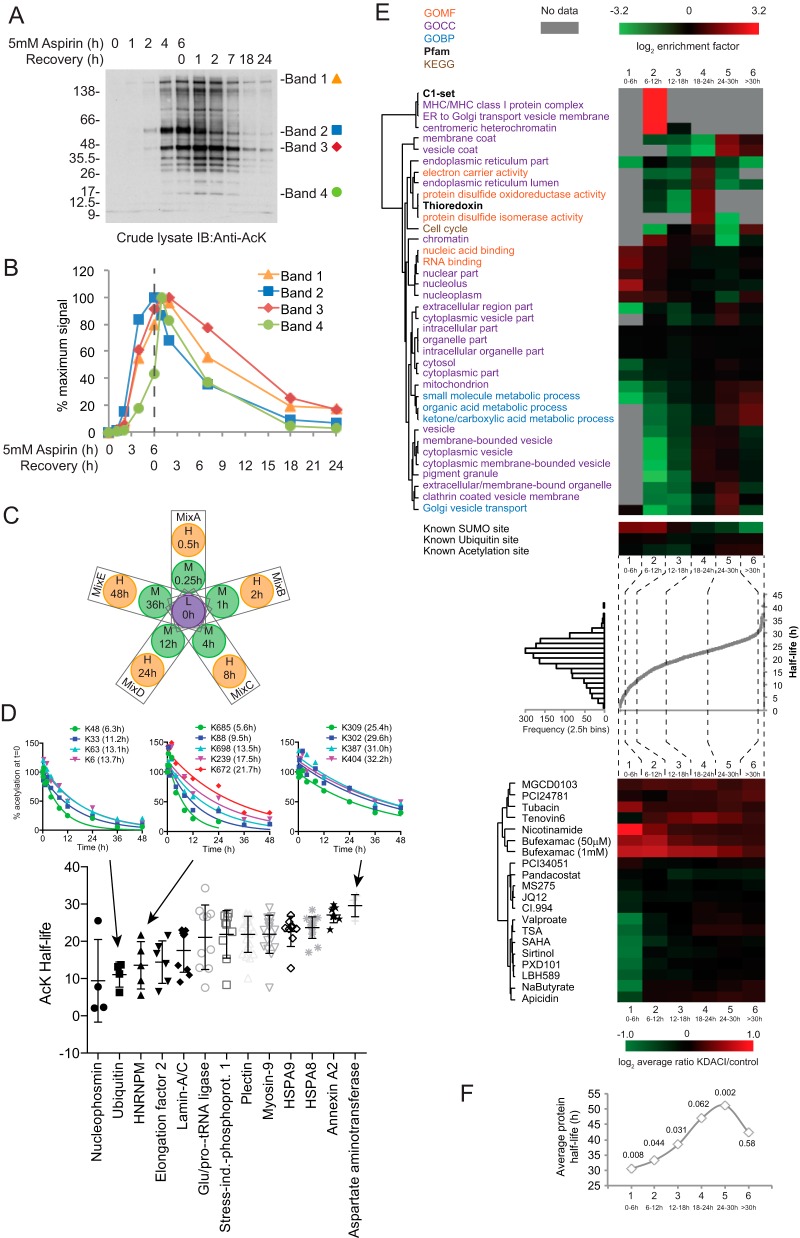
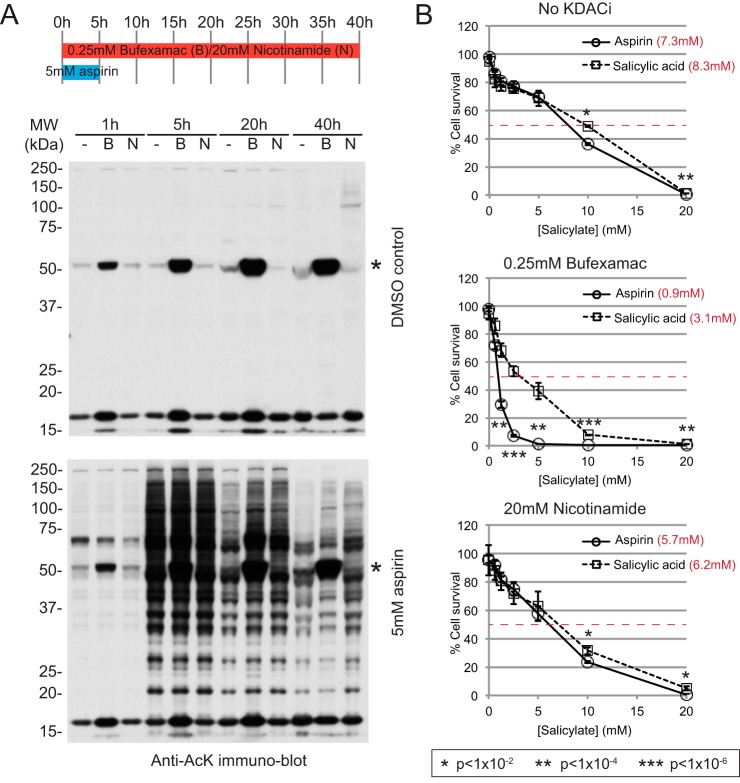
Aspirin, or acetylsalicylic acid is widely used to control pain, inflammation and fever. Important to this function is its ability to irreversibly acetylate cyclooxygenases at active site serines. Aspirin has the potential to acetylate other amino acid side-chains, leading to the possibility that aspirin-mediated lysine acetylation could explain some of its as-yet unexplained drug actions or side-effects. Using isotopically labeled aspirin-d3, in combination with acetylated lysine purification and LC-MS/MS, we identified over 12000 sites of lysine acetylation from cultured human cells. Although aspirin amplifies endogenous acetylation signals at the majority of detectable endogenous sites, cells tolerate aspirin mediated acetylation very well unless cellular deacetylases are inhibited. Although most endogenous acetylations are amplified by orders of magnitude, lysine acetylation site occupancies remain very low even after high doses of aspirin. This work shows that while aspirin has enormous potential to alter protein function, in the majority of cases aspirin-mediated acetylations do not accumulate to levels likely to elicit biological effects. These findings are consistent with an emerging model for cellular acetylation whereby stoichiometry correlates with biological relevance, and deacetylases act to minimize the biological consequences of nonspecific chemical acetylations.


Figures

Fig. 1.
Fig. 1.
Aspirin-d3 acetylates proteins in cultured cells. A–C, Survival assays comparing aspirin and salicylic acid for death of HeLa cells over a range of concentrations from 0.5 to 20 mm, and over a range of durations; 6 h (A), 24 h (B), and 48 h (C). Four replicates were averaged and standard deviations are indicated as error bars. t test p values are indicated by asterisks (see below panel B). D, Schematic overview of the acetylation of the ε-amino-group on lysine side-chains by aspirin-d3. The acetyl-d3 group is distinguishable from the non-deuterated equivalent by ∼3 Da. E, Anti-acetylated lysine immunoblot analysis of crude cell lysates from HeLa cells exposed to the indicated concentrations of commercially sourced aspirin, in house synthesized unlabeled aspirin or in-house synthesized aspirin-d3 for 4 h. Single and double asterisks indicate positions of the most abundantly acetylated proteins in untreated cells (discussed further in relation to Fig. 3A).
Fig. 2.
Fig. 2.
Aspirin-d3 has identical lysine acetylation activity to isotopically typical aspirin but creates a unique acetylation signal. A, Overview of the experiment to identify protein targets of aspirin-mediated lysine acetylation. B, Summary of numbers of AcK and d3-AcK sites identified in peptide preparations from the three cell treatments. C, Summary of overlap between experiments for identified acetylated lysine sites. * Only d3-Acetyllysines considered. Note; acetylation site lists from cells treated with unlabeled aspirin will contain both endogenous acetylated lysines as well as those acetylated by aspirin. D, Comparison between aspirin and aspirin-d3 treated cells for protein intensity in “Crude” extracts measured by mass spectrometry. E, As in D, except comparing the intensity of nonacetylated peptides. F, As in D, except comparing the intensity of AcK and d3-AcK peptides peptides in IPs from aspirin and d3-aspirin treated cells respectively. x = y line shown in D, E, and F.
Fig. 3.
Fig. 3.
Aspirin enhances acetylation site occupancy for the majority of endogenous sites excepting Histone N-terminal tails. A, Scatter plot comparing intensities of acetylated peptides in DMSO treated cells (endogenous acetylation) with d3-acetylated peptides from aspirin-d3 treated cells. Total number of common sites was 1039, with 36 histone sites (red). Asterisk marks the acetylated peptide of K106 from SMC3. Note, scale is log10. Lines of equivalence (1:1) and intensity ratios of 2:1, 10:1, and 100:1 (aspirin-d3-AcK:endogenous AcK) are indicated. B, Ratio of acetylated peptide intensities for sites found both endogenously acetylated and acetylated by aspirin. Upper portion shows a frequency histogram of all ratios and lower section shows a Beeswarm plot of the same data including subsections for proteins involved in cellular acetylation and histone proteins. C, Proportion of total AcK peptide intensity derived from histone acetylation in untreated cells and d3-AcK peptide intensity from those treated with aspirin-d3. Note, non-log scale. D, Log2 values for the ratio aspirin-d3:endogenous AcK intensity for histone proteins. Ratios for peptides detected only in the aspirin-d3 treated cells were created by defining absent endogenous peptides with an intensity of 500,000, and are indicated by asterisk (*) Magenta bars are more acetylated with aspirin and yellow more acetylated endogenously. Residue numbers are indicaded, with bold representing those found in N-terminal tails. E, Mapping onto the structure of the nucleosome (PDB 1KX5) (53) of histone acetylation sites that are either more acetylated endogenously than by aspirin (yellow), or more acetylated by aspirin than endogenously (magenta). Modified lysines are shown with atoms as spheres with the remainder of the protein structure shown in gray schemtic format. DNA is shown in blue.
Fig. 4.
Fig. 4.
The abundance of aspirin-mediated acetylations are linked to total protein abundance. A, Comparison between a crude cell MS-based proteome (background) and proteins identified as aspirin acetylation targets for enrichment of GO terms (left chart). The same comparison for SUMO sites (right chart) is also made for reference purposes. GO analysis for cellular component, biological process, and molecular function was calculated using Panther (54), and each GO term is represented as a data point. Over-representations are plotted as positive values and under-representations as negative. Data best-fit lines (broken gray) and Pearson correlation coefficients are indicated. Data points are colored by density from cyan (high density), through blue, red and yellow, to green (low density). B, Comparisons of the aspirin lysine acetylome with other large scale lysine PTM studies; endogenous acetylation, endogenous ubiquitination and exogenous SUMOylation (data from phosphosite plus (37) and references (28, 29). C, Comparison of Jpred (38) predicted secondary structure propensity (left), and predicted solvent exposure (right) between the aspirin lysine acetylome and a background control group of lysine-containing peptides detected from a crude HeLa extract proteome. The majority of lysines in both groups are predicted to be >25% solvent exposed. D–G, pLogo site analysis (24) for the indicated groups of lysines found acetylated by aspirin (D, E), endogenously modified (F) or the background set of lysines described in C (G). p value <0.05 cutoff is shown broken red. Note different y axis scales.
Fig. 5.
Fig. 5.
The lysine site occupancy of aspirin-mediated acetylations is very low. A, For a protein (p) acetylated at lysine (K), digestion by trypsin yields a modified peptide (m). The unmodified protein can yield two unmodified counterpart peptides (u′ and u″), and if cleavage after the target lysine is missed, another unmodified counterpart peptide (u). B, A SILAC experiment designed to allow aspirin-mediated lysine acetylation site occupancy calculation. C, Example of relative abundances of heavy and light forms of an unmodified counterpart peptide for modifications at different % occupancy expected from the experiment shown in B. Solid black line shows the resultant H/L ratios at each % occupancy example. D, An equation to determine aspirin-mediated acetylation occupancy from the experiment shown in B. E, Frequency distributions of log2H/L ratios for total protein, unmodified counterpart peptides and modified peptides from the experiment shown in part B. Modified peptide ratios are generated by MaxQuant requantification due to zero intensity in the DMSO treated condition. Note, high occupancy sites would yield positive values for u, u′ and u″ peptide log2H/L ratios. F, Frequency distributions of occupancy calculations based on the data shown in part E (orange) in comparison with a control set of peptides thought not to be unmodified counterparts (yellow). G, Statistical analysis from data presented in F. Although median and average occupancies are calculated to be fractionally higher for counterpart peptides than non-counterparts, the difference is not statistically significant, indicating that for the vast majority of acetylated lysines, occupancy is so low as to be immeasurable by this analysis.
Fig. 6.
Fig. 6.
Half-lives of aspirin-mediated lysine acetylation signals. A, Anti-AcK immunoblot of 6.25 μg (protein) crude cell lystes from HeLa cells treated with 5 mm aspirin for the indicated times, before change to medium lacking aspirin (recovery). Bands selected for semi-quantitative analysis in B, are indicated. B, Densitometry quantitation of the data shown in part A for four selected bands. C, Design of a SILAC experiment to study half-lives of lysine acetylations by aspirin. L- light, M- medium and H - heavy lysine/arginine isotope containing culture medium. D, Half-lives of selected proteins with multiple site data. E, Analysis of 1480 aspirin acetylation sites data by separation into six sub-sections (1, 0–6 h, n = 47; 2, 6–12 h, n = 135; 3,12–18 h, n = 287; 4, 18–24 h, n = 541; 5, 24–30 h, n = 421; and 6, >30 h, n = 49) on the basis of half-life as shown in the central scatter plot and lateral histogram. Large upper heatmap shows hierarchial clustering of GO, Pfam and KEGG terms enriched in the six sub-sections. Only groups with a Benjamini-Hochberg FDR <1% in at least one subsection were included in the figure. Multiple sites from the same protein were considered as separate entries. Enrichments calculated in Perseus using Fishers exact test. Small, upper heatmap shows the same analysis for enrichment of sites already described as being modified by SUMO-2, ubiquitin or acetylation. Lower heatmap shows hierarchical clustering of sub-section average log2 lysine deacetylase inhibitor KDACI/control ratios for lysine sites identified in common between this study and those endogenous acetylations described in ref (43). F, Scatter plots show average protein half-life per subsection as described in reference (30). p values according to t test comparisons with equally sized control groups of randomly selected data are indicated.
Fig. 7.
Fig. 7.
Bufexamac enhances aspirin-mediated cytotoxicity. A, Upper schematic shows experimental timings. In six-well-plates, ∼40% confluent HeLa cells were exposed to either 5 mm aspirin, or DMSO control, along with the KDAC inhibitors bufexamac (0.25 mm) or Nicotinamide (20 mm) or DMSO control (-). Aspirin treatment was ceased after 5 h by replacment of media for that containing only the KDACi drugs. For each well, cells were lysed in 210 μl Laemmli's sample buffer plus 0.7 m 2-mercaptoethanol, before boiling and sonication. 30 μl of each sample was fractionated on a denaturing 10% polyacrylamide gel before immunoblotting for acetylated lysines as described under M&M. Equal volume loading rather than equal protein loading was used to avoid the complication of acetylated lysine signal dilution by differential cell growth rates caused by KDAC inhibitors. Asterisk (*) species is most likely to be acetylated tubulin. B, HeLa cell survival assays comparing aspirin and salicylic acid for cytotoxicity over a range of concentrations from 0.63 to 20 mm, over 24 h incubation. Cells were exposed to no KDAC inhibitor, or 0.25 mm bufexamac, or 20 mm nicotinamide. Four replicates were averaged and standard deviations are indicated as error bars. t test p values comparing aspirin with salicylic acid are indicated by asterisks. Calculated concentrations required to kill 50% of cells are indicated in red.

References

    1. Vane J. R., and Botting R. M. (2003) The mechanism of action of aspirin. Thromb. Res. 110, 255–258 - PubMed
    1. Brayfield A., ed. (2014) Martindale: The Complete Drug Reference., 38 ed., Pharmaceutical Press
    1. Algra A. M., and Rothwell P. M. (2012) Effects of regular aspirin on long-term cancer incidence and metastasis: a systematic comparison of evidence from observational studies versus randomised trials. Lancet Oncol. 13, 518–527 - PubMed
    1. Rothwell P. M., Price J. F., Fowkes F. G., Zanchetti A., Roncaglioni M. C., Tognoni G., Lee R., Belch J. F., Wilson M., Mehta Z., and Meade T. W. (2012) Short-term effects of daily aspirin on cancer incidence, mortality, and non-vascular death: analysis of the time course of risks and benefits in 51 randomised controlled trials. Lancet 379, 1602–1612 - PubMed
    1. Rothwell P. M., Wilson M., Price J. F., Belch J. F., Meade T. W., and Mehta Z. (2012) Effect of daily aspirin on risk of cancer metastasis: a study of incident cancers during randomised controlled trials. Lancet 379, 1591–1601 - PubMed

Publication types

Associated data