

QSEA-modelling of genome-wide DNA methylation from sequencing enrichment experiments
- PMID: 27913729
- PMCID: PMC5389680
- DOI: 10.1093/nar/gkw1193
QSEA-modelling of genome-wide DNA methylation from sequencing enrichment experiments
Abstract
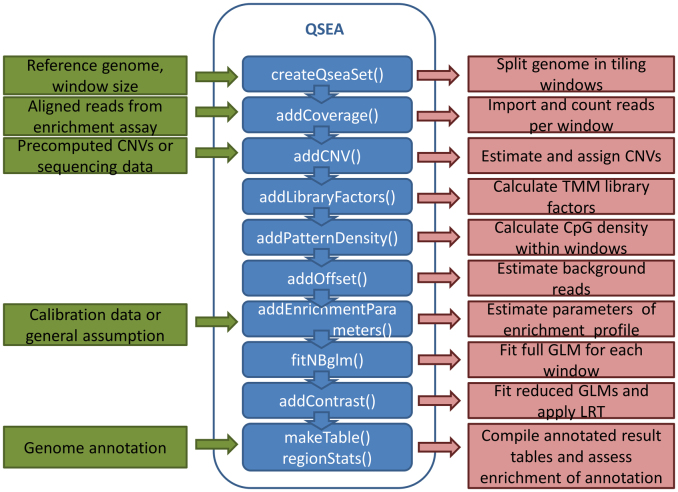
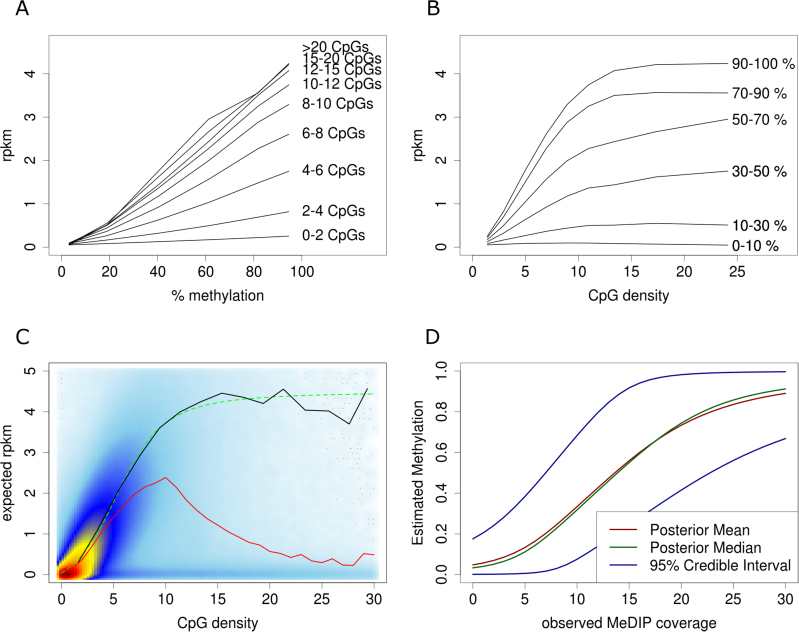
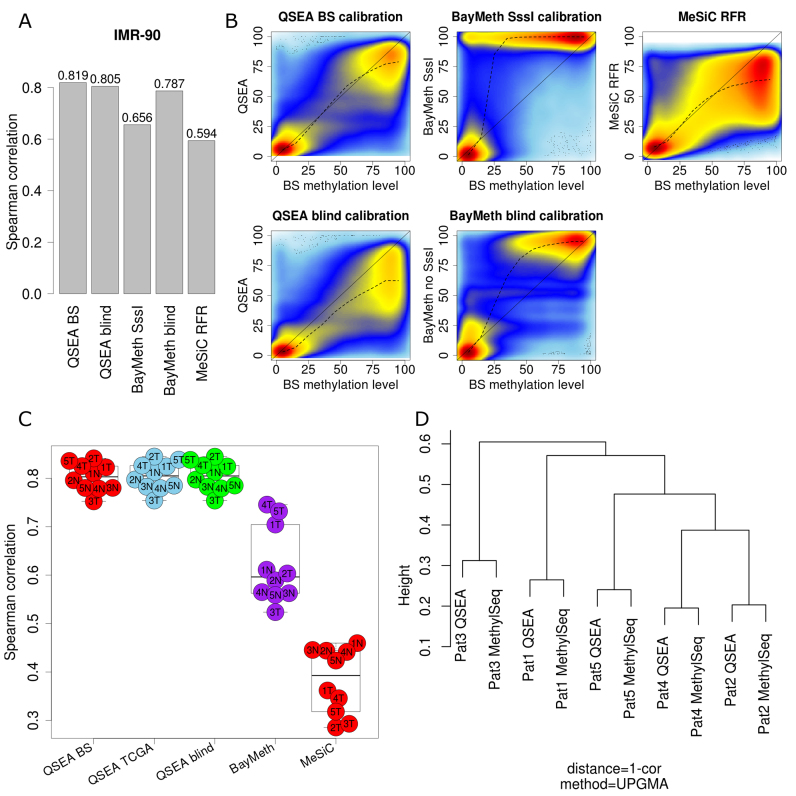
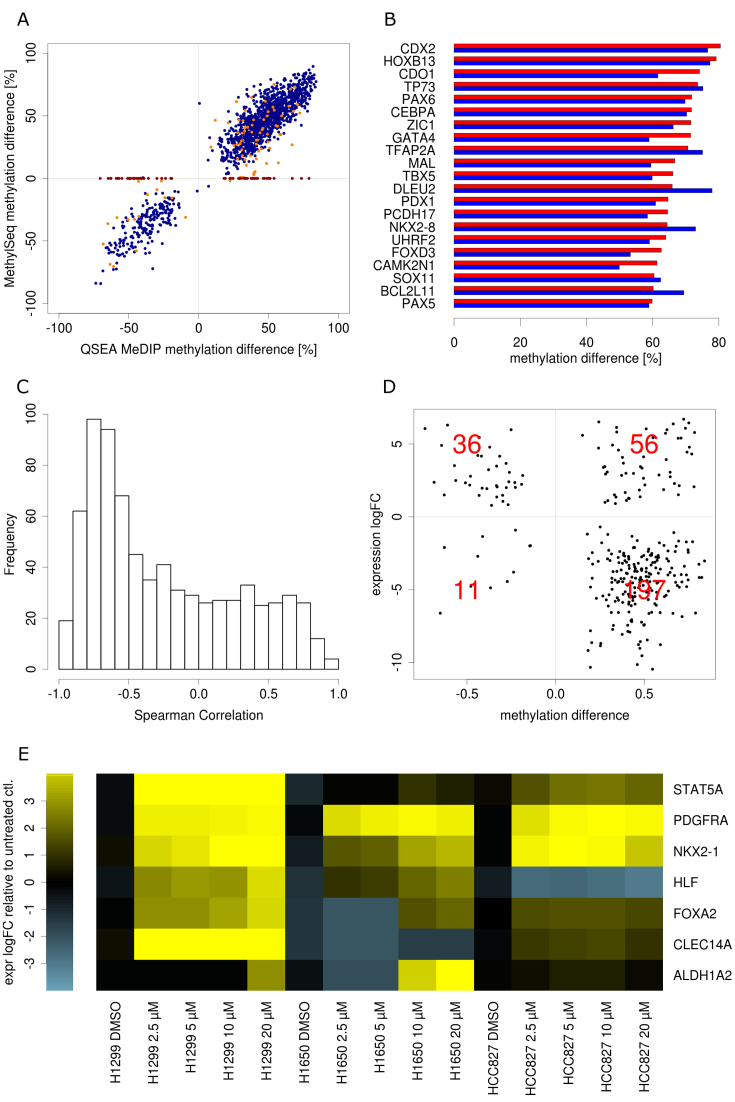
Genome-wide enrichment of methylated DNA followed by sequencing (MeDIP-seq) offers a reasonable compromise between experimental costs and genomic coverage. However, the computational analysis of these experiments is complex, and quantification of the enrichment signals in terms of absolute levels of methylation requires specific transformation. In this work, we present QSEA, Quantitative Sequence Enrichment Analysis, a comprehensive workflow for the modelling and subsequent quantification of MeDIP-seq data. As the central part of the workflow we have developed a Bayesian statistical model that transforms the enrichment read counts to absolute levels of methylation and, thus, enhances interpretability and facilitates comparison with other methylation assays. We suggest several calibration strategies for the critical parameters of the model, either using additional data or fairly general assumptions. By comparing the results with bisulfite sequencing (BS) validation data, we show the improvement of QSEA over existing methods. Additionally, we generated a clinically relevant benchmark data set consisting of methylation enrichment experiments (MeDIP-seq), BS-based validation experiments (Methyl-seq) as well as gene expression experiments (RNA-seq) derived from non-small cell lung cancer patients, and show that the workflow retrieves well-known lung tumour methylation markers that are causative for gene expression changes, demonstrating the applicability of QSEA for clinical studies. QSEA is implemented in R and available from the Bioconductor repository 3.4 (www.bioconductor.org/packages/qsea).
© The Author(s) 2016. Published by Oxford University Press on behalf of Nucleic Acids Research.
Figures
References
-
- Bird A. DNA methylation patterns and epigenetic memory. Genes Dev. 2002; 16:6–21. - PubMed
-
- Hanahan D., Weinberg R.A.. Hallmarks of cancer: the next generation. Cell. 2011; 144:646–674. - PubMed
-
- Esteller M. CpG island hypermethylation and tumor suppressor genes: a booming present, a brighter future. Oncogene. 2002; 21:5427–5440. - PubMed
-
- deVos T., Tetzner R., Model F., Weiss G., Schuster M., Distler J., Steiger K.V., Grutzmann R., Pilarsky C., Habermann J.K. et al. . Circulating methylated SEPT9 DNA in plasma is a biomarker for colorectal cancer. Clin. Chem. 2009; 55:1337–1346. - PubMed
-
- Heyn H., Esteller M.. DNA methylation profiling in the clinic: applications and challenges. Nat. Rev. Genet. 2012; 13:679–692. - PubMed
Publication types
MeSH terms
Substances
LinkOut - more resources
Full Text Sources
Other Literature Sources
Molecular Biology Databases
Research Materials
