Review
. 2017 Feb;45(1):57-74.
doi: 10.1007/s00240-016-0948-8. Epub 2016 Dec 2.

The role of macromolecules in the formation of kidney stones

Affiliations
Review

The role of macromolecules in the formation of kidney stones

Jeffrey D Rimer et al. Urolithiasis. 2017 Feb.

Abstract

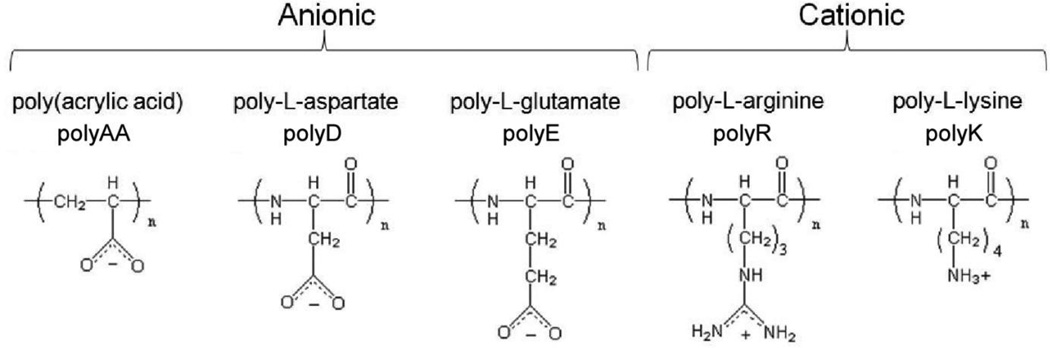
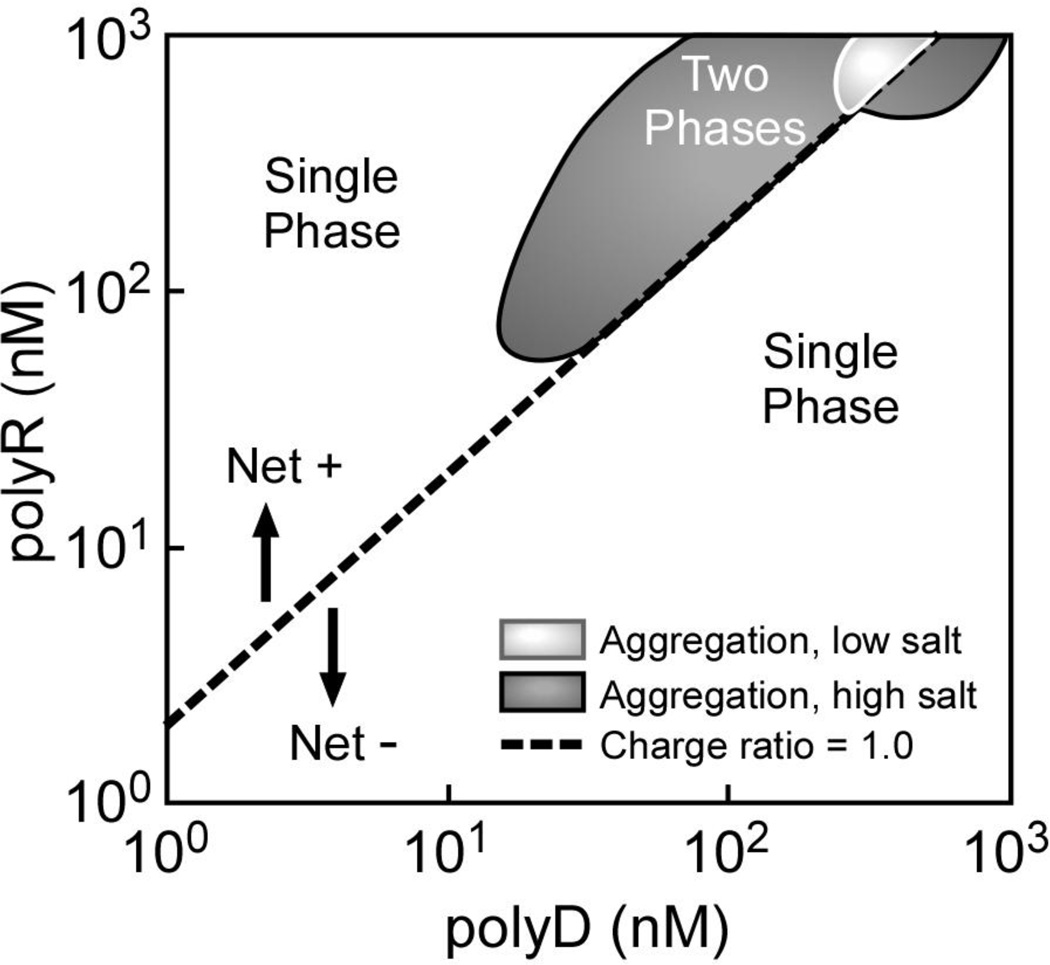
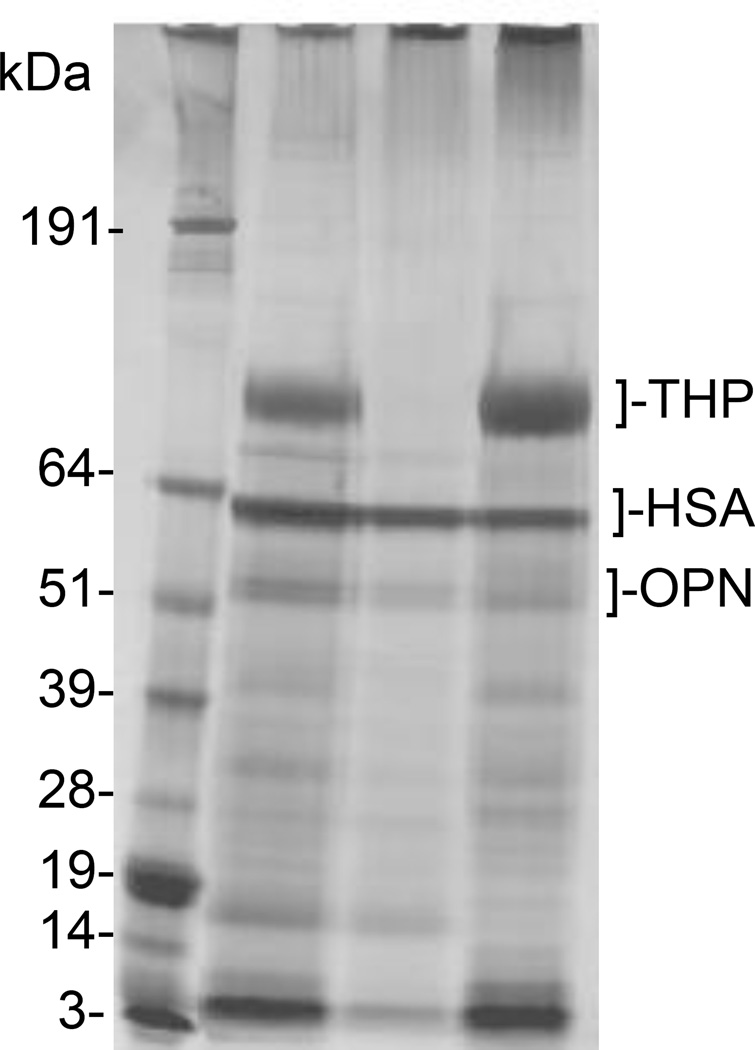
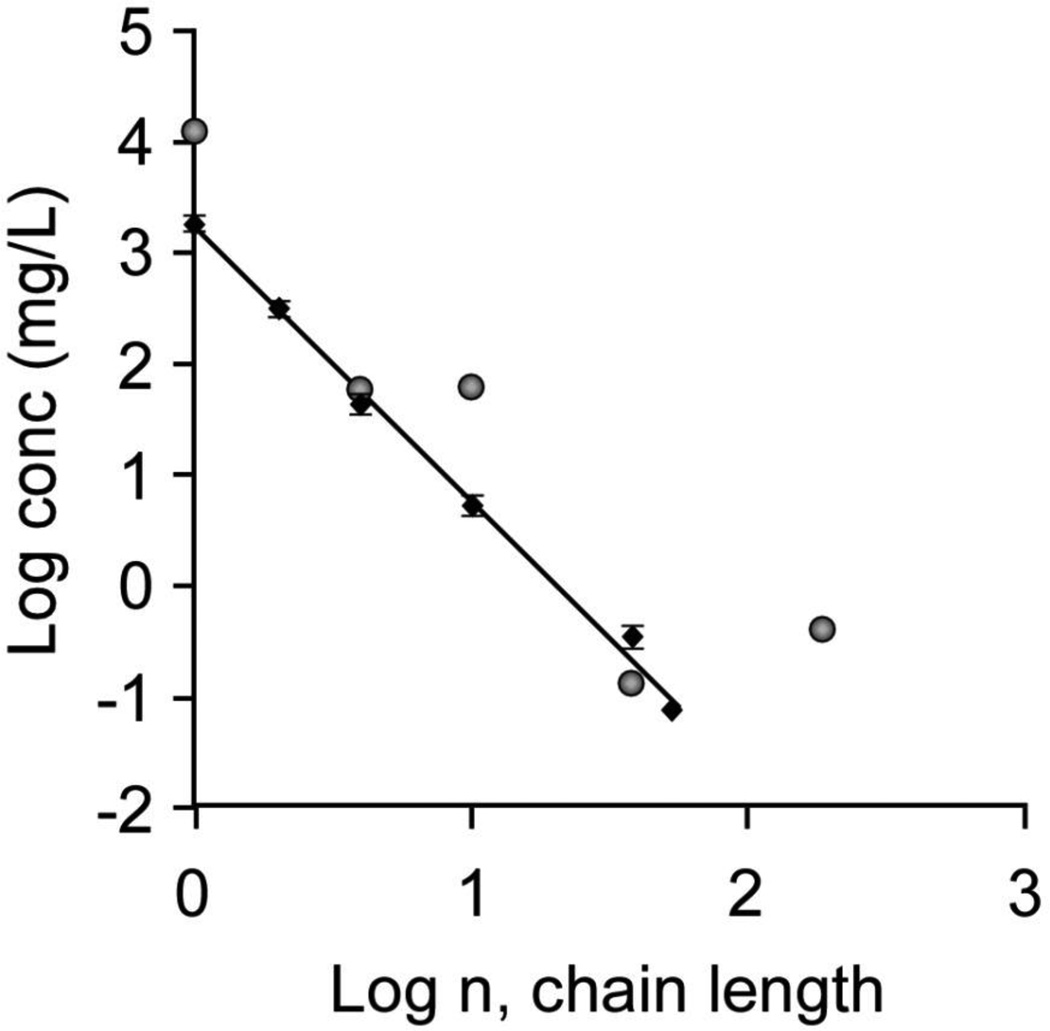
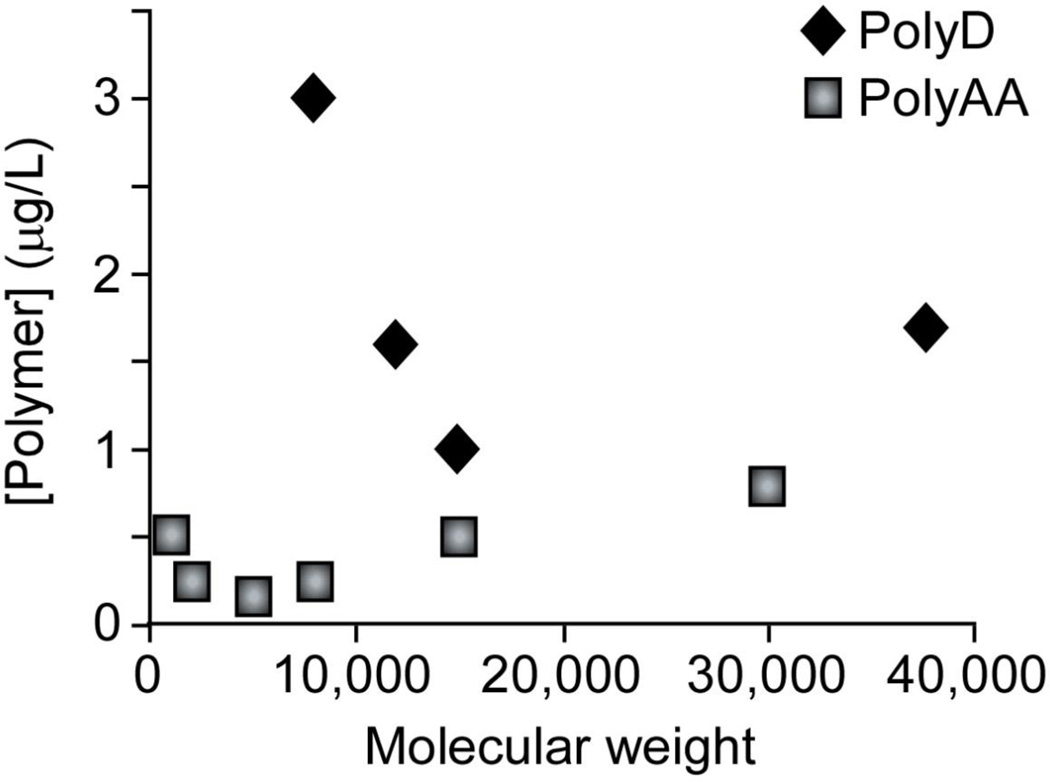
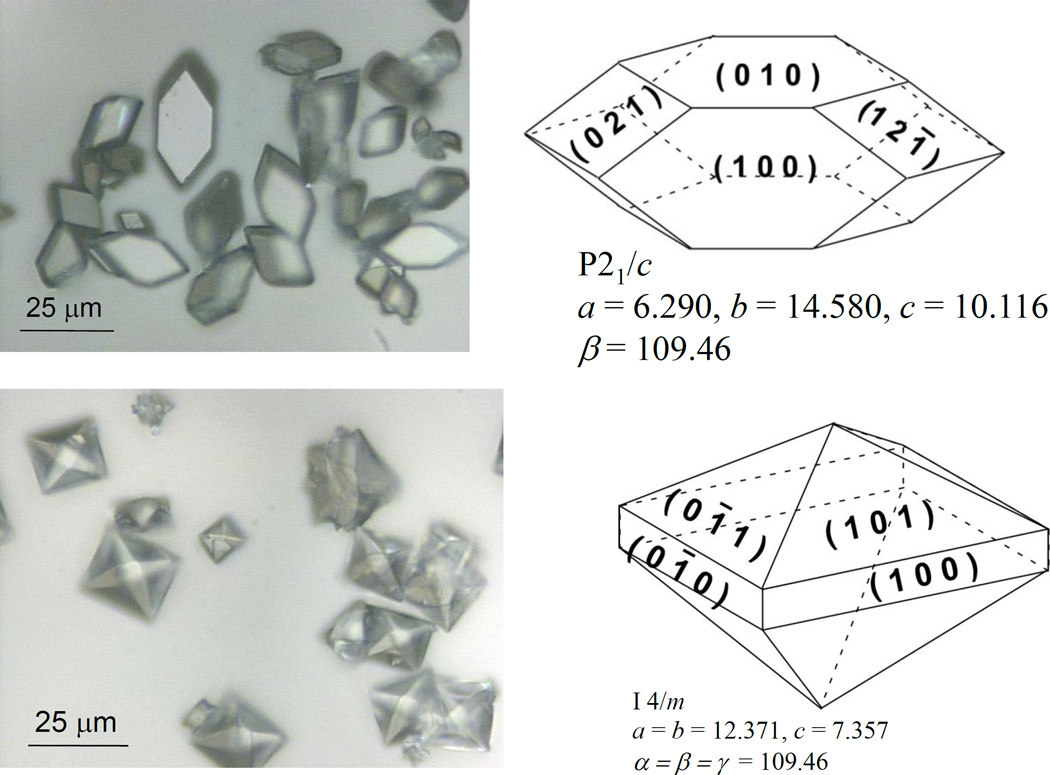
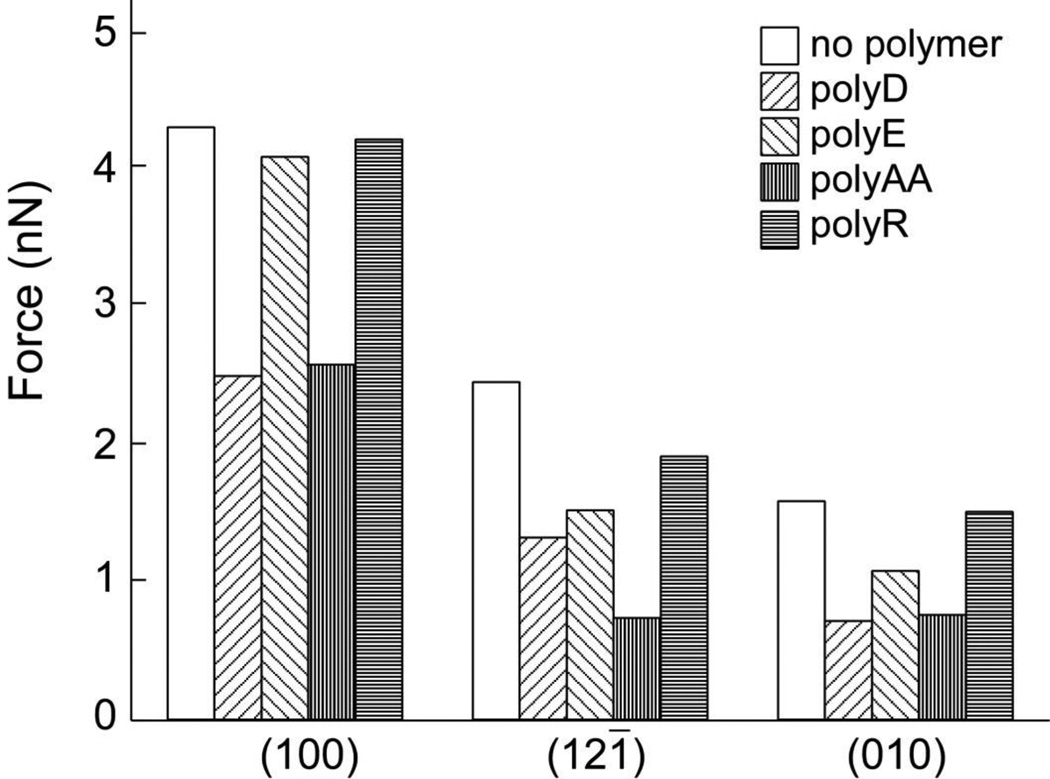
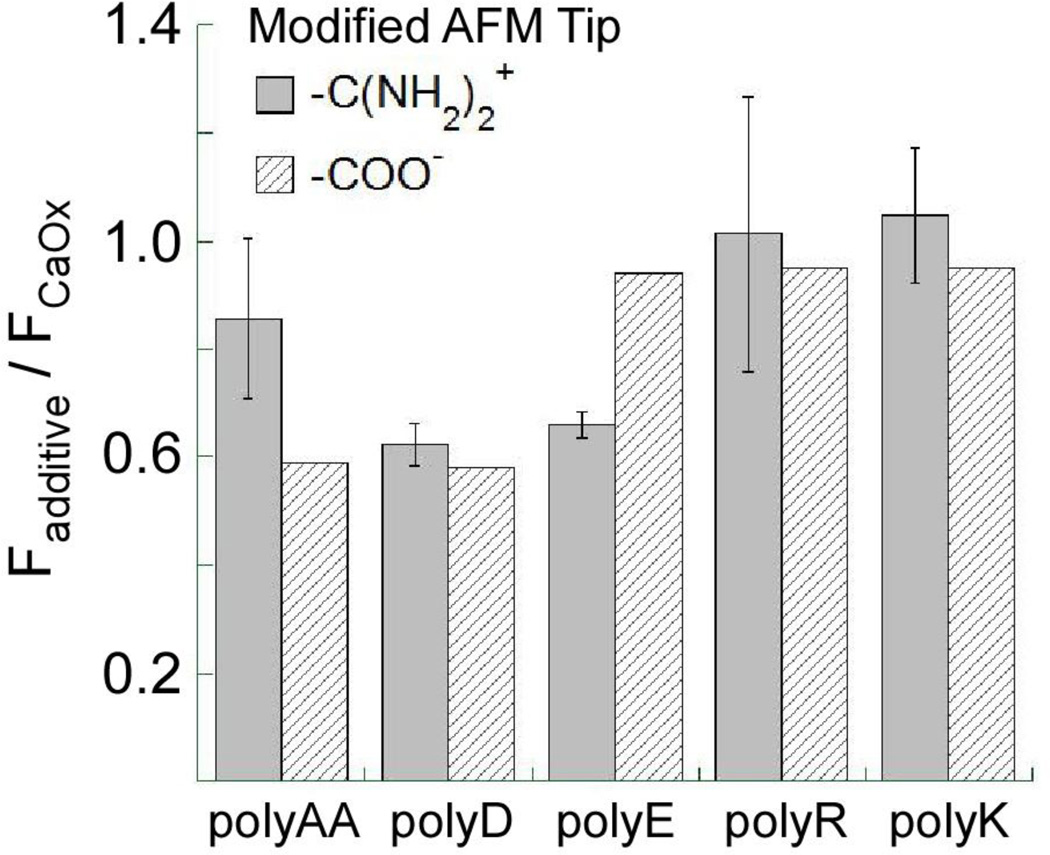
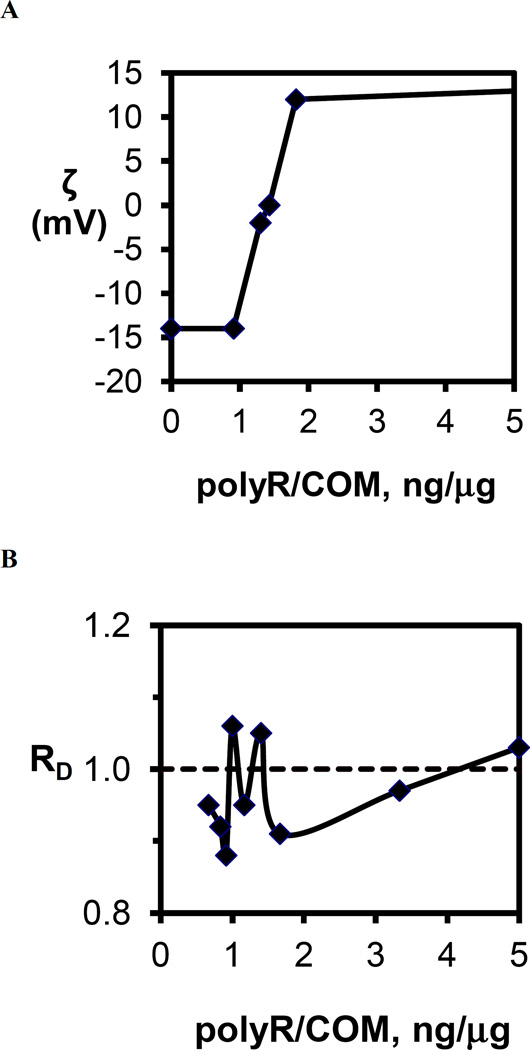
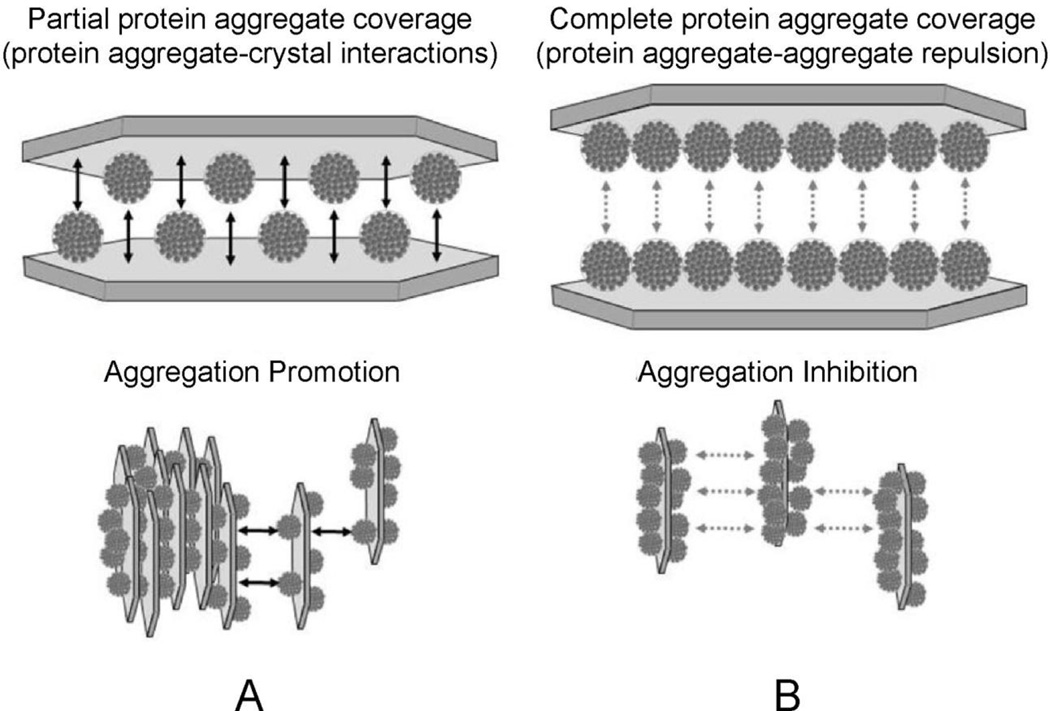
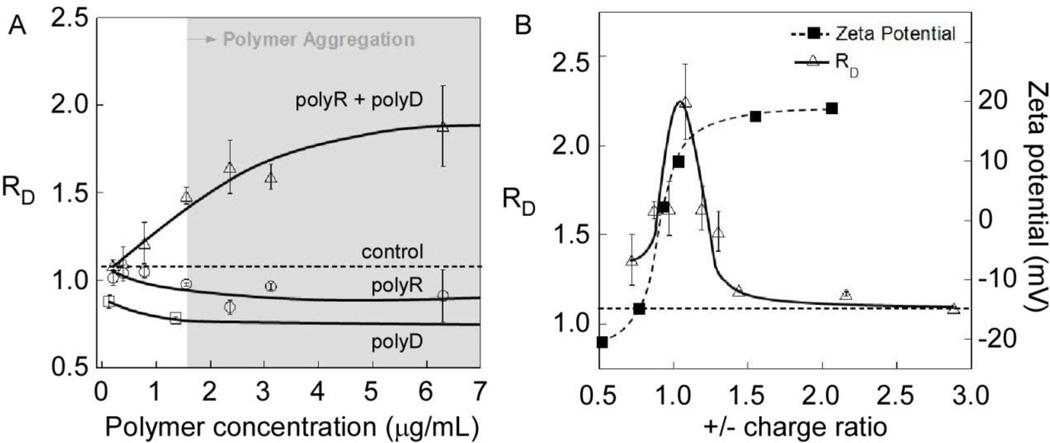
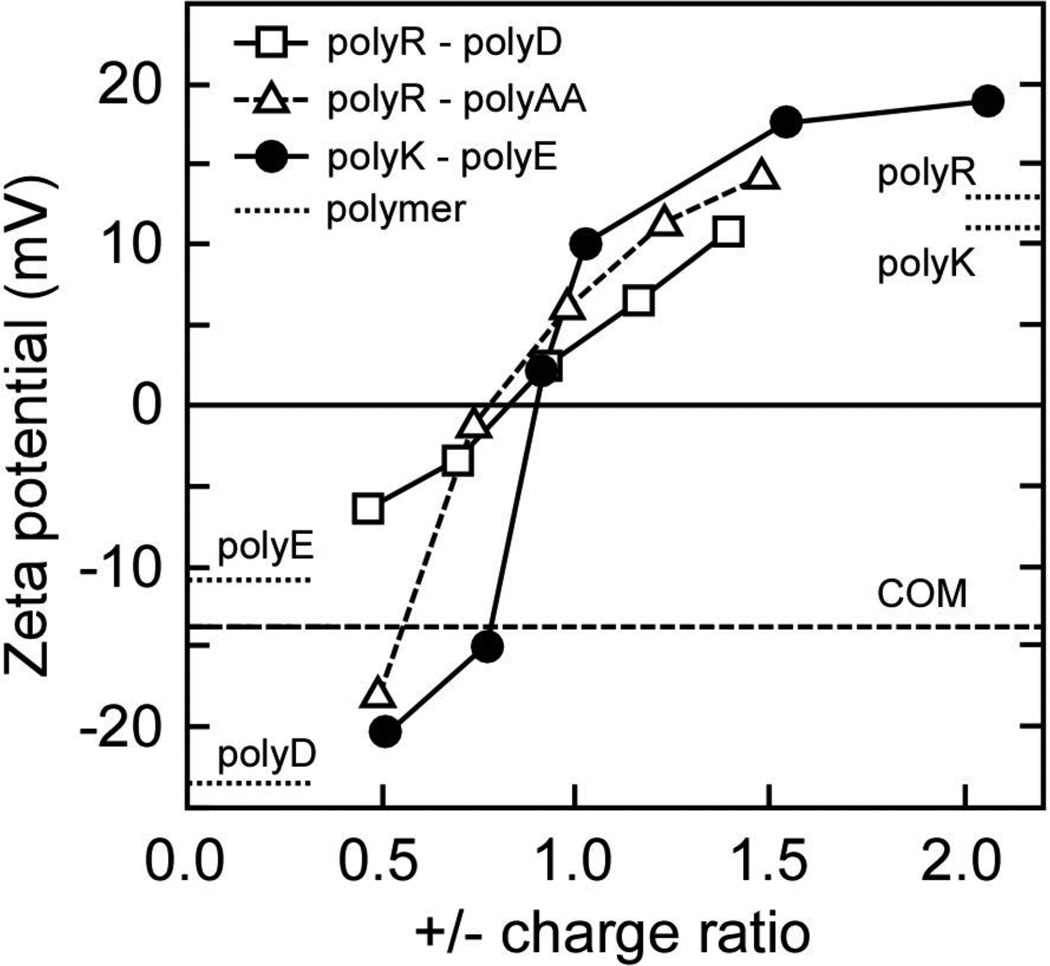
The formation of crystal aggregates, one of the critical processes in kidney stone pathogenesis, involves interactions between crystals (predominantly calcium oxalate monohydrate, COM) and urinary constituents (e.g., proteins), which serve as an adhesive "glue" between crystals in stones. To develop a better understanding of the protein-crystal interactions that lead to crystal aggregation, we have measured the effect of model proteins on bulk COM crystal properties as well as their adsorption on crystal surfaces using three synthetic polyanions: poly(aspartic acid) (polyD), poly(glutamic acid) (polyE), and poly(acrylic acid) (polyAA). These anionic macromolecules reduced the amount of COM crystal aggregation in bulk solution to an extent similar to that observed for mixture of proteins from normal urine, with little difference between the polymers. In contrast, the polymers exhibited differences in measures of COM crystal growth. Polycations such as poly(arginine) (polyR) and poly(lysine) (polyK) reduced aggregation weakly and exerted negligible effects on crystal growth. All polyions were found to associate with COM crystal surfaces, as evidenced by changes in the zeta potential of COM crystals in electrophoretic mobility measurements. On the other hand, COM aggregation and possibly growth can be promoted by many binary mixtures of polycations and polyanions, which appeared to be mediated by polymer aggregate formation rather than loss of crystal charge stabilization. Similarly, crystal aggregation promotion behavior can be driven by forming aggregates of weakly charged polyanions, like Tamm-Horsfall protein, suggesting that polymer (protein) aggregation may play a critical role in stone formation. Sensitivity of polyanion-COM crystal surface interactions to the chemical composition of polymer side groups were demonstrated by large differences in crystal aggregation behavior between polyD and polyE, which correlated with atomic force microscopy (AFM) measurements of growth inhibition on various COM surfaces and chemical force microscopy (CFM) measurements of unbinding forces between COM crystal surfaces and AFM tips decorated with either carboxylate or amidinium moieties (mimicking polyanion and polyR side chains, respectively). The lack of strong interaction for polyE at the COM (100) surface compared to polyD appeared to be the critical difference. Finally, the simultaneous presence of polyanions and polycations appeared to alter the ability of polycations to mediate unbinding forces in CFM and promote crystal growth. In summary, polyanions strongly associated with COM surfaces and influenced crystallization, while polycations did not, though important differences were observed based on the physicochemical properties of polyanions. Observations suggest that COM aggregation with both polyanion-polycation mixtures and weakly charged polyanions is promoted by polymer aggregate formation, which plays a critical role in bridging crystal surfaces.

Keywords: Adhesion; Aggregation; Atomic force microscopy; Calcium oxalate; Kidney stone; Polyelectrolyte.


Conflict of interest statement

Ethical approval: None of the authors has any conflicts of interest to report.

Figures

Fig. 1
Fig. 1
Anionic and cationic polyelectrolytes mimic the amino acid residues of common urinary proteins. Putative inhibitors of COM stone formation are rich in aspartate and glutamate amino acids, which differ by one methylene group. Poly(acrylic acid) (polyAA) is a synthetic polymer containing carboxylic acid side chains placed even closer to the polymer backbone than observed in polyD and polyE. In vivo studies suggest urinary proteins rich in cationic amino acids, similar to arginine (polyR) and lysine (polyK), are not implicated in stone formation (i.e., histone), though they are observed in stone matrix.
Fig. 2
Fig. 2
Phase diagram for polyR-polyD mixtures at low salt and 150 mM NaCl. The molecular weight of polyR and poly D were 26 and 36 kDa, respectively. Dashed line represents composition with equal numbers of anions and cations (calculated). Cloud point determinations were based on using a particle sizing instrument as a detector. Increased turbidity was observed at higher polymer concentrations in mixtures containing nearly equal amounts of polyR and polyD indicating the formation of polymer aggregates; a second, concentrated polymer phase, in these dilute solutions. Note that the two phase region is observed at lower total polymer concentrations in the presence of 150mM NaCl compared with no added salt.
Fig. 3
Fig. 3
SDS-PAGE analysis with silver staining reveals bands for normal urine macromolecules (lane 2), protein aggregates induced by adding polyR to the urinary protein mixture (lane 4), and the fraction of proteins remaining in solution after separation of the protein aggregates with polyR (lane 3). Most proteins appear in the aggregate phase, with many common to both the aggregate phase and supernatant fluid, and a few enriched in the supernatant fluid. Molecular weight markers are shown in lane 1.
Fig. 4
Fig. 4
Polymer molecular weight effects on the inhibition of COM aggregation or COD formation are illustrated in this log-log plot of polymer concentration (conc) vs degree of polymerization (n, chain length) for polyD. The diamonds show the concentration of polyD required at each molecular weight to achieve RD = 0.9 in the aggregation assay. The circles show the concentration of polyD at each molecular weight required to achieve 50% COD formation as a measure of growth rate inhibition of COM.
Fig. 5
Fig. 5
Polymer concentration required to induce COD formation as a function of molecular weight in spontaneous nucleation experiments. Diamonds show data for a polyD molecular weight series. Squares show data for a polyAA molecular weight series. Minimum mass concentrations were noted at ca. 5 kDa for polyAA and ca. 15 kDa for polyD, indicating maximal inhibitor effectiveness for these molecular weights.
Fig. 6
Fig. 6
Miller indices for major faces of COM (upper) and COD (lower) crystals are indicated in the schematic drawings in the adjacent photomicrographs, along with their space group and unit cell dimensions.
Fig. 7
Fig. 7
Chemical force microscopy measurements of the unbinding force between a carboxylic acid functionalized AFM tip and various COM crystal faces in 150 mM NaCl solution. Measurements were performed with and without various polypeptide additives at polypeptide concentrations of 5µg/mL. (Reprinted with permission from Reference 73)
Fig. 8
Fig. 8
Relative unbinding force measurements at the COM (100) surface with amidinium and carboxylic acid functionalized AFM tips in solutions contained various polyelectrolytes. The relative unbinding force was calculated as the ratio of the force measured in the presence of polyelectrolyte, Fadditive, to the force measured on the bare COM (100) surface in the absence of additive, FCaOx
Fig. 9
Fig. 9
(A) Zeta potential of COM crystals in 150mM NaCl as a function of polyR to COM crystal mass ratio expressed as (ng polyR/µg COM). The approximately sigmoidal dependence displays a sharp transition from no effect (ζ= −14 mV) at 1ng/µg to nearly the saturation limit (ζ= 12mV) at 2 ng/µg. (B) RD from aggregation assays as a function of polyR to COM crystal mass ratio. Multiple samples were tested in the region of zero surface charge finding no evidence for induction of COM crystal aggregation by the addition of the polycation, polyR. The dashed line indicates the RD value for the control (no polyR added) experiment. The observed deviations from the control are in the range in the uncertainty for this measurement indicating that charge neutralization was not sufficient to trigger COM particle aggregation.
Fig. 10
Fig. 10
Diagram illustrating a proposed coverage-dependency of desialylated-THP-COM aggregation. The COM “seed” surface is depicted as a single crystal for illustrative purposes, with the characteristic elongated hexagonal morphology of COM crystals (see Figure 6). Adsorption is likely to occur on the (100) surface, which accounts for the largest surface area of single crystals, and is likely the predominantly surface area of COM seeds. Two cases are illustrated here for adsorption of aggregates to COM at (A) partial coverage (50 %) and (B) complete coverage (100 %). The former promotes COM aggregation though crystal-protein-crystal bridging interactions, while at some threshold coverage (illustrated here as a surface completely covered with aggregates) repulsion between protein aggregates on opposing crystal surfaces offsets the attractive interactions resulting from any remaining crystal-protein-crystal bridges. (Reprinted with permission from Reference 47)
Fig. 11
Fig. 11
COM aggregation in solutions containing polyR and polyD at varying polymer concentration and charge ratio. (A) Changes in relative diameter of COM seeds in binary and homopolymer solutions of polyR (26 kDa) and polyD (36 kDa) as a function of polymer concentration. Concentrations for mixed polymers refer to polyR concentration, where polyD was added to maintain a 1:1 monomer ratio. (B) Left axis: relative diameters (RD, Eq. 1) of COM crystals with polyR(+)/polyD(−) mixtures in a solution of composition 0.25 mM CaOx:150 mM NaCl:10 mM HEPES at pH 7.5. Varying amounts of polyR (15 – 270 nM) were added to seeded COM solutions containing 49 nM polyD. Right axis: zeta potential of COM-polyelectrolyte particles. Solid lines are interpolated and horizontal dashed lines at RD = 1.1 refer to control measurements obtained in the absence of polyelectrolyte.
Fig. 12
Fig. 12
Zeta potential of COM crystals in solutions containing polyelectrolyte mixtures. Polycations (polyR, polyK) and polyanions (polyAA, polyD, polyE) were combined in varying charge ratios. The zeta potential of COM surfaces in the absence of polyelectrolyte (dashed line; control) is −14 mV. The point of zero charge for COM-polyelectrolyte complexes occurs at a polycation to polyanion electrolyte charge ratios below unity, suggesting that the presence of polyanions enhances polycation adsorption at COM crystal surfaces.
Fig. 13
Fig. 13
Relative unbinding force between AFM tips modified with amidinium (-C(NH2)+) and carboxylic acid (-COO) moieties and the COM (100) surface in the solutions containing various mixtures of polyR and polyD. Measurements were performed in 0.11 mM CaOx solutions with a total polyelectrolyte concentration of 5 µg/mL (polyR + polyD) in each experiment.

References

    1. Aggarwal KP, et al. Nephrolithiasis: molecular mechanism of renal stone formation and the critical role played by modulators. Biomed Research International. 2013 - PMC - PubMed
    1. Kaiser ET, Bock SC. Protein inhibitors of crystal-growth. J Urology. 1989;141(3):750–752. - PubMed
    1. Kumar V, Lieske JC. Protein regulation of intrarenal crystallization. Curr Opin Nephrol Hy. 2006;15(4):374–380. - PubMed
    1. Ryall RL. Glycosaminoglycans, proteins, and stone formation: Adult themes and child's play. Pediatr Nephrol. 1996;10(5):656–666. - PubMed
    1. Boyce WH, Garvey FK. The amount and nature of the organic matrix in urinary calculi - a review. J Urology. 1956;76(3):213–227. - PubMed

LinkOut - more resources