. 2016 Dec 3:5:e20718.
doi: 10.7554/eLife.20718.

Assembling the Tat protein translocase

Affiliations

Assembling the Tat protein translocase

Felicity Alcock et al. Elife. .

Abstract

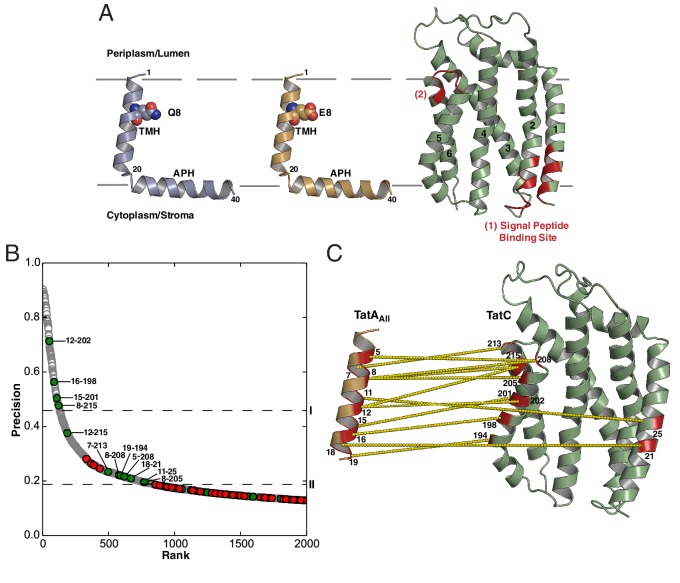
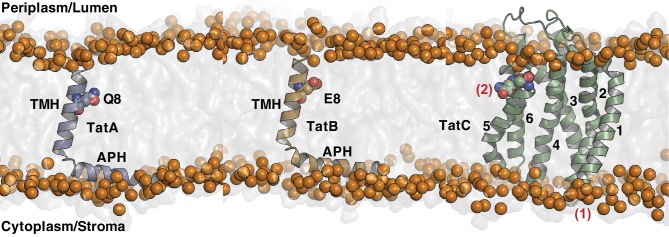
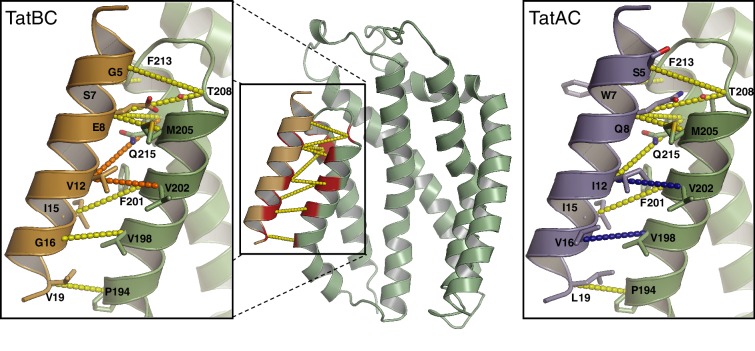
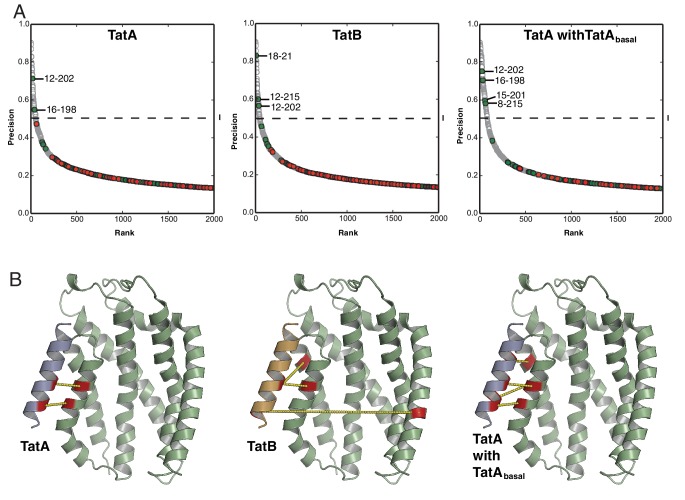
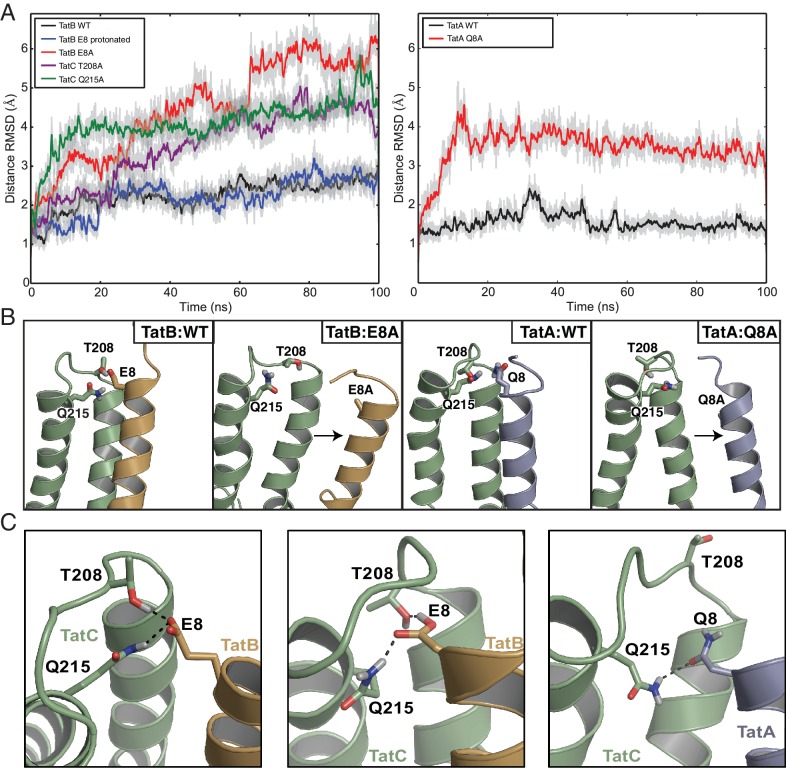
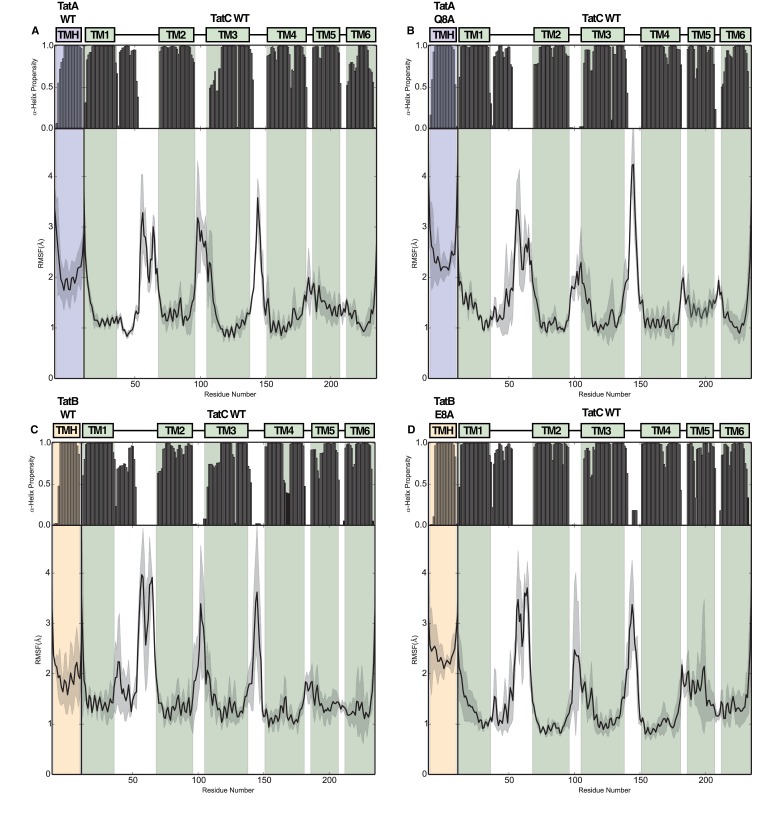
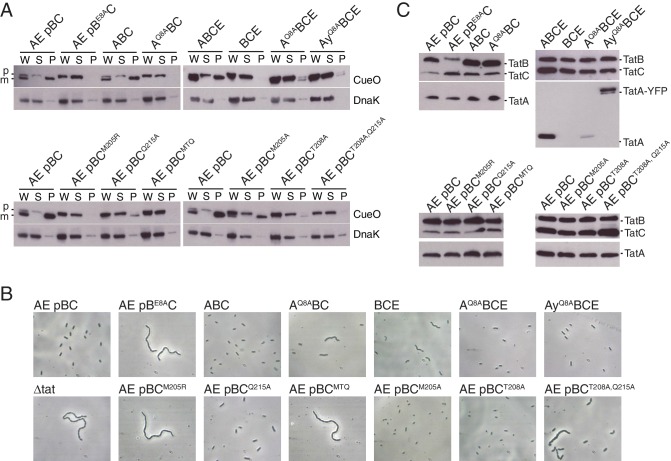
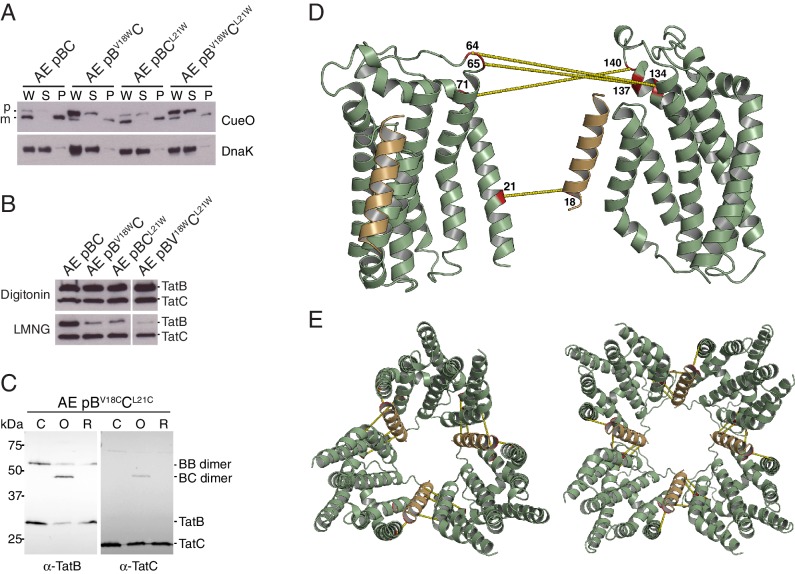
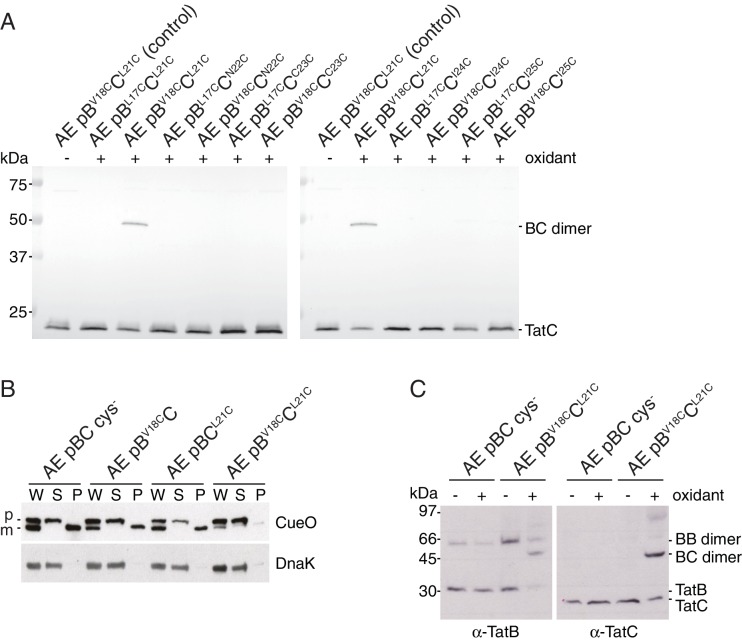
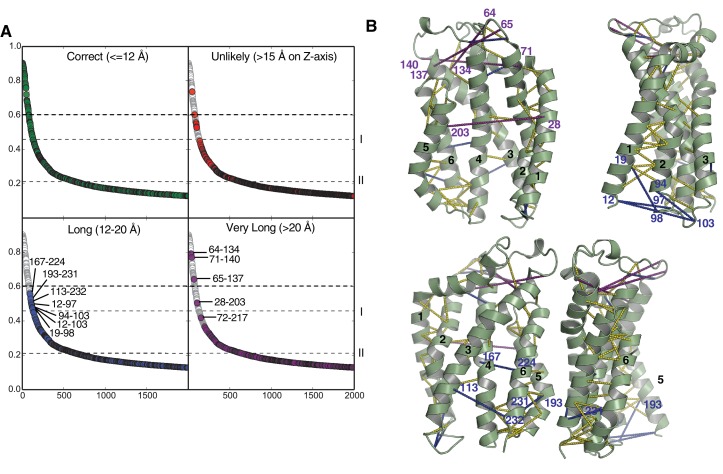
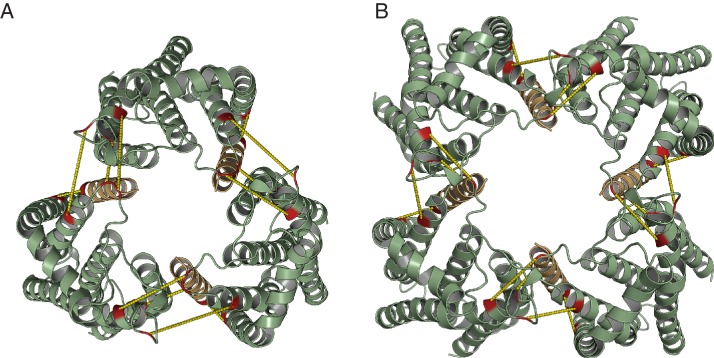
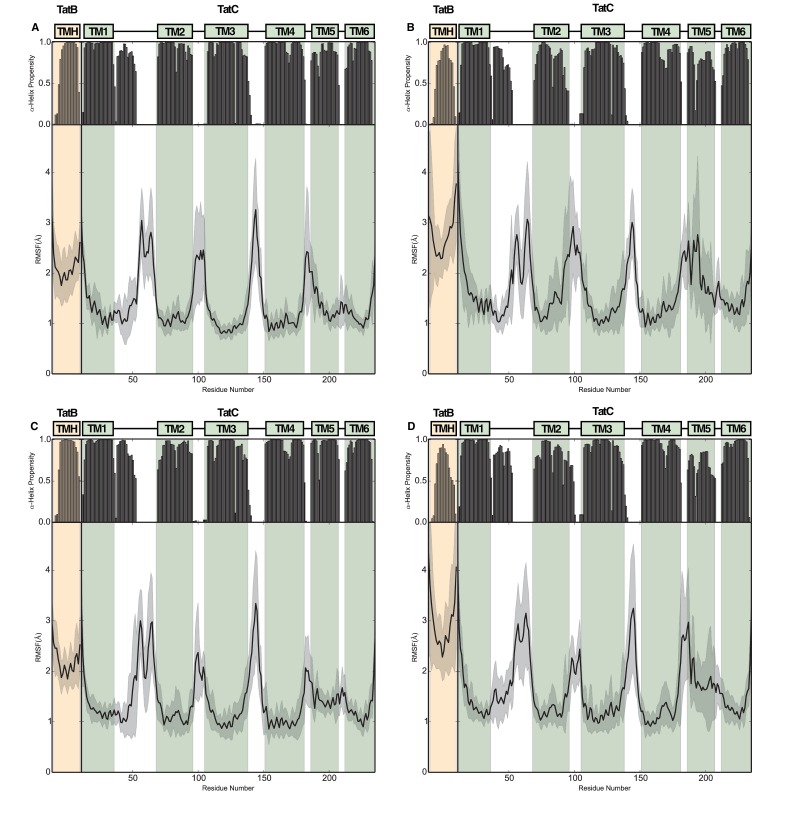
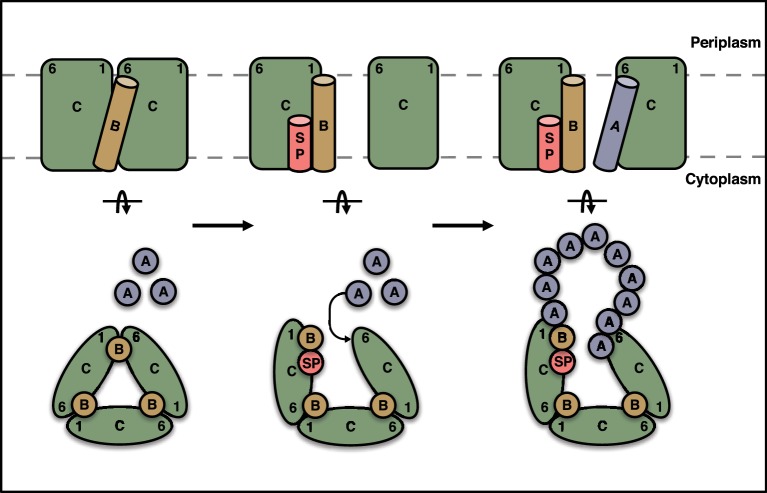
The twin-arginine protein translocation system (Tat) transports folded proteins across the bacterial cytoplasmic membrane and the thylakoid membranes of plant chloroplasts. The Tat transporter is assembled from multiple copies of the membrane proteins TatA, TatB, and TatC. We combine sequence co-evolution analysis, molecular simulations, and experimentation to define the interactions between the Tat proteins of Escherichia coli at molecular-level resolution. In the TatBC receptor complex the transmembrane helix of each TatB molecule is sandwiched between two TatC molecules, with one of the inter-subunit interfaces incorporating a functionally important cluster of interacting polar residues. Unexpectedly, we find that TatA also associates with TatC at the polar cluster site. Our data provide a structural model for assembly of the active Tat translocase in which substrate binding triggers replacement of TatB by TatA at the polar cluster site. Our work demonstrates the power of co-evolution analysis to predict protein interfaces in multi-subunit complexes.

Keywords: E. coli; Tat protein transport; biochemistry; biophysics; membrane protein; sequence co-evolution; structural biology; twin-arginine.


Conflict of interest statement

The authors declare that no competing interests exist.

Figures

Figure 1.
Figure 1.. Sequence-coevolution analysis of interactions between TatA family proteins and TatC.
(A) Structures of the E. coli Tat components. The transmembrane (TMH) and amphipathic (APH) helices of TatA and TatB are indicated. Areas of highest surface sequence conservation on TatC are indicated in red and include the binding site for the signal peptide twin-arginine motif. The natively unstructured tails of TatA and TatB are not depicted. (B) Predicted co-evolutionary residue contacts for the TatAAll–TatC dataset using the program PSICOV. Filled circles are predicted inter-subunit co-evolutionary contacts that are either (green) less than 15 Å apart along the membrane normal as expected of authentic direct contacts or (red) at greater than this value and therefore unlikely to correspond to direct interaction pairs. Unfilled gray circles are predicted intra-subunit contacts. Dashed line I marks the evolutionary coupling precision score (0.46) at 7SD above the mean for the whole dataset. Dashed line II marks the evolutionary coupling precision score (0.19) that is 6SD above the mean for the inter-subunit contact dataset. (C) A structural representation of the predicted TatAAll-TatC contacts above threshold level II. See also Table 1. DOI: http://dx.doi.org/10.7554/eLife.20718.002
Figure 1—figure supplement 1.
Figure 1—figure supplement 1.. Components of the Tat translocase within a lipid bilayer.
End snapshots of coarse grain-molecular dynamics simulations of the individual Escherichia coli Tat components in a 1:4 phosphatidylglycerol (POPG): 1-palmitoly, 2-oleoyl, phosphatidylethanolamine (POPE) membrane. Orange spheres represent the phosphate group of the membrane. The time-averaged positions of the proteins in the membrane bilayer were used to filter out topologically unrealistic co-evolutionary contacts as described in Materials and methods. Residues predicted to form an interacting intramembrane polar cluster are shown in space-filling mode. All other features are labeled as in Figure 1A. DOI: http://dx.doi.org/10.7554/eLife.20718.003
Figure 2.
Figure 2.. Phylogeny and sequence conservation of the TatA family.
(A) Phylogenetic tree of TatA family members based on a sequence comparison to the end of the APH. The phylogenetic origins of the sequences are given around the edge of the tree: `Alpha’, `Beta’, `Gamma’, `Delta’, and `Epsilon’ refer to the five classes of the phylum Proteobacteria; `Bacilli’ and `Clostridia’ are classes within the phylum Firmicutes; `Actino’ refers to the phylum Actinobacteria; `Acido’ refers to the phylum Acidobacteria; `Cyano’ refers to the phylum Cyanobacteria; `Plants’ refers to plant chloroplast proteins. Asterisks mark the sequences of E. coli TatA/TatE (blue), E. coli TatB (orange), and the pea thylakoid TatA and TatB proteins Tha4 and Hcf106 (red). (B) Sequence logos for the three Tat subsets identified in (A). The logos correspond to the sequence region analyzed in (A) and use the sequence numbering of E. coli TatA and TatB. The secondary structure elements of the Tat proteins are shown under the logos and the position of the TMH polar residue is indicated with a red dot. The figure was generated using WebLogo 3.4 (Crooks et al., 2004). DOI: http://dx.doi.org/10.7554/eLife.20718.005
Figure 3.
Figure 3.. Modeling the interaction of TatA and TatB with the C-terminal end of TatC.
The interaction between the TatA/B TMH and TatC TM5/TM6 modeled for E. coli TatBC and TatAC pairs. The models are based on A. aeolicus TatC crystal packing contacts. Evolutionary couplings for the TatAAll dataset are shown (dotted lines). Couplings retained in just the TatB or TatA datasets with precisions greater than 0.5 (Figure 3—figure supplement 1A) are colored orange or blue, respectively. See also (Table 1). DOI: http://dx.doi.org/10.7554/eLife.20718.006
Figure 3—figure supplement 1.
Figure 3—figure supplement 1.. Co-evolution analysis of inter-subunit contacts in the Tat system.
(A) Co-evolution data for TatA subsets with TatC, predicted using PSICOV (Jones et al., 2012). The TatA and TatB subsets were defined phylogenetically as shown in Figure 2A. The comparison using the TatAbasal dataset alone did not identify significant co-variances due to the limited number of sequences in the dataset. However, combining the TatAbasal dataset with the TatA dataset recovered more of the TMH-TatC TM5/TM6 covariances seen with the TatAall dataset than using the TatA dataset alone. This suggests that TatAbasal also binds at this site. Combining the TatAbasal dataset with the TatB dataset did not change the set of high-scoring co-varying pairs recovered with the TatB dataset alone. A cut-off of 0.5 precision (dashed line) is used for increased confidence in the predicted residue pairs. (B) Inter-subunit contacts above 0.5 precision are depicted (yellow dashed lines) on the TatA/B TMH-TatC complex models derived in Figure 3. DOI: http://dx.doi.org/10.7554/eLife.20718.007
Figure 4.
Figure 4.. Molecular simulations of the interactions of TatA and TatB with the C-terminal end of TatC.
(A) Root-mean square deviation (RMSD) of the distances between predicted contact pairs during atomistic MD simulations of the indicated TatBC (left) and TatAC (right) models in a membrane environment taken from three simulations. Both raw data (light gray) and data averaged over a rolling window of 0.35 ns (bold) are shown. Except where indicated, TatB E8 was deprotonated in the simulations. (B) Alanine substitution of the TMH polar residue disrupts the interaction between TatC and the TMHs of TatB (orange) or TatA (blue). The output structures from 100 ns MD simulations are shown with the helix displacements seen in the variants (right hand panel in each pair) relative to the wild-type proteins (left hand panel in each pair) denoted by arrows. (C) Snapshots of the MD simulations of the TatBC and TatAC models showing hydrogen bonding interactions between residues in the inter-subunit polar cluster. Simulations were run with TatB E8 either deprotonated (left panel) or protonated (center panel). See also Videos 1–2. DOI: http://dx.doi.org/10.7554/eLife.20718.008
Figure 4—figure supplement 1.
Figure 4—figure supplement 1.. Structural stability plots for the modeled Tat protein complexes from molecular simulations.
Each plot details the secondary structure propensity and Cα-root-mean-square-fluctuations (RMSF) for either the TatA or TatB (deprotonated E8) TMH bound to TatC. The complexes analyzed are (A) TatA with TatC, (B) TatA Q8A with TatC, (C) TatB with TatC, (D) TatB E8A with TatC. DOI: http://dx.doi.org/10.7554/eLife.20718.009
Figure 5.
Figure 5.. Polar cluster substitutions impair Tat transport.
Strains contained the indicated amino acid substitutions in chromosomally encoded TatA or plasmid-encoded TatB or TatC. TatCMTQ is a combination of the three substitutions M205A, T208A, and Q215A. TatAy is TatA with a C-terminal fusion to yellow fluorescent protein. (A) Transport activity of strains overproducing the Tat substrate CueO. Whole cell (W), spheroplast (S) and periplasm (P) fractions were subject to immunoblotting with antibodies against CueO or the cytoplasmic marker protein DnaK. m is the transported form of CueO from which the signal peptide has been removed and p the precursor protein. (B) Phase contrast images of the strains. `Δtat’ is the complete tat deletion strain DADE-A. (C) Membranes from the same strains were isolated and immunoblotted with a combination of TatB and TatC antibodies or with TatA antibodies. DOI: http://dx.doi.org/10.7554/eLife.20718.012
Figure 5—figure supplement 1.
Figure 5—figure supplement 1.. Analysis of Tat transport activity.
(A) Plasmid p101C*TatBC produces wild-type levels of TatB and TatC. (Left) Immunoblot of membranes isolated from the indicated strains probed with a combination of TatB and TatC antibodies, or with TatA antibodies. (Right) Transport activity of strains overproducing the Tat substrate CueO. Whole cell (W), periplasm (P), or spheroplast (S) fractions were subject to immunoblotting with antibodies against CueO (top panel) or the cytoplasmic marker protein DnaK (bottom panel). m is the transported form of CueO from which the signal peptide has been removed and p the precursor protein. (B) The TatAQ8A variant is able to increase the Tat pathway activity of a TatE-containing strain. (Left) Transport activity of strains overproducing the Tat substrate CueO, labeled as in (A). (Right) Phase contrast images of the indicated strains. DOI: http://dx.doi.org/10.7554/eLife.20718.013
Figure 6.
Figure 6.. Polar cluster substitutions impair TatBC interactions.
Digitonin-solubilized cell lysates of the indicated strains were immunoprecipitated with antibodies against TatC and then immunoblotted with either a combination of TatB and TatC antibodies or with TatA antibodies (`α-TatC coIP’ panels). Where indicated a portion of the total cell lysate was also immunoblotted (‘input’ panels). (A,B) Co-immunoprecipitation analysis of strains expressing native levels of Tat proteins. Corresponding immunoblots of membranes isolated from the same strains are also shown (`membranes’). The TatCFEA variant is blocked in substrate interactions. The TatCMTQ variant carries the three polar cluster substitutions M205A, T208A, and Q215A. (C) Schematic representation of the results of polar cluster substitutions on Tat receptor complex composition. The red asterisks indicate the location of the polar cluster substitutions. (D) The indicated Tat proteins were overproduced approximately 500-fold in the ΔtatABCDΔtatE strain DADE-A from pUT2DH series plasmids and immunoprecipitated as in (A). DOI: http://dx.doi.org/10.7554/eLife.20718.014
Figure 7.
Figure 7.. The TatA polar cluster residue is not required for TatA oligomerization.
(A,B) Fluorescence images of TatA-YFP in living cells. The indicated strains were either left untreated (-CueO columns) or the Tat substrate protein CueO was overproduced from plasmid pQE80-CueO by adding 1 mM IPTG to early exponential phase cultures for 30 min prior to imaging (+CueO columns). 50 μM CCCP was subsequently added as indicated (+CCCP columns). Scale bar = 1 μM (C) Membranes isolated from the same strains were immunoblotted using a combination of TatB and TatC antibodies or with TatA antibodies to assess protein expression levels. DOI: http://dx.doi.org/10.7554/eLife.20718.015
Figure 7—figure supplement 1.
Figure 7—figure supplement 1.. The effect of TatC polar cluster substitutions on the substrate-induced assembly of TatA.
(A) Fluorescence images of TatA-YFP in live cells overproducing the substrate protein CueO. Overproduction of CueO was induced in early exponential phase cultures of the indicated strains with 1 mM IPTG 30 min prior to immobilizing the cells for microscopy. Additional images were collected after addition of 50 μM CCCP (+CCCP). (B) Membranes from the same strains were isolated and immunoblotted with a combination of TatB and TatC antibodies, or with TatA antibodies. MTQ indicates the three substitutions M205A, T208A, and Q215A. DOI: http://dx.doi.org/10.7554/eLife.20718.016
Figure 8.
Figure 8.. Identification of a second TatBTMH-TatC contact site.
(A) Tat transport activity of strains with tryptophan substitutions targeting the predicted interface between the TatB TMH and TatC TM1. Methodology and labels are as for Figure 5A. (B) Effects of the tryptophan substitutions on TatBC interactions. Cell lysates were solubilized in either digitonin (top panel) or LMNG (bottom panel), immunoprecipitated with antibodies against TatC, and then immunoblotted with a combination of TatB and TatC antibodies. (C) Disulfide crosslinks can be detected at the predicted interface between the TatB TMH and TatC TM1. Cells carrying the indicated cysteine substituted Tat variants were subjected to a mock incubation (‘C’, no oxidant or reductant), oxidizing (‘O’, copper phenanthroline) or reducing (‘R’, DTT) conditions. Membranes were then isolated and subjected to immunoblotting with TatB (left panels) or TatC (right panels) antibodies. (D) Structural representation of the highest-scoring co-evolution-predicted contacts between TatBTMHC heterodimers (precision >0.6). (E) Model for the TatBC complex based on docking either three (Left) of four (Right) TatBTMH-TatC heterodimers to optimize agreement with the co-evolution data in (D). The complexes are viewed from the cytoplasmic side of the membrane. See also Figure 8—figure supplement 3, Video 3 and Supplementary files 1 and 2. DOI: http://dx.doi.org/10.7554/eLife.20718.017
Figure 8—figure supplement 1.
Figure 8—figure supplement 1.. TatB V18C and TatC L21C substitutions permit crosslinking of TatB to TatC and impair transport activity.
(A) The indicated strains were subjected to control (no oxidant) or oxidizing (1.8 mM copper phenantrholine) conditions. Membranes were then isolated and subjected to immunoblotting with TatC antibodies. (B) Transport activity of strains overproducing the Tat substrate CueO. Whole cell (W), periplasm (P), and spheroplast (S) fractions were subject to immunoblotting with antibodies against CueO (top panel) or the cytoplasmic marker protein DnaK (bottom panel). m is the transported, signal peptide-cleaved form of CueO, and p the precursor protein. (C) The cultures used in (B) were subjected to control (no oxidant) or oxidizing (0.9 mM copper phenanthroline) conditions. Membranes were isolated and subjected to immunoblotting with TatB (left panel) or TatC (right panel) antibodies. DOI: http://dx.doi.org/10.7554/eLife.20718.018
Figure 8—figure supplement 2.
Figure 8—figure supplement 2.. Evolutionary contacts predicted by PSICOV for TatC.
(A) Predicted TatC-TatC contacts from the analysis in Figure 1B were mapped on to the modeled structure of E. coli TatC and then sorted by the distance between the Cα-atoms of the interacting residues. Contacts within 12 Å were considered to be consistent with the crystal structure of TatC (green). Contacts with a separation of greater than 15 Å across the membrane (direction of the z-axis) were deemed to be spurious under any model (red). Contacts with separations between 12 and 20 Å may indicate contacts in alternative conformational states (blue). Contacts with separations over 20 Å are candidates for inter-subunit contacts within the TatBC multimer (purple). Dashed line I marks the co-variance score that is 7SD above the mean for the full contact dataset shown in Figure 1B. Dashed line II marks the co-variance score that is 6SD above the mean for the inter-subunit contacts shown in Figure 1B. See also Table 1. (B) Four orthogonal views of the TatC protein showing predicted TatC-TatC contacts above the 7SD significance level (dotted lines). Plotted are all contacts (yellow), contacts with separations between 12 and 20 Å (blue), and contacts with separations over 20 Å (purple). Contacts with separations between 12 and 20 Å cluster at the cytoplasmic face of the membrane and include residues known to be involved in signal peptide binding (H12, F94, and E103, E. coli TatC numbering). These putative contacts may, therefore, characterize a TatC conformer that is reached after substrate binding. DOI: http://dx.doi.org/10.7554/eLife.20718.019
Figure 8—figure supplement 3.
Figure 8—figure supplement 3.. Model for the TatBC complex based on docking either (A) three or (B) four TatBTMH-TatC heterodimers to optimize agreement with the co-evolution data in Figure 8D.
The complex is viewed from the periplasmic side of the membrane. DOI: http://dx.doi.org/10.7554/eLife.20718.020
Figure 8—figure supplement 4.
Figure 8—figure supplement 4.. Structural stability plots for the modeled trimeric and tetrameric Tat protein complexes from molecular simulations.
(A) The (TatBC)3 complex with lipids in the central pore, (B) the (TatBC)3 complex with water in the central pore, (C) the (TatBC)4 complex with lipids in the central pore, and (D) the (TatBC) 4 complex with water in the central pore. DOI: http://dx.doi.org/10.7554/eLife.20718.021
Figure 9.
Figure 9.. Schematic model for substrate activation of the Tat receptor complex.
The TMHs of TatB molecules (orange) in the receptor complex are sandwiched between TM1 of one TatC molecule and TM6 of the adjacent TatC molecule (green). Signal peptide (SP, red) binding to a TatC subunit transmits a conformational change through TM1 that reduces the affinity of TatB for the TM6 site on the adjacent TatC molecule and favors uptake of TatA (blue) into this site. The incoming TatA molecule is envisaged to nucleate the formation of the TatA oligomer. Current data are insufficient to determine the final location of the displaced TatB molecule and so the position shown should be regarded as speculative. A (TatBC)3 oligomer is shown for simplicity, but this mechanism is generally applicable to a (TatBC)n complex. DOI: http://dx.doi.org/10.7554/eLife.20718.024

References

    1. Alcock F, Baker MA, Greene NP, Palmer T, Wallace MI, Berks BC. Live cell imaging shows reversible assembly of the TatA component of the twin-arginine protein transport system. PNAS. 2013;110:E3650–E3659. doi: 10.1073/pnas.1306738110. - DOI - PMC - PubMed
    1. Aldridge C, Ma X, Gerard F, Cline K. Substrate-gated docking of pore subunit Tha4 in the TatC cavity initiates Tat translocase assembly. The Journal of Cell Biology. 2014;205:51–65. doi: 10.1083/jcb.201311057. - DOI - PMC - PubMed
    1. Barrett CM, Robinson C. Evidence for interactions between domains of TatA and TatB from mutagenesis of the TatABC subunits of the twin-arginine translocase. FEBS Journal. 2005;272:2261–2275. doi: 10.1111/j.1742-4658.2005.04654.x. - DOI - PubMed
    1. Behrendt J, Brüser T. The TatBC complex of the Tat protein translocase in Escherichia coli and its transition to the substrate-bound TatABC complex. Biochemistry. 2014;53:2344–2354. doi: 10.1021/bi500169s. - DOI - PubMed
    1. Berks BC. A common export pathway for proteins binding complex redox cofactors? Molecular Microbiology. 1996;22:393–404. doi: 10.1046/j.1365-2958.1996.00114.x. - DOI - PubMed

MeSH terms

LinkOut - more resources