

Nanotopography controls cell cycle changes involved with skeletal stem cell self-renewal and multipotency
- PMID: 27914982
- PMCID: PMC5226065
- DOI: 10.1016/j.biomaterials.2016.11.032
Nanotopography controls cell cycle changes involved with skeletal stem cell self-renewal and multipotency
Abstract
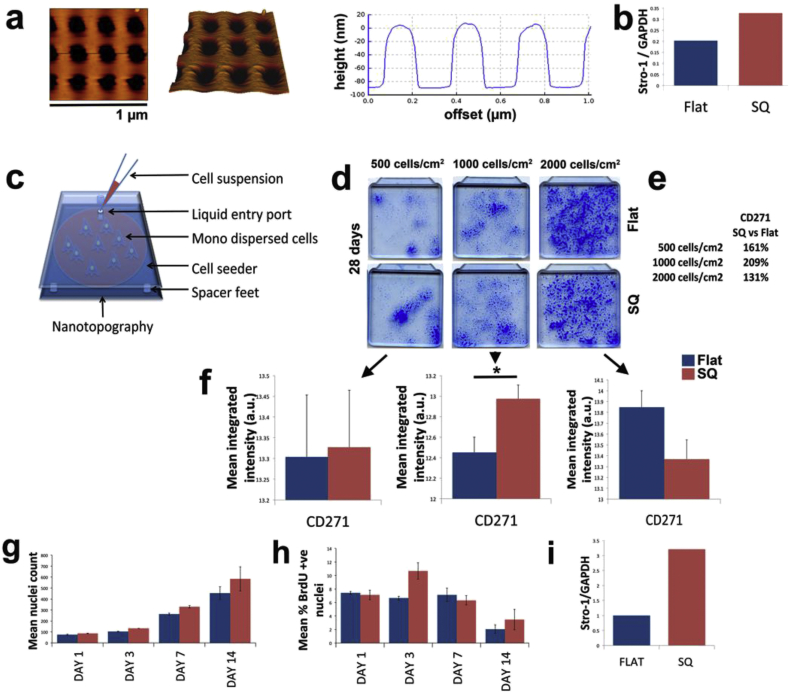
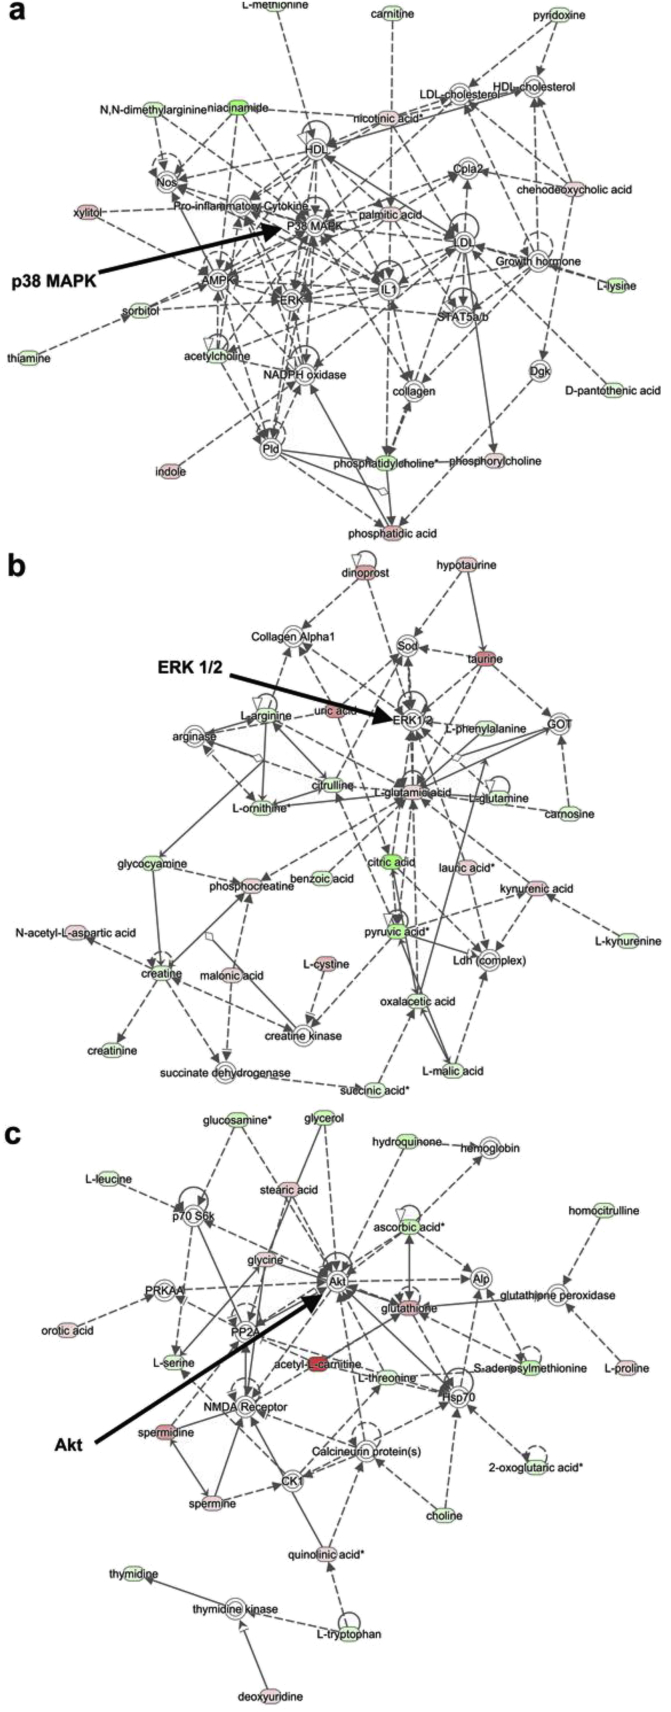
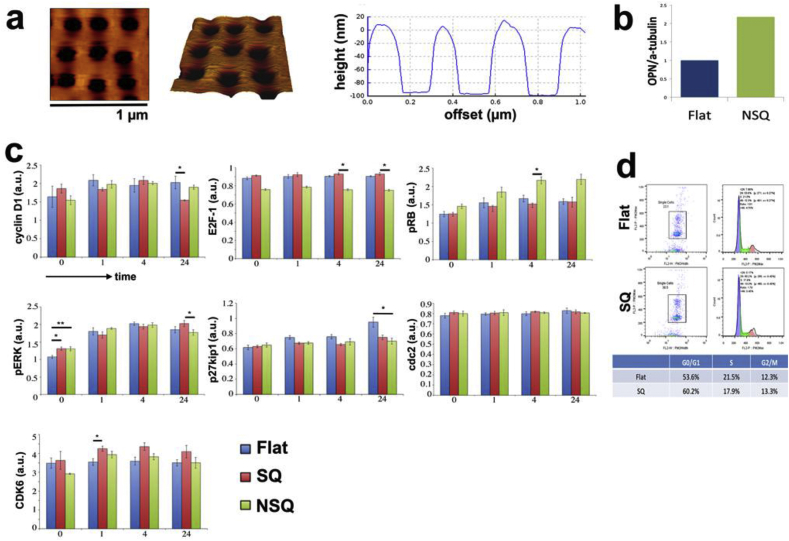
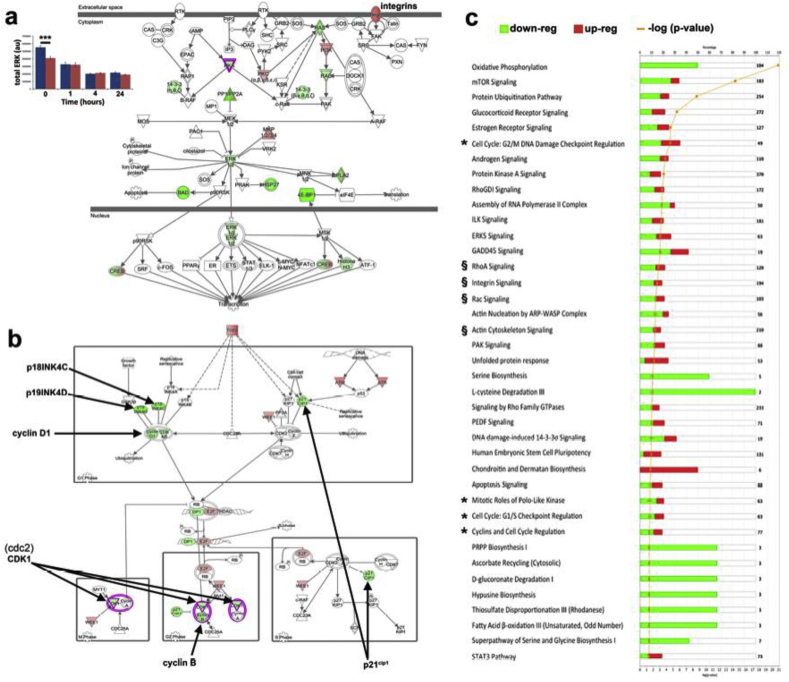
In culture isolated bone marrow mesenchymal stem cells (more precisely termed skeletal stem cells, SSCs) spontaneously differentiate into fibroblasts, preventing the growth of large numbers of multipotent SSCs for use in regenerative medicine. However, the mechanisms that regulate the expansion of SSCs, while maintaining multipotency and preventing fibroblastic differentiation are poorly understood. Major hurdles to understanding how the maintenance of SSCs is regulated are (a) SSCs isolated from bone marrow are heterogeneous populations with different proliferative characteristics and (b) a lack of tools to investigate SSC number expansion and multipotency. Here, a nanotopographical surface is used as a tool that permits SSC proliferation while maintaining multipotency. It is demonstrated that retention of SSC phenotype in culture requires adjustments to the cell cycle that are linked to changes in the activation of the mitogen activated protein kinases. This demonstrates that biomaterials can offer cross-SSC culture tools and that the biological processes that determine whether SSCs retain multipotency or differentiate into fibroblasts are subtle, in terms of biochemical control, but are profound in terms of determining cell fate.
Keywords: Cell cycle; Mesenchymal stem cells; Nanotopography; Skeletal stem cells.
Copyright © 2016 The Authors. Published by Elsevier Ltd.. All rights reserved.
Figures
Similar articles
-
Extracellular matrix made by bone marrow cells facilitates expansion of marrow-derived mesenchymal progenitor cells and prevents their differentiation into osteoblasts.J Bone Miner Res. 2007 Dec;22(12):1943-56. doi: 10.1359/jbmr.070725. J Bone Miner Res. 2007. PMID: 17680726
-
Chondrogenic potential of human articular chondrocytes and skeletal stem cells: a comparative study.J Biomater Appl. 2015 Jan;29(6):824-36. doi: 10.1177/0885328214548604. Epub 2014 Aug 20. J Biomater Appl. 2015. PMID: 25145989 Free PMC article.
-
Skeletal ("mesenchymal") stem cells for tissue engineering.Methods Mol Med. 2007;140:83-99. doi: 10.1007/978-1-59745-443-8_5. Methods Mol Med. 2007. PMID: 18085204
-
Extrinsic and intrinsic factors controlling spermatogonial stem cell self-renewal and differentiation.Asian J Androl. 2015 May-Jun;17(3):347-54. doi: 10.4103/1008-682X.148080. Asian J Androl. 2015. PMID: 25657085 Free PMC article. Review.
-
Mesenchymal progenitors and the osteoblast lineage in bone marrow hematopoietic niches.Curr Osteoporos Rep. 2014 Mar;12(1):22-32. doi: 10.1007/s11914-014-0190-7. Curr Osteoporos Rep. 2014. PMID: 24477415 Free PMC article. Review.
Cited by
-
Enthesitis on Chip - A Model for Studying Acute and Chronic Inflammation of the Enthesis and its Pharmacological Treatment.Adv Healthc Mater. 2024 Dec;13(31):e2401815. doi: 10.1002/adhm.202401815. Epub 2024 Aug 27. Adv Healthc Mater. 2024. PMID: 39188199 Free PMC article.
-
Nanotopography reveals metabolites that maintain the immunomodulatory phenotype of mesenchymal stromal cells.Nat Commun. 2023 Feb 10;14(1):753. doi: 10.1038/s41467-023-36293-7. Nat Commun. 2023. PMID: 36765065 Free PMC article.
-
Harnessing Nanotopography to Enhance Osseointegration of Clinical Orthopedic Titanium Implants-An in Vitro and in Vivo Analysis.Front Bioeng Biotechnol. 2018 Apr 11;6:44. doi: 10.3389/fbioe.2018.00044. eCollection 2018. Front Bioeng Biotechnol. 2018. PMID: 29696140 Free PMC article.
-
Engineering Stepped Structures on Hydroxyapatite Surfaces: A Potential Strategy to Modulate Bone Marrow Mesenchymal Stem Adhesion, Spreading, and Proliferation.J Funct Biomater. 2025 May 8;16(5):165. doi: 10.3390/jfb16050165. J Funct Biomater. 2025. PMID: 40422830 Free PMC article.
-
Silver nanoparticle modified surfaces induce differentiation of mouse kidney-derived stem cells.RSC Adv. 2018 Jun 4;8(36):20334-20340. doi: 10.1039/c8ra02145g. eCollection 2018 May 30. RSC Adv. 2018. PMID: 35541676 Free PMC article.
References
-
- Watt F.M., Hogan B.L. Out of Eden: stem cells and their niches. Science. 2000;287(5457):1427–1430. - PubMed
-
- Bianco P. Bone and the hematopoietic niche: a tale of two stem cells. Blood. 2011;117(20):5281–5288. - PubMed
-
- Tare R.S., Babister J.C., Kanczler J., Oreffo R.O. Skeletal stem cells: phenotype, biology and environmental niches informing tissue regeneration. Mol. Cell. Endocrinol. 2008;288(1–2):11–21. - PubMed
MeSH terms
Substances
Grants and funding
- PG/10/26/28303/BHF_/British Heart Foundation/United Kingdom
- BB/D015324/1/BB_/Biotechnology and Biological Sciences Research Council/United Kingdom
- BB/L023814/1/BB_/Biotechnology and Biological Sciences Research Council/United Kingdom
- PG/15/15/31316/BHF_/British Heart Foundation/United Kingdom
- BB/K011235/1/BB_/Biotechnology and Biological Sciences Research Council/United Kingdom
LinkOut - more resources
Full Text Sources
Other Literature Sources
