. 2017 Feb:344:244-254.
doi: 10.1016/j.heares.2016.11.015. Epub 2016 Dec 1.

Tonotopic representation of loudness in the human cortex

Affiliations

Tonotopic representation of loudness in the human cortex

Andrew Thwaites et al. Hear Res. 2017 Feb.

Abstract

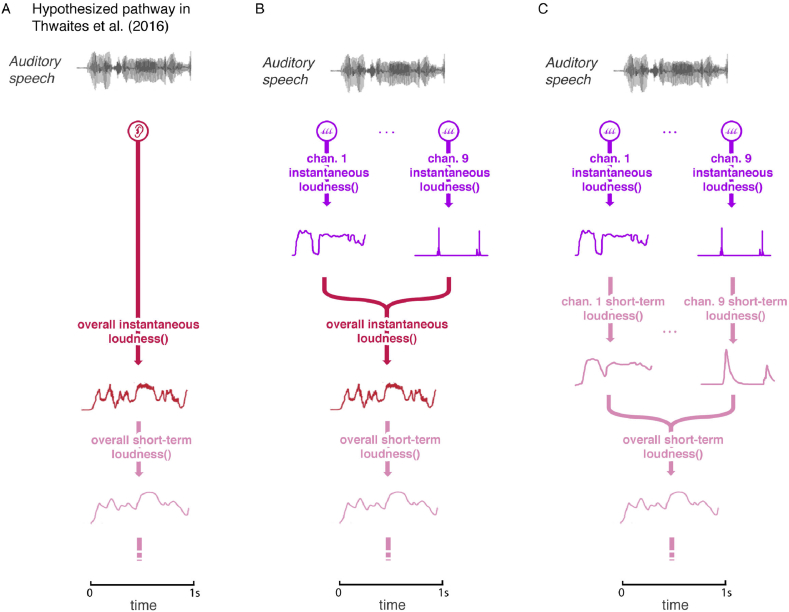
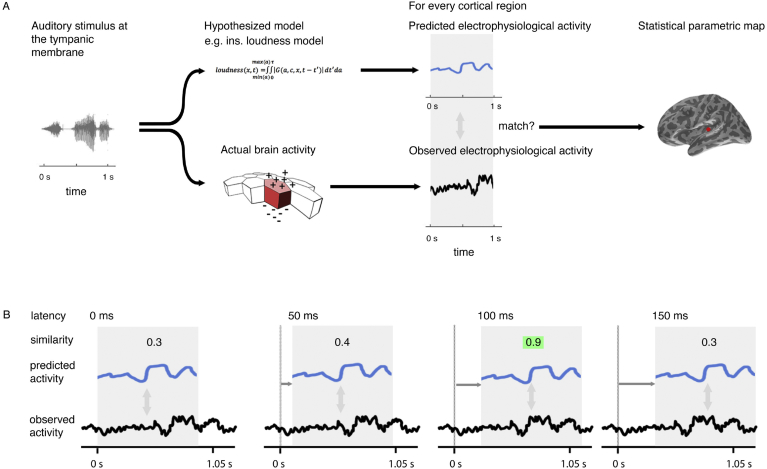
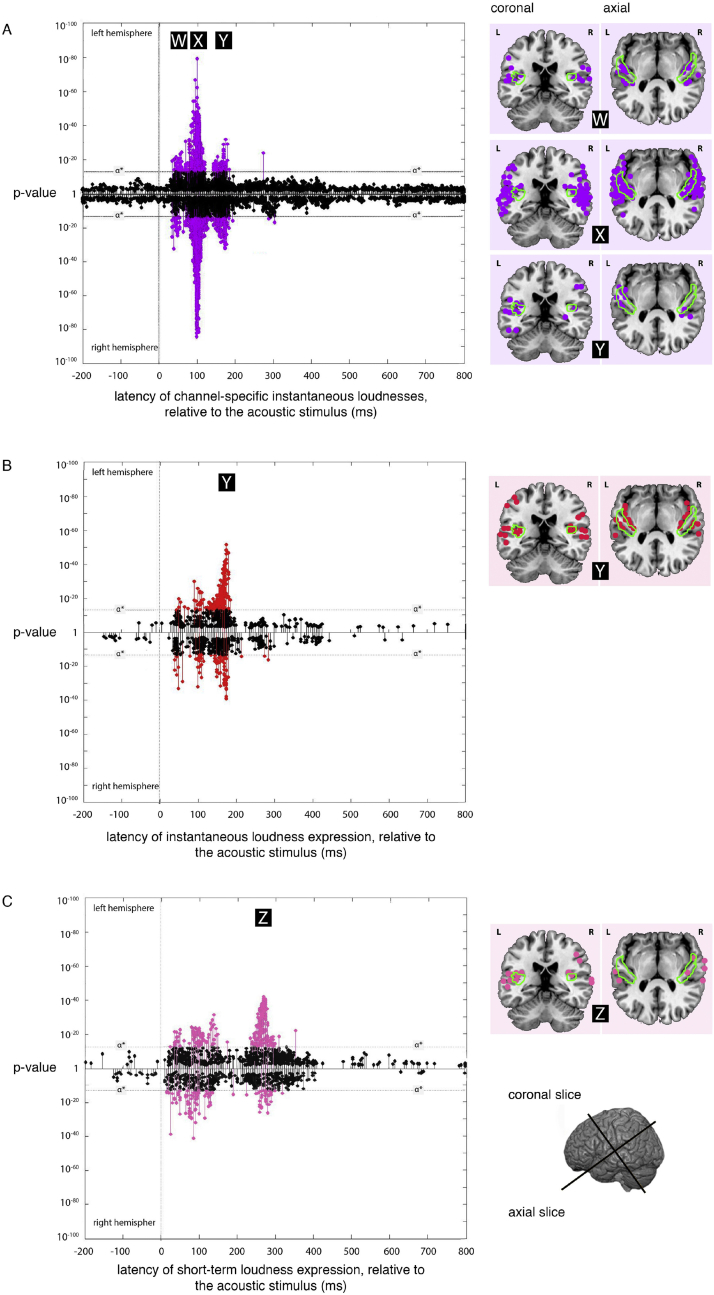
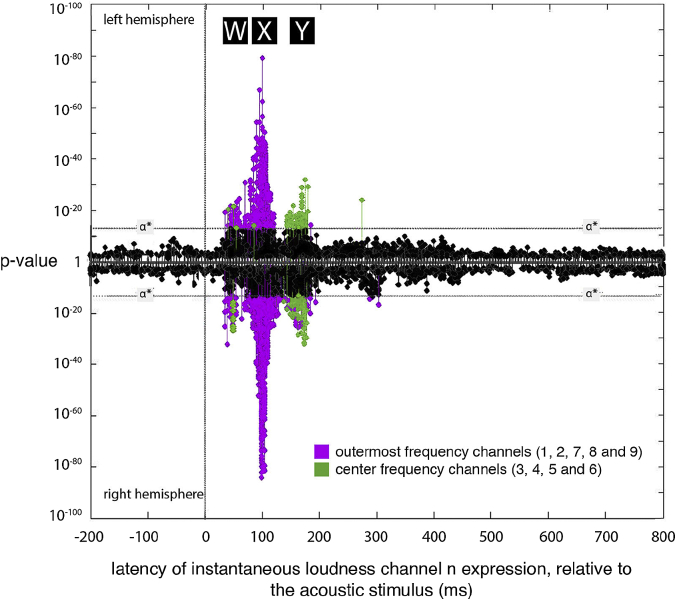
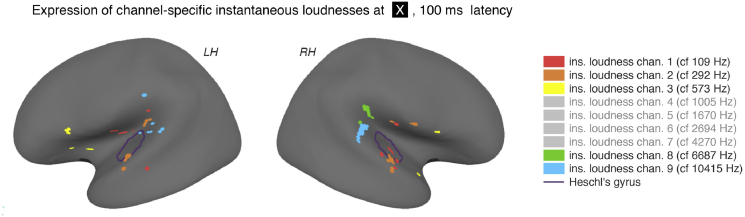
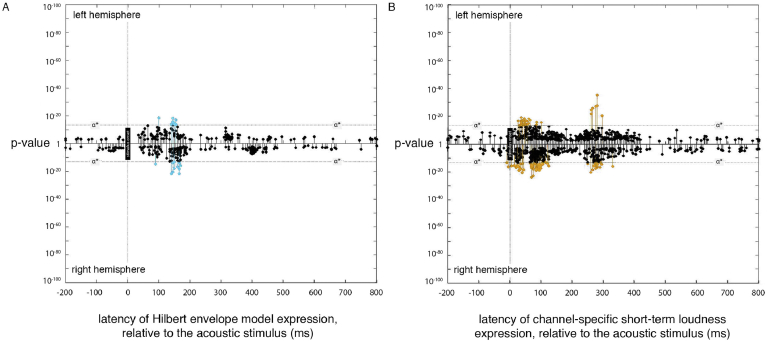
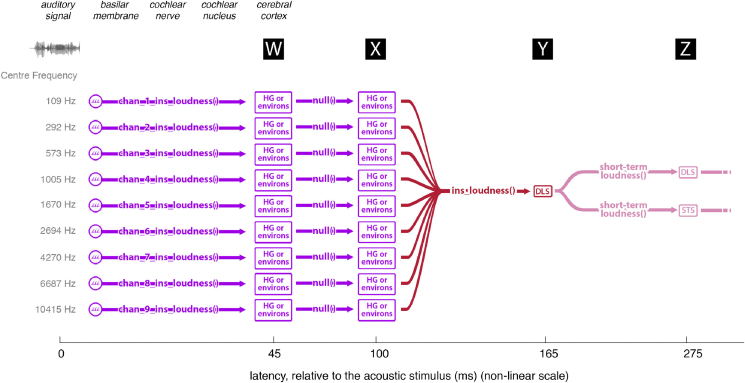
A prominent feature of the auditory system is that neurons show tuning to audio frequency; each neuron has a characteristic frequency (CF) to which it is most sensitive. Furthermore, there is an orderly mapping of CF to position, which is called tonotopic organization and which is observed at many levels of the auditory system. In a previous study (Thwaites et al., 2016) we examined cortical entrainment to two auditory transforms predicted by a model of loudness, instantaneous loudness and short-term loudness, using speech as the input signal. The model is based on the assumption that neural activity is combined across CFs (i.e. across frequency channels) before the transform to short-term loudness. However, it is also possible that short-term loudness is determined on a channel-specific basis. Here we tested these possibilities by assessing neural entrainment to the overall and channel-specific instantaneous loudness and the overall and channel-specific short-term loudness. The results showed entrainment to channel-specific instantaneous loudness at latencies of 45 and 100 ms (bilaterally, in and around Heschl's gyrus). There was entrainment to overall instantaneous loudness at 165 ms in dorso-lateral sulcus (DLS). Entrainment to overall short-term loudness occurred primarily at 275 ms, bilaterally in DLS and superior temporal sulcus. There was only weak evidence for entrainment to channel-specific short-term loudness.

Keywords: Entrainment; Loudness; Magnetoencephalography; Model expression; Temporal integration; Tonotopy.


Figures

Fig. 1
Fig. 1
Example of the stimulus and model predictions. A. The hypothesized pathway in Thwaites et al. (2016), with the predicted activity for the first 1-s of the stimulus. B. The hypothesized pathway when channel-specific instantaneous loudnesses (purple) are added to the model. C. The hypothesized pathway when channel-specific short-term loudnesses (pink) are calculated as a prerequisite before the overall short-term loudness. (For interpretation of the references to colour in this figure legend, the reader is referred to the web version of this article.)
Fig. 2
Fig. 2
Technique overview. First (A), the electrophysiological activity of the brain in response to a given stimulus (measured using EMEG) is matched to the pattern of neural activity predicted by the model being evaluated. Predicted and observed activity are tested for similarity and the resulting statistical parametric map displays the regions (sources) where the match is statistically significant. Second (B), this procedure is repeated at different lags (illustrated here from 0 to 150 ms) between the onset of the observed neural activity and the onset of the predicted output. The similarity is highest at a specific lag (highlighted). This produces a statistical parametric map that changes over time.
Fig. 3
Fig. 3
Expression plots for the channel-specific instantaneous loudness, instantaneous loudness and short-term loudness models. (A) Plot overlaying the expression of the nine channel-specific instantaneous loudness models across processing lags from −200 to +800 ms, relative to the acoustic signal. Results for the left and right hemispheres are plotted separately, with the right hemisphere plots inverted to allow comparison between hemispheres. The minimum p-values at a given source, over all latencies, are marked as ‘stems’. Stems at or above the stipulated value (p = 3 × 10−13) indicate significant expression of the channel-specific instantaneous loudness models that are not explained better by the other models tested. The cortical locations of significant sources at latencies W (45 ms), X (100 ms) and Y (165 ms) (labeled in black boxes) are indicated on the coronal and axial slices to the right of the plot. (B). Plot of the expression for the overall instantaneous loudness model across processing lags from −200 to +800 ms, relative to the acoustic signal. Again, the cortical locations of significant sources at latency Y (165 ms) (labeled in black box) are indicated on the coronal and axial slices to the right of the plot. (C). Plot of the expression for the short-term loudness model across processing lags from −200 to +800 ms, relative to the acoustic signal. The cortical locations of significant sources at latency Z (275 ms) (labeled in a black box) are indicated on the coronal and axial slices to the right of the plot. All three expression plots (with Fig. 6) implement models selected so that each source appears only once in the five plots. The boundary of the probabilistic anatomical parcellation of HG is shown in green (Rademacher et al., 1992; Fischl et al., 2004; Morosan et al., 2001). (For interpretation of the references to colour in this figure legend, the reader is referred to the web version of this article.)
Fig. 4
Fig. 4
Expression plot illustrating the differences between the ‘center’ and ‘outermost’ instantaneous loudness channels. The figure reproduces data from Fig. 3A, but with expressions for the ‘center’ and ‘outermost’ instantaneous loudness channels (channels 3, 4, 5, 6 and 1, 2, 7, 8, 9, respectively) colored purple and green, respectively. The plot shows that expression at ‘W’ and ‘X’ (labeled in black boxes) is strongest for the outermost channels, while expression at ‘Y’ is strongest for the channels in the center. (For interpretation of the references to colour in this figure legend, the reader is referred to the web version of this article.)
Fig. 5
Fig. 5
Positions of the expression for the channel-specific instantaneous loudnesses at 100 ms. The figure shows an inflated brain with the significant regions of entrainment to each of the nine tested instantaneous loudness channels, at 100 ms. Channels with no significant expression at this latency are ghosted in the key. For display purposes, only the top seven most significant vertices for each channels are shown. The boundary of HG, taken from the Desikan-Kilkenny-Tourville-40 cortical labeling atlas (Klein and Tourville, 2012), is also shown.
Fig. 6
Fig. 6
Expression plot for the Hilbert envelope and channel-specific short-term loudness model. (A) Plot of expression of the Hilbert envelope model (across processing lags from −200 to +800 ms, relative to the acoustic signal), showing the latencies of significant expression with the Hilbert model. (B) Plot of expression of the nine channel-specific short-term loudness models. All nine expression plots for each channel are overlaid into a single plot.
Fig. 7
Fig. 7
Implied pathway of loudness information. The figure illustrates one interpretation of the pathway suggested by the findings of this study, with latencies W, X, Y and Z (labeled in black boxes), corresponding to those same labels in Fig. 3A, B and C. First, the channel-specific instantaneous loudness transforms are applied, with the result of these transformations being entrained in or around HG at 45 ms (locations are approximate due to the source localization error). This information is then moved or copied (seemingly untransformed) to other areas located in HG or its environs (at 100-ms latency). The information in each of these channels is then combined to form instantaneous loudness, expressed in the DLS at 165 ms. From here, the instantaneous loudness is transformed to the short-term loudness, to be entrained in both the DLS and superior temporal sulcus (at 275 ms latency).

References

    1. Baumann S., Petkov C.I., Griffiths T.D. A unified framework for the organization of the primate auditory cortex. Front. Syst. Neurosci. 2013;7:11. - PMC - PubMed
    1. Brainard D.H. The psychophysics Toolbox. Spat. Vis. 1997;10:433–436. - PubMed
    1. Chalupper J., Fastl H. Dynamic loudness model (DLM) for normal and hearing impaired listeners. Acta Acust. United Acust. 2002;88:378–386.
    1. Crouzet O., Ainsworth W.A. Workshop on Consistent and Reliable Cues for Sound Analysis (pp. 1–4). Aalborg, Denmark. 2001. On the various instances of envelope information on the perception of speech in adverse conditions: an analysis of between-channel envelope correlation.
    1. Davis M., Sigal R., Weyuker E.J. Morgan Kaufmann; Burlington, MA: 1994. Computability, Complexity, and Languages: Fundamentals of Theoretical Computer Science.

Publication types

MeSH terms