

Development of neural population activity toward self-organized criticality
- PMID: 27915209
- PMCID: PMC7611021
- DOI: 10.1016/j.neuroscience.2016.11.031
Development of neural population activity toward self-organized criticality
Abstract
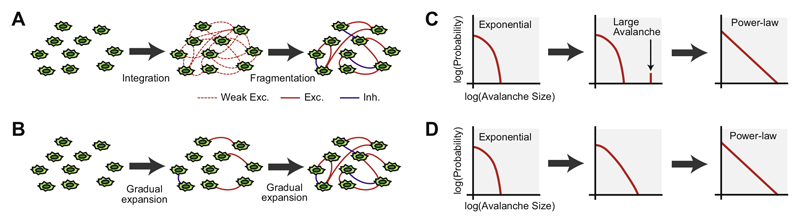
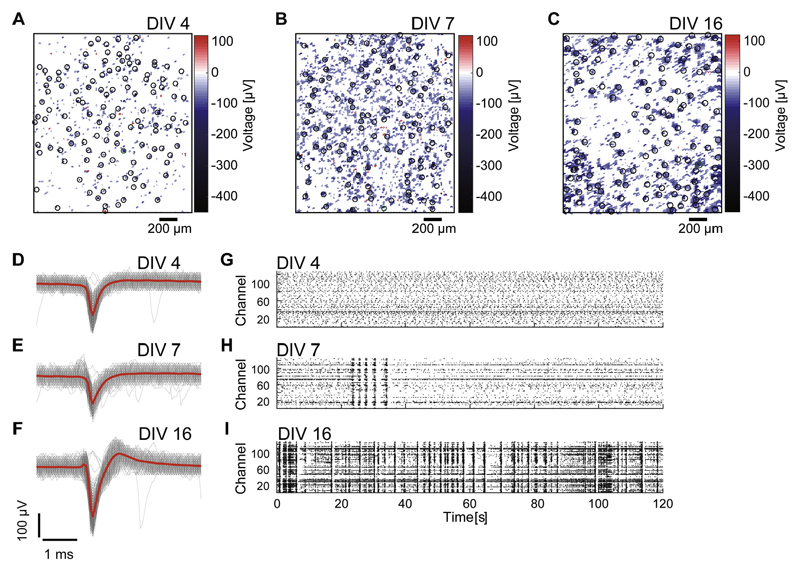
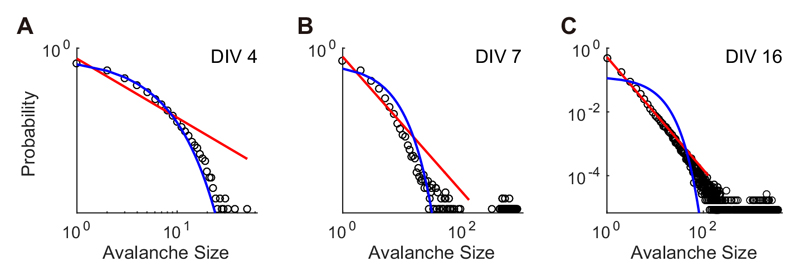
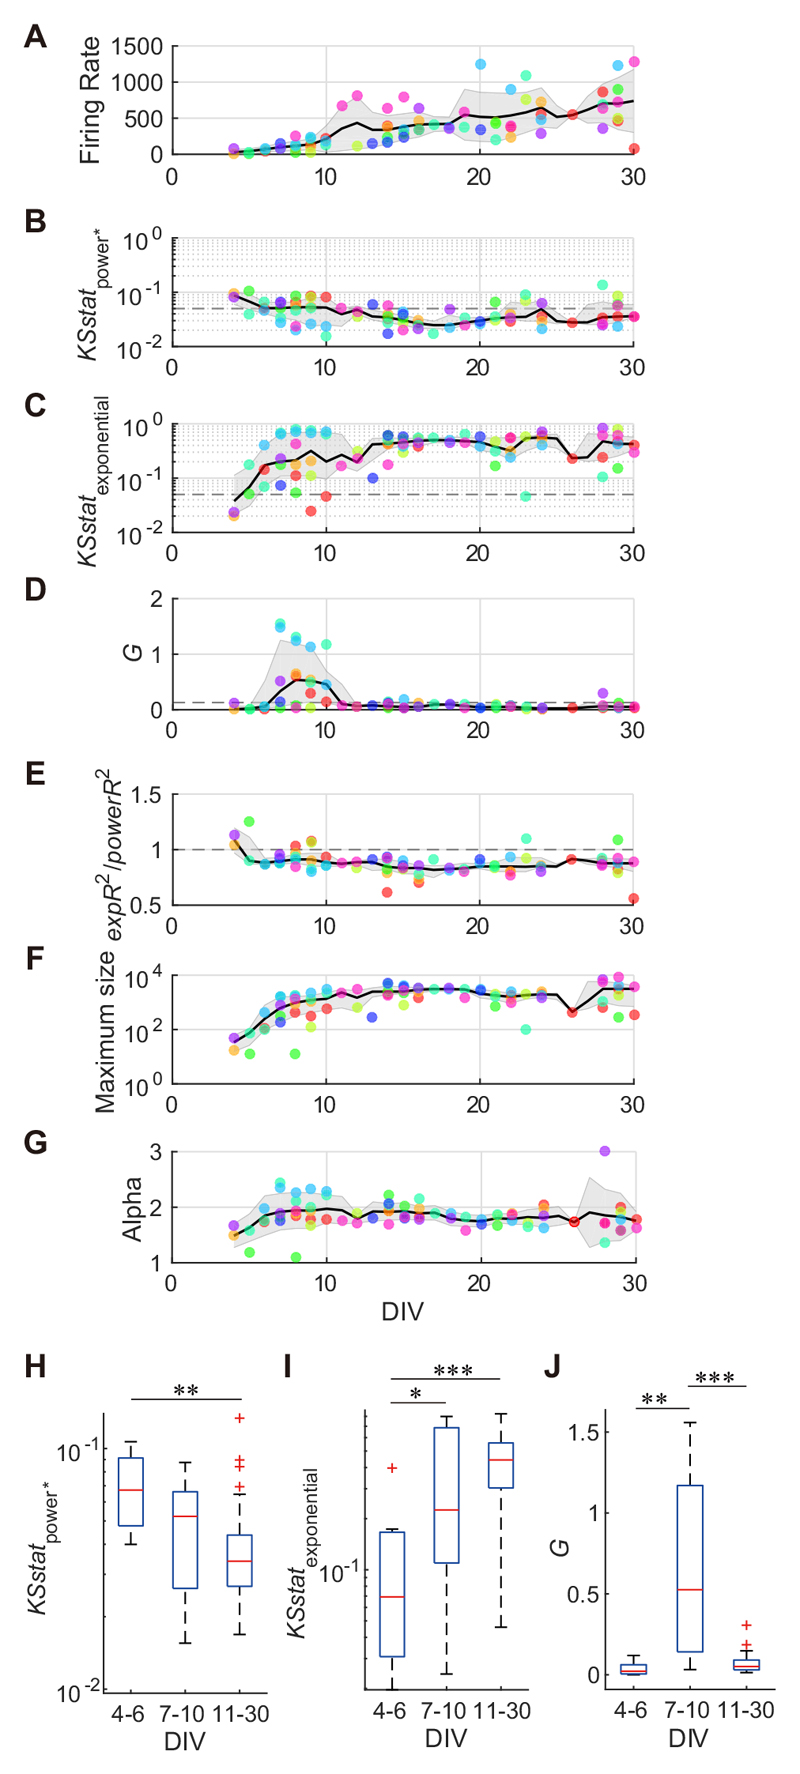
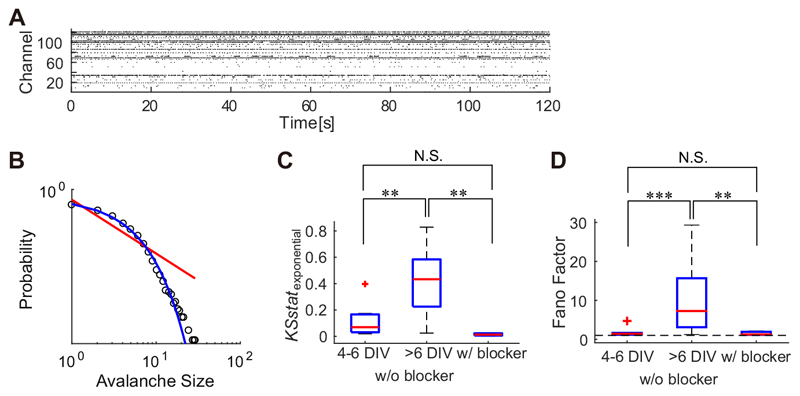
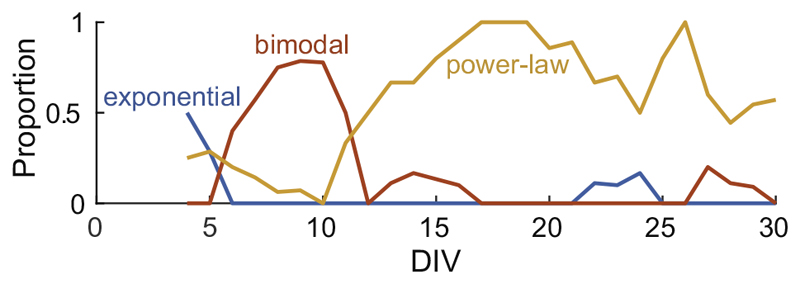
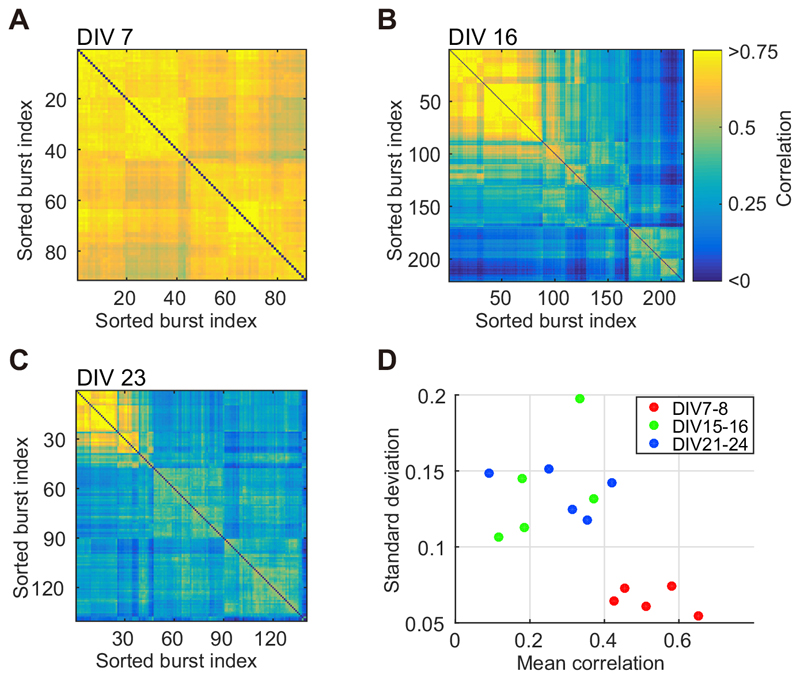
Self-organized criticality (SoC), a spontaneous dynamic state established and maintained in networks of moderate complexity, is a universal characteristic of neural systems. Such systems produce cascades of spontaneous activity that are typically characterized by power-law distributions and rich, stable spatiotemporal patterns (i.e., neuronal avalanches). Since the dynamics of the critical state confer advantages in information processing within neuronal networks, it is of great interest to determine how criticality emerges during development. One possible mechanism is developmental, and includes axonal elongation during synaptogenesis and subsequent synaptic pruning in combination with the maturation of GABAergic inhibition (i.e., the integration then fragmentation process). Because experimental evidence for this mechanism remains inconclusive, we studied the developmental variation of neuronal avalanches in dissociated cortical neurons using high-density complementary metal-oxide semiconductor (CMOS) microelectrode arrays (MEAs). The spontaneous activities of nine cultures were monitored using CMOS MEAs from 4 to 30days in vitro (DIV) at single-cell spatial resolution. While cells were immature, cultures demonstrated random-like patterns of activity and an exponential avalanche size distribution; this distribution was followed by a bimodal distribution, and finally a power-law-like distribution. The bimodal distribution was associated with a large-scale avalanche with a homogeneous spatiotemporal pattern, while the subsequent power-law distribution was associated with diverse patterns. These results suggest that the SoC emerges through a two-step process: the integration process accompanying the characteristic large-scale avalanche and the fragmentation process associated with diverse middle-size avalanches.
Keywords: dissociated culture; microelectrode array; neuronal avalanche; self-organized criticality.
Copyright © 2016 IBRO. Published by Elsevier Ltd. All rights reserved.
Figures
Similar articles
-
Self-organization and neuronal avalanches in networks of dissociated cortical neurons.Neuroscience. 2008 Jun 2;153(4):1354-69. doi: 10.1016/j.neuroscience.2008.03.050. Epub 2008 Mar 29. Neuroscience. 2008. PMID: 18448256
-
Structural Modularity Tunes Mesoscale Criticality in Biological Neuronal Networks.J Neurosci. 2023 Apr 5;43(14):2515-2526. doi: 10.1523/JNEUROSCI.1420-22.2023. Epub 2023 Mar 3. J Neurosci. 2023. PMID: 36868860 Free PMC article.
-
Neuronal avalanches are diverse and precise activity patterns that are stable for many hours in cortical slice cultures.J Neurosci. 2004 Jun 2;24(22):5216-29. doi: 10.1523/JNEUROSCI.0540-04.2004. J Neurosci. 2004. PMID: 15175392 Free PMC article.
-
Multi-electrode array recordings of neuronal avalanches in organotypic cultures.J Vis Exp. 2011 Aug 1;(54):2949. doi: 10.3791/2949. J Vis Exp. 2011. PMID: 21841767 Free PMC article.
-
Active High-Density Electrode Arrays: Technology and Applications in Neuronal Cell Cultures.Adv Neurobiol. 2019;22:253-273. doi: 10.1007/978-3-030-11135-9_11. Adv Neurobiol. 2019. PMID: 31073940 Review.
Cited by
-
Dissociated neuronal cultures as model systems for self-organized prediction.Front Neural Circuits. 2025 Jun 25;19:1568652. doi: 10.3389/fncir.2025.1568652. eCollection 2025. Front Neural Circuits. 2025. PMID: 40635884 Free PMC article. Review.
-
Nrf1 acts as a highly-conserved determinon for maintaining robust redox homeostasis in the eco-evo-devo process of life histories.Cell Stress. 2025 Jul 7;9:65-142. doi: 10.15698/cst2025.07.306. eCollection 2025. Cell Stress. 2025. PMID: 40703332 Free PMC article. Review.
-
Disordered network structure and function in dystonia: pathological connectivity vs. adaptive responses.Cereb Cortex. 2023 May 24;33(11):6943-6958. doi: 10.1093/cercor/bhad012. Cereb Cortex. 2023. PMID: 36749014 Free PMC article.
-
Inflammatory cytokine-induced changes in neural network activity measured by waveform analysis of high-content calcium imaging in murine cortical neurons.Sci Rep. 2017 Aug 22;7(1):9037. doi: 10.1038/s41598-017-09182-5. Sci Rep. 2017. PMID: 28831096 Free PMC article.
-
Connectomics of Morphogenetically Engineered Neurons as a Predictor of Functional Integration in the Ischemic Brain.Front Neurol. 2019 Jun 12;10:630. doi: 10.3389/fneur.2019.00630. eCollection 2019. Front Neurol. 2019. PMID: 31249553 Free PMC article. Review.
References
-
- Ben-Ari Y. Developing networks play a similar melody. Trends Neurosci. 2001;24:353–360. - PubMed
Publication types
MeSH terms
Substances
Grants and funding
LinkOut - more resources
Full Text Sources
Other Literature Sources
