

Differences in the mutational landscape of triple-negative breast cancer in African Americans and Caucasians
- PMID: 27915434
- PMCID: PMC5243212
- DOI: 10.1007/s10549-016-4062-y
Differences in the mutational landscape of triple-negative breast cancer in African Americans and Caucasians
Abstract
Background: Triple-negative breast cancer (TNBC) occurs at higher frequency in African Americans compared with Caucasians. It is unclear if the biology of TNBC is different in African American versus Caucasians. In this study, we sought to evaluate racial differences in the molecular pathology of TNBC.
Methods: Using data from The Cancer Genome Atlas, we identified TNBC patients with information on race. We analyzed differences in clinical characteristics, tumor somatic mutations, and gene expression patterns by race from whole exome and microarray data.
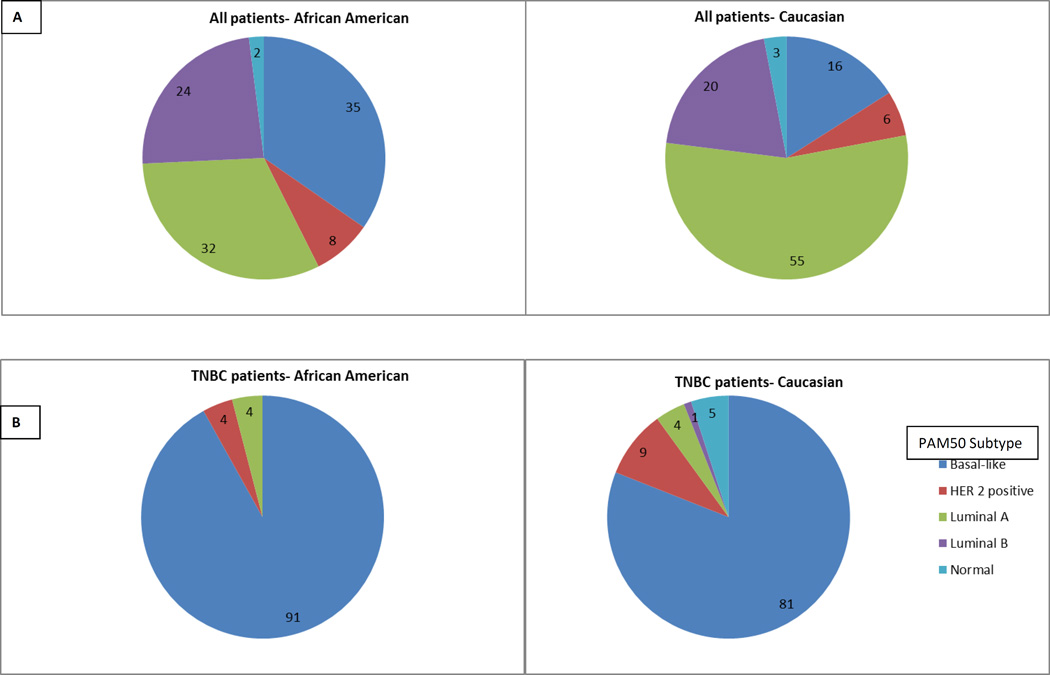
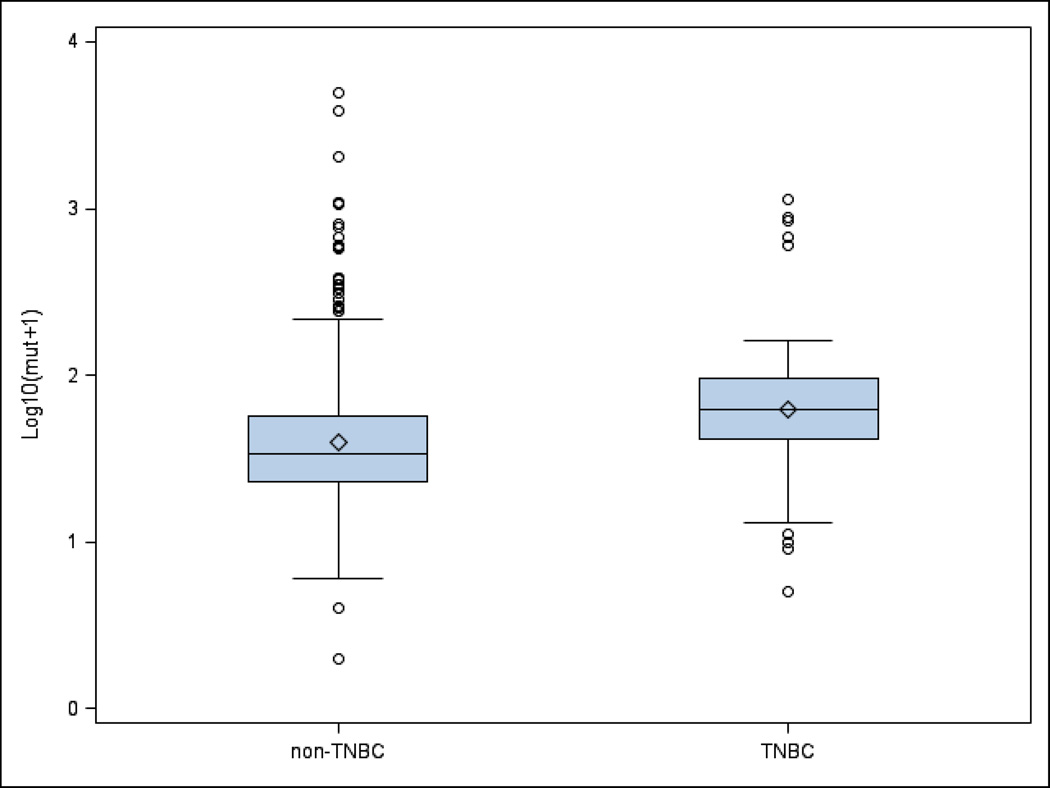
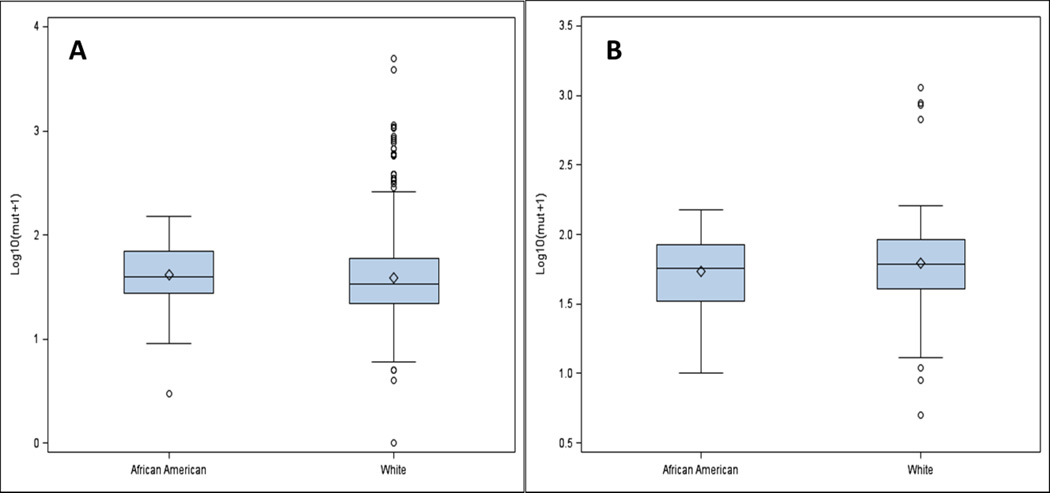
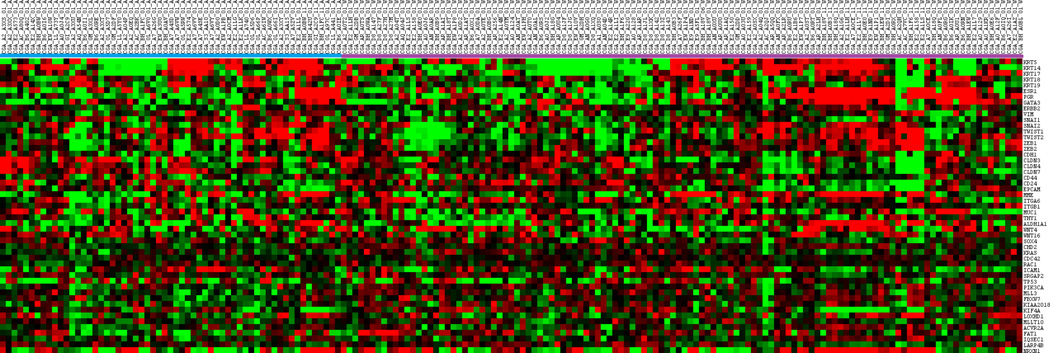
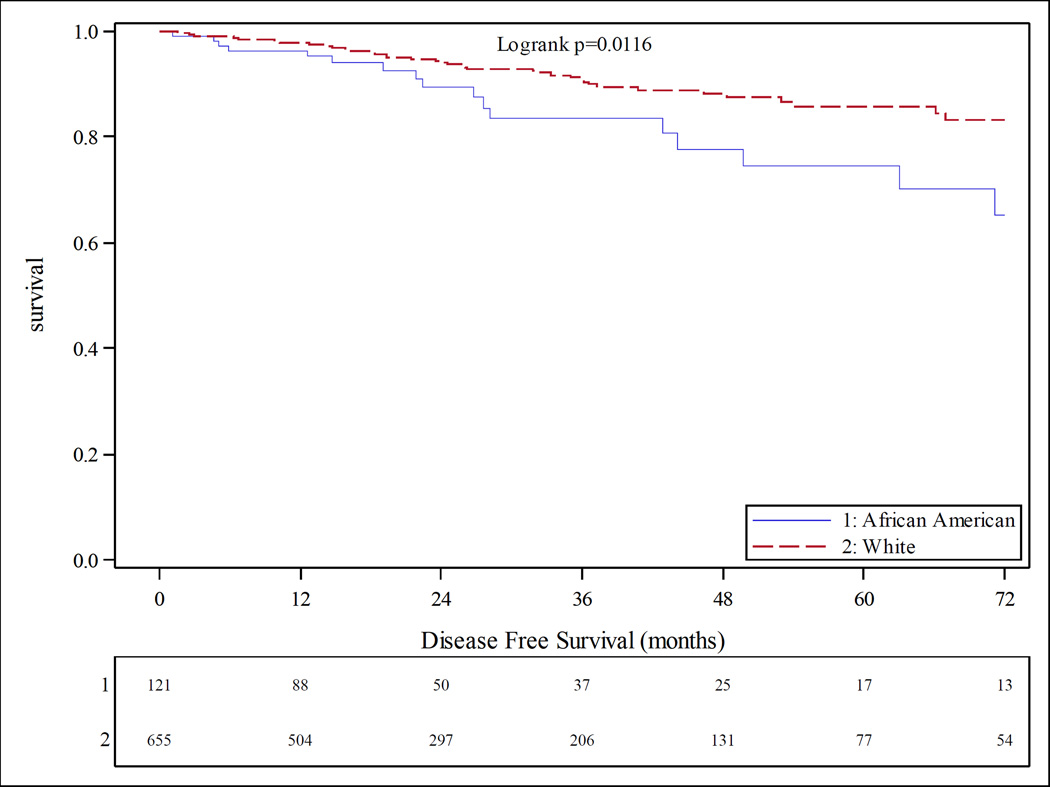
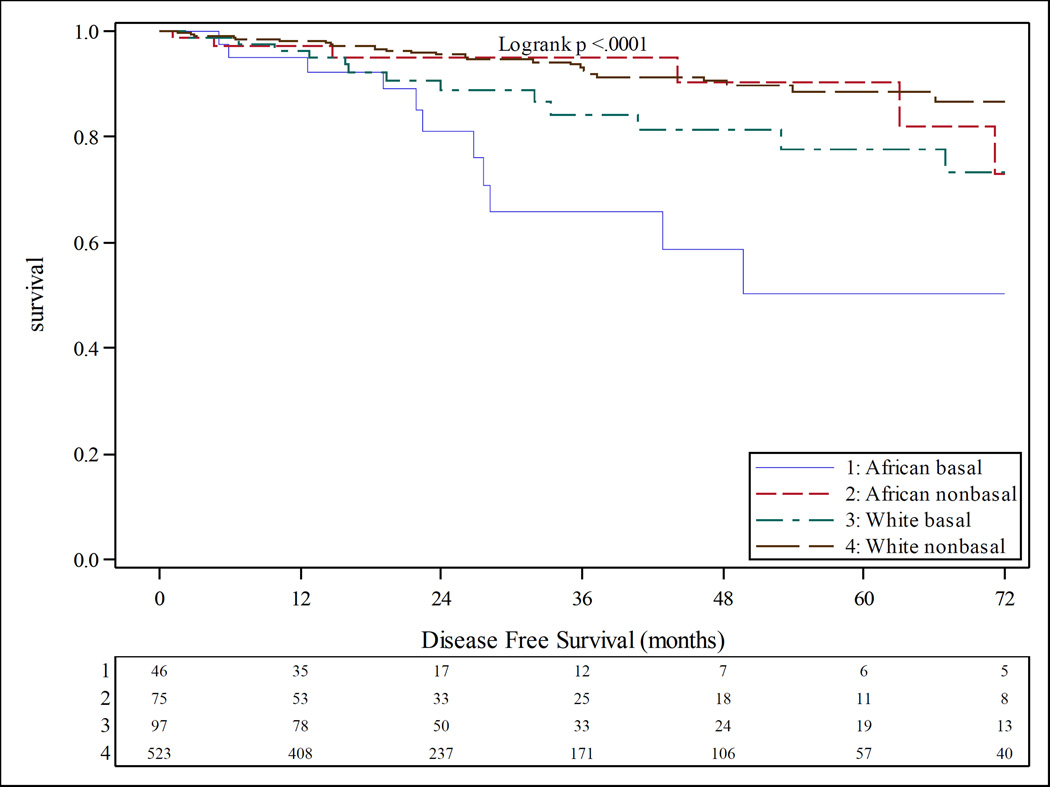
Results: 1104 patients were identified, of which 178 had TNBC. TNBC was more frequent in African Americans than Caucasians (33.3 vs 14.9%). Although more African Americans than Caucasians overall were classified as basal-like from PAM50 gene expression (34.8 vs 16.1%), no differences in the TNBC cohort were observed. Median tumor somatic mutation counts were higher in African Americans versus Caucasians (39.5 vs 34), but no racial differences in the mutation counts in TNBC were observed. Somatic mutation analysis revealed racial differences in specific high prevalence genes in all patients (TP53 46% in African Americans vs 27% in Caucasians; PIK3CA 23% in African Americans vs 34% in Caucasians; and MLL3 12% in African Americans vs 6% in Caucasians). TNBC patients did not have any specific high prevalence genes associated with racial differences. There were no racial differences in gene expression patterns in selected genes involved in breast cancer biology. Overall, African Americans had shorter TTP and worse DFS. Racial differences in clinical outcomes were not observed in TNBC.
Conclusion: The mutational landscape of TNBC is similar between African Americans and Caucasians. The higher frequency of TNBC in African Americans is therefore not associated with a different genomic profile of commonly established tumor regulatory pathway genes. Other modifiable factors may exist that contribute to the racial disparity in TNBC.
Keywords: Genomics; Survival; Triple negative breast cancer.
Conflict of interest statement
Foluso Ademuyiwa, Yu Tao, Jingqin Luo, Cynthia Ma, and Katherine Weilbaecher declare no conflicts of interest.
Figures
References
-
- Bauer KR, Brown M, Cress RD, Parise CA, Caggiano V. Descriptive analysis of estrogen receptor (ER)-negative, progesterone receptor (PR)-negative, and HER2-negative invasive breast cancer, the so-called triple-negative phenotype: a population-based study from the California cancer Registry. Cancer. 2007;109:1721–1728. - PubMed
-
- Bernards R, Weinberg RA. A progression puzzle. Nature. 2002;418:823. - PubMed
-
- Carey LA, Perou CM, Livasy CA, Dressler LG, Cowan D, Conway K, Karaca G, Troester MA, Tse CK, Edmiston S, Deming SL, Geradts J, Cheang MC, Nielsen TO, Moorman PG, Earp HS, Millikan RC. Race, breast cancer subtypes, and survival in the Carolina Breast Cancer Study. Jama. 2006;295:2492–2502. - PubMed
-
- Centers for Disease C, Prevention. Differences in prevalence of obesity among black, white, and Hispanic adults - United States, 2006–2008. MMWR. Morbidity and mortality weekly report. 2009;58:740–744. - PubMed
MeSH terms
Substances
Grants and funding
LinkOut - more resources
Full Text Sources
Other Literature Sources
Research Materials
Miscellaneous
