

Fluorescent Visualization of Cellular Proton Fluxes
- PMID: 27916567
- PMCID: PMC5182157
- DOI: 10.1016/j.chembiol.2016.10.013
Fluorescent Visualization of Cellular Proton Fluxes
Abstract
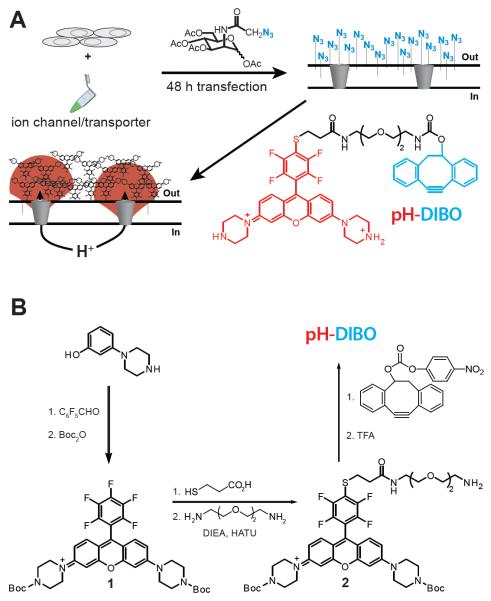
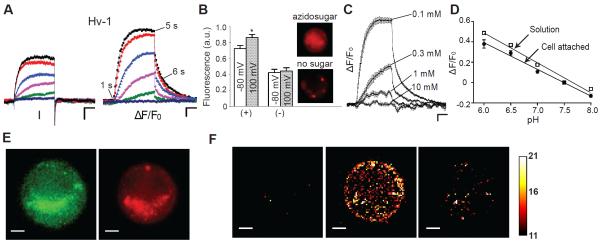
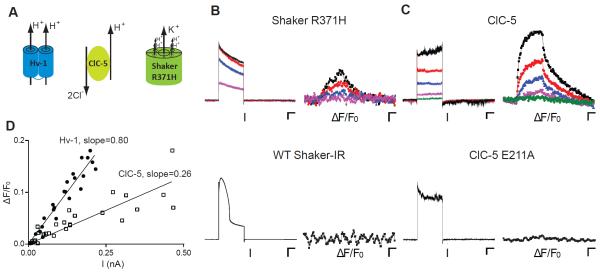
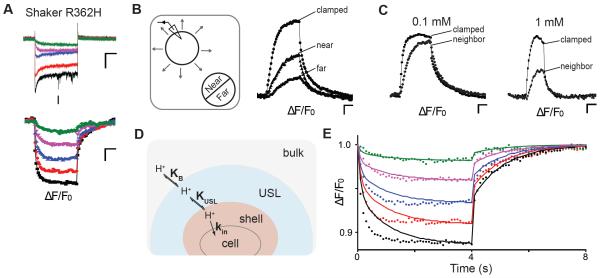
Cells use plasma membrane proton fluxes to maintain cytoplasmic and extracellular pH and to mediate the co-transport of metabolites and ions. Because proton-coupled transport often involves movement of multiple substrates, traditional electrical measurements provide limited information about proton transport at the cell surface. Here we visualize voltage-dependent proton fluxes over the entire landscape of a cell by covalently attaching small-molecule fluorescent pH sensors to the cell's glycocalyx. We found that the extracellularly facing sensors enable real-time detection of proton accumulation and depletion at the plasma membrane, providing an indirect readout of channel and transporter activity that correlated with whole-cell proton current. Moreover, the proton wavefront emanating from one cell was readily visible as it crossed over nearby cells. Given that any small-molecule fluorescent sensor can be covalently attached to a cell's glycocalyx, our approach is readily adaptable to visualize most electrogenic and non-electrogenic transport events at the plasma membrane.
Keywords: glycocalyx; membrane transport; pH; proton-coupled transport; voltage-gatedion channels.
Copyright © 2016 Elsevier Ltd. All rights reserved.
Figures
Similar articles
-
Wheat germ agglutinin-conjugated fluorescent pH sensors for visualizing proton fluxes.J Gen Physiol. 2020 Jun 1;152(6):e201912498. doi: 10.1085/jgp.201912498. J Gen Physiol. 2020. PMID: 31978216 Free PMC article.
-
Measurement of Rapid Amiloride-Dependent pH Changes at the Cell Surface Using a Proton-Sensitive Field-Effect Transistor.Biosensors (Basel). 2016 Mar 30;6(2):11. doi: 10.3390/bios6020011. Biosensors (Basel). 2016. PMID: 27043644 Free PMC article.
-
Ion fluxes in giant excised cardiac membrane patches detected and quantified with ion-selective microelectrodes.J Gen Physiol. 2003 Apr;121(4):325-47. doi: 10.1085/jgp.200208777. J Gen Physiol. 2003. PMID: 12668735 Free PMC article.
-
Electron and proton transport by NADPH oxidases.Philos Trans R Soc Lond B Biol Sci. 2005 Dec 29;360(1464):2315-25. doi: 10.1098/rstb.2005.1769. Philos Trans R Soc Lond B Biol Sci. 2005. PMID: 16321802 Free PMC article. Review.
-
Voltage-gated proton channels and other proton transfer pathways.Physiol Rev. 2003 Apr;83(2):475-579. doi: 10.1152/physrev.00028.2002. Physiol Rev. 2003. PMID: 12663866 Review.
Cited by
-
Highlights for the 6th International Ion Channel Conference: ion channel structure, function, disease and therapeutics.Acta Pharm Sin B. 2017 Nov;7(6):665-669. doi: 10.1016/j.apsb.2017.09.007. Epub 2017 Oct 26. Acta Pharm Sin B. 2017. PMID: 29159026 Free PMC article.
-
Activation-pathway transitions in human voltage-gated proton channels revealed by a non-canonical fluorescent amino acid.Elife. 2023 Jan 25;12:e85836. doi: 10.7554/eLife.85836. Elife. 2023. PMID: 36695566 Free PMC article.
-
The Proton-Coupled Monocarboxylate Transporter Hermes Is Necessary for Autophagy during Cell Death.Dev Cell. 2018 Nov 5;47(3):281-293.e4. doi: 10.1016/j.devcel.2018.09.015. Epub 2018 Oct 11. Dev Cell. 2018. PMID: 30318245 Free PMC article.
-
Wheat germ agglutinin-conjugated fluorescent pH sensors for visualizing proton fluxes.J Gen Physiol. 2020 Jun 1;152(6):e201912498. doi: 10.1085/jgp.201912498. J Gen Physiol. 2020. PMID: 31978216 Free PMC article.
-
Exploiting metabolic glycoengineering to advance healthcare.Nat Rev Chem. 2019 Oct;3(10):605-620. doi: 10.1038/s41570-019-0126-y. Epub 2019 Sep 6. Nat Rev Chem. 2019. PMID: 31777760 Free PMC article.
References
Grants and funding
LinkOut - more resources
Full Text Sources
Other Literature Sources
