. 2016 Dec 12;30(6):849-862.
doi: 10.1016/j.ccell.2016.11.002. Epub 2016 Dec 1.

Characterization of Rare, Dormant, and Therapy-Resistant Cells in Acute Lymphoblastic Leukemia

Affiliations

Characterization of Rare, Dormant, and Therapy-Resistant Cells in Acute Lymphoblastic Leukemia

Sarah Ebinger et al. Cancer Cell. .

Abstract

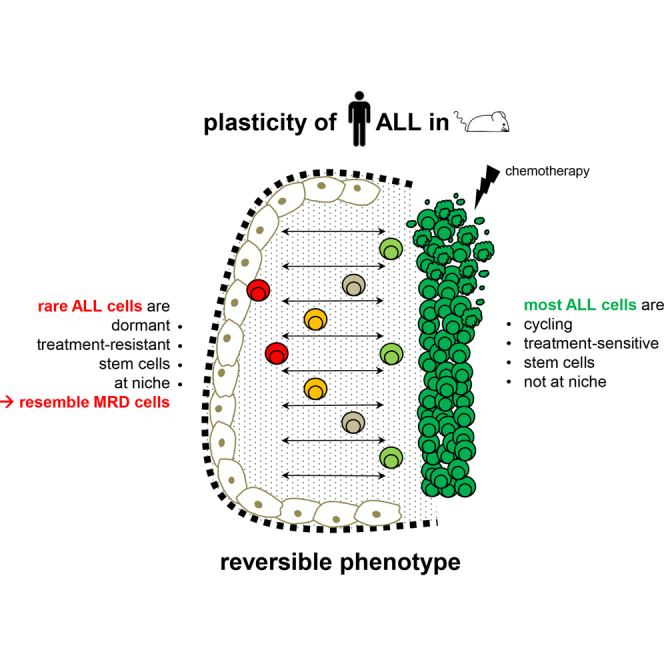
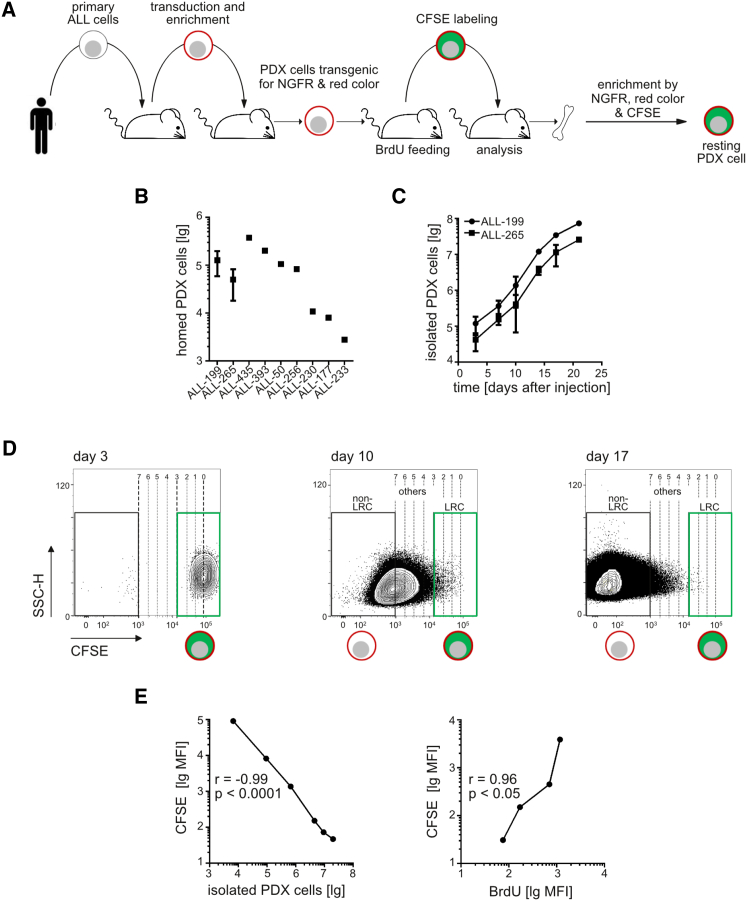
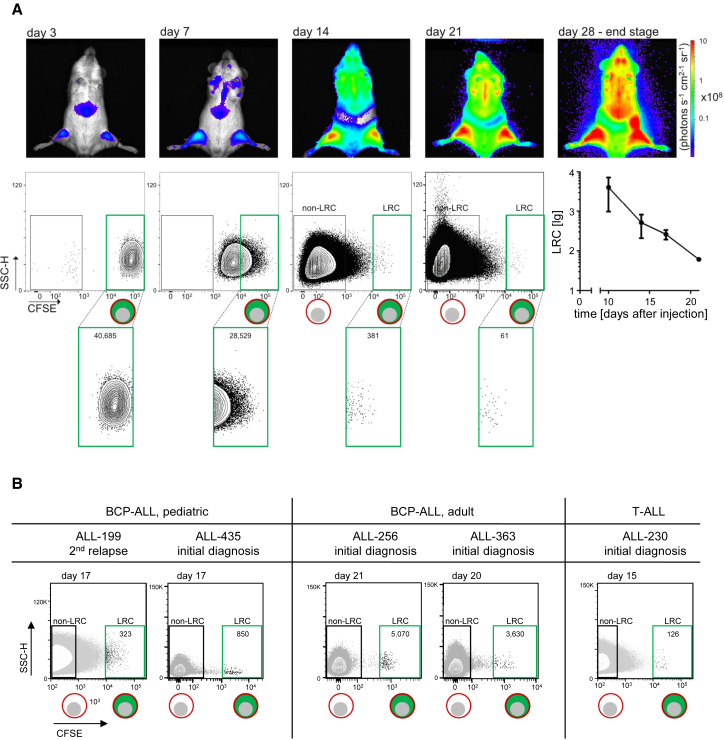
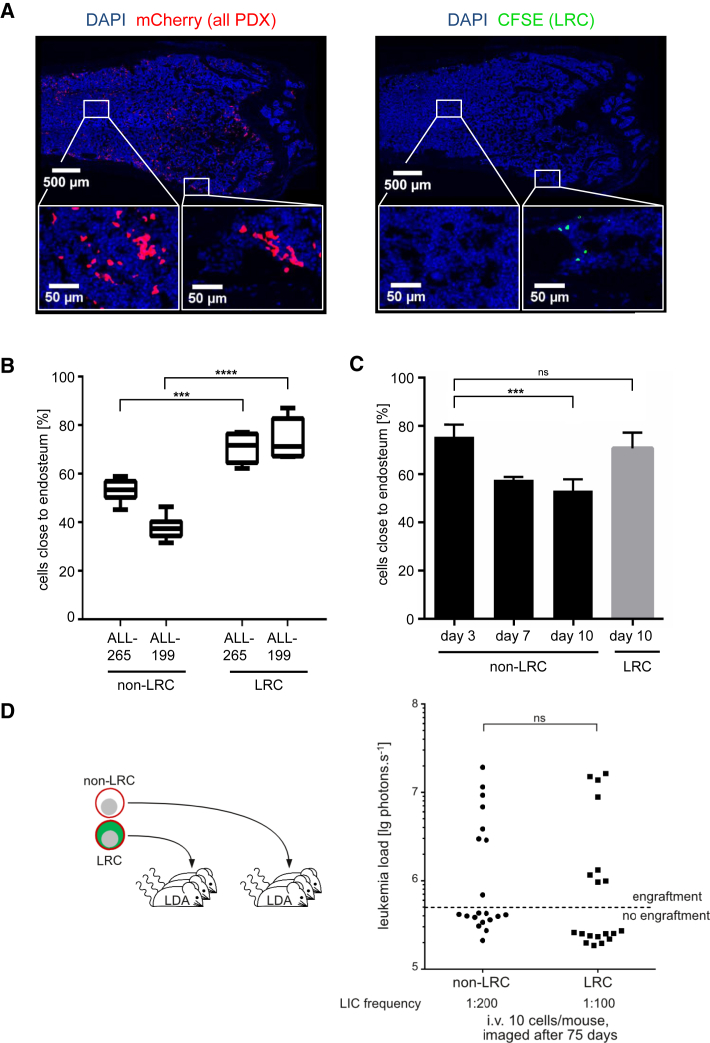
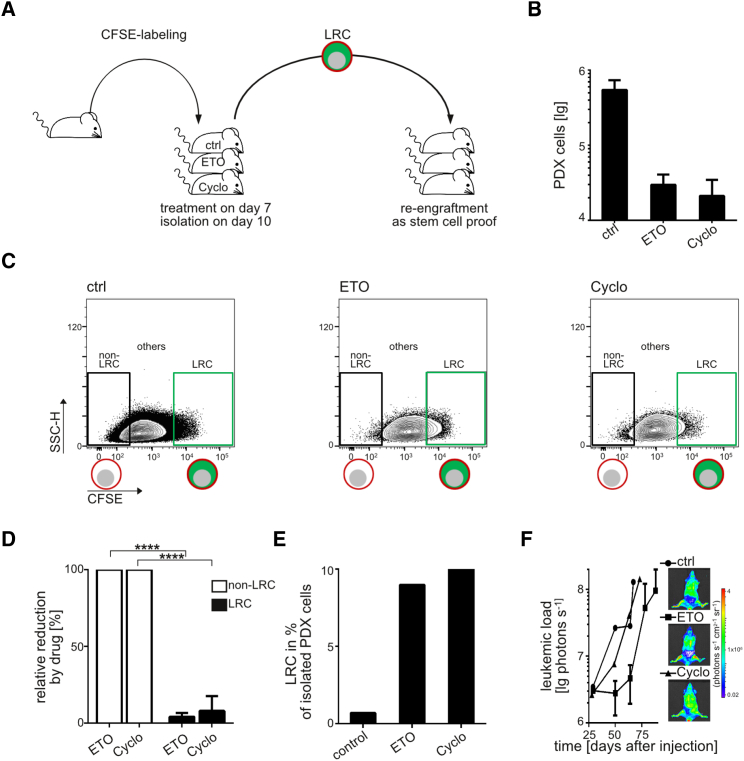
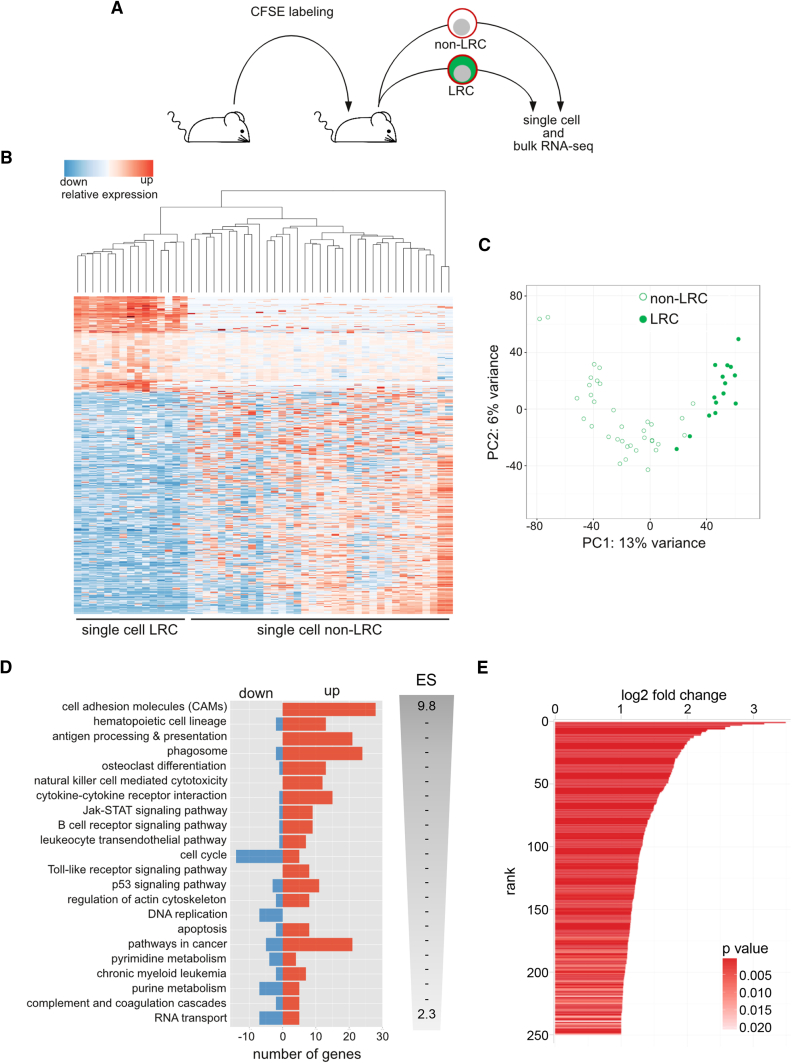
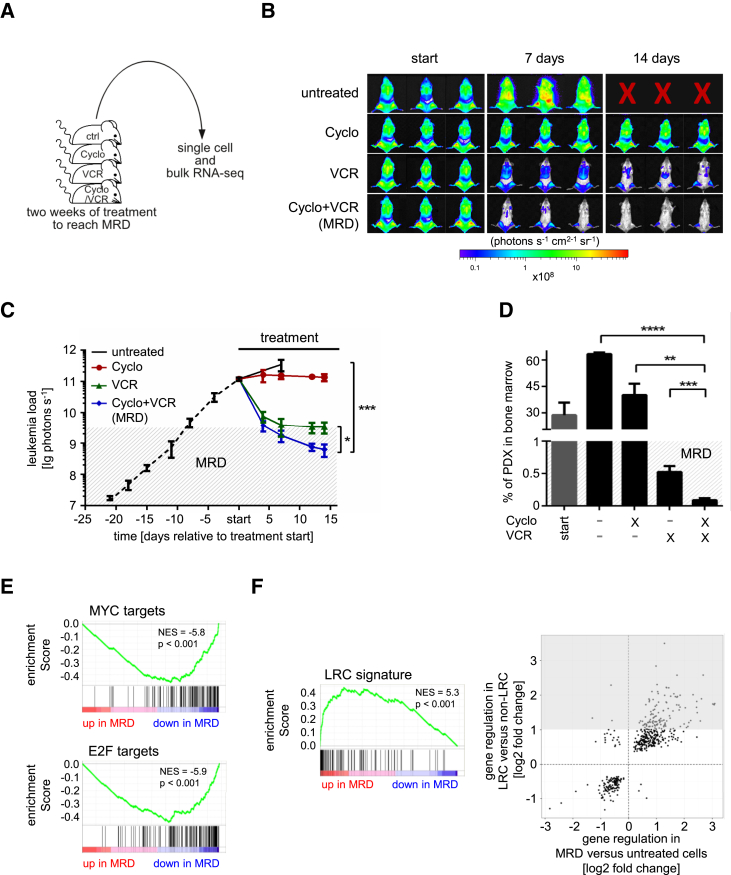
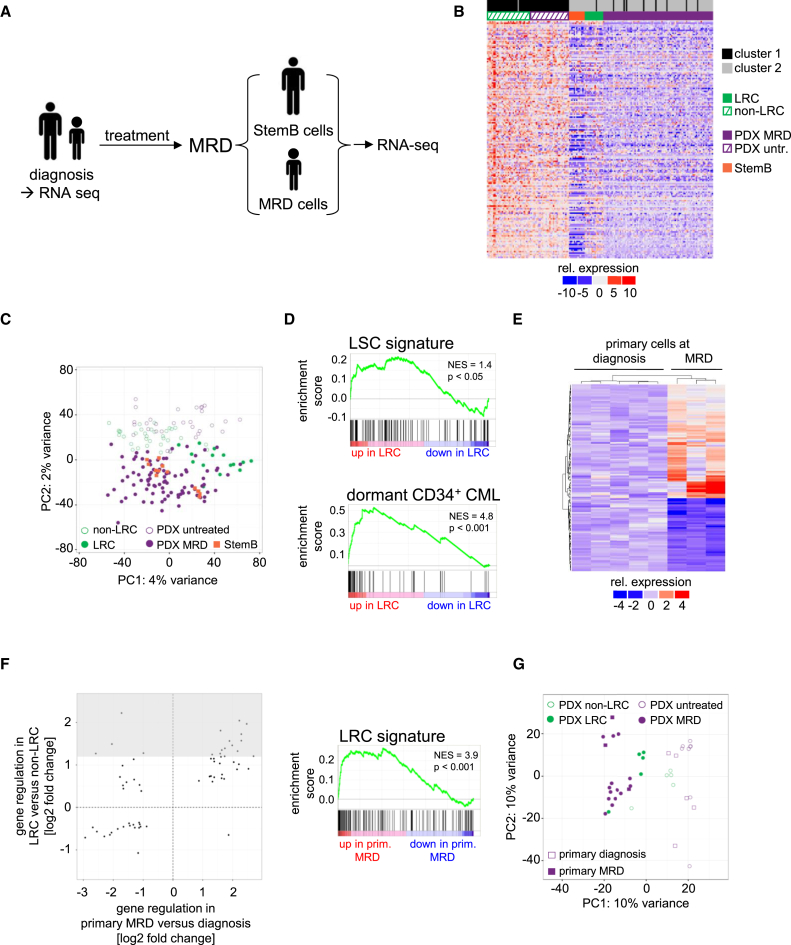
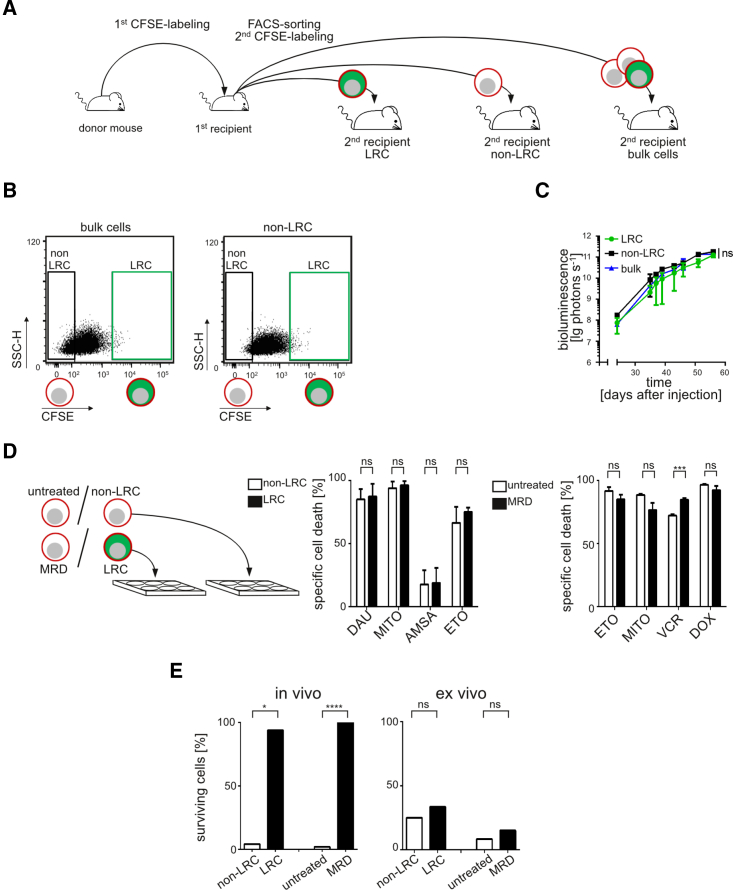
Tumor relapse is associated with dismal prognosis, but responsible biological principles remain incompletely understood. To isolate and characterize relapse-inducing cells, we used genetic engineering and proliferation-sensitive dyes in patient-derived xenografts of acute lymphoblastic leukemia (ALL). We identified a rare subpopulation that resembled relapse-inducing cells with combined properties of long-term dormancy, treatment resistance, and stemness. Single-cell and bulk expression profiling revealed their similarity to primary ALL cells isolated from pediatric and adult patients at minimal residual disease (MRD). Therapeutically adverse characteristics were reversible, as resistant, dormant cells became sensitive to treatment and started proliferating when dissociated from the in vivo environment. Our data suggest that ALL patients might profit from therapeutic strategies that release MRD cells from the niche.

Keywords: Cancer stem cells; RNA single-cell sequencing; acute lymphoblastic leukemia; dormant tumor cells; minimal residual disease (MRD); patient-derived xenograft (PDX) cells; primary patients' ALL MRD cells; treatment resistance.


Figures

None
Graphical abstract
Figure 1
Figure 1
CFSE Staining Allows Reliable Monitoring of PDX ALL Growth in Mice (A) Experimental procedure of generating PDX ALL cells expressing several transgenes, staining with CFSE, and enriching rare transgenic, CFSE-stained PDX cells from mouse bone marrow. (B) Of each PDX sample, 107 triple transgenic PDX cells were injected intravenously into mice and re-isolated from the bone marrow 3 days later; each dot represents data from one mouse, except that a mean of eight mice plus SE is shown for samples ALL-199 and ALL-265. (C) 107 CFSE-stained PDX cells/mouse were injected and PDX cells were quantified in up to 11 mice per time point; shown is mean and SE. (D) Gating strategy defining LRC, non-LRC, and others. MFI of CFSE at the start of the experiment (3 days after cell injection) was divided by factor 2 to model bisections; upon no more than three bisections, cells were considered as LRC, upon more than seven bisections as non-LRC; intermediate cells were considered as others. (E) Similar experiment as in (C), except that the donor mouse was fed with BrdU in the last 7 days before cell harvesting. Each dot represents data from one mouse. See also Figure S1, Tables S1, and Table S2.
Figure 2
Figure 2
A Rare, Long-Term Dormant Subpopulation Exists in ALL PDX Cells (A) 107 CFSE-stained PDX ALL-265 cells were injected into each of six mice; bioluminescence in vivo imaging was performed prior to quantifying LRC in one mouse per time point; LRC numbers are indicated and summarized in the line graph as a mean of up to ten mice ± SE. (B) Identification of LRC in PDX cells from all different ALL patients. Experiments were performed as in (A). See also Figure S2.
Figure 3
Figure 3
LRC Localize to the Endosteum, but Are Not Enriched for Stem Cells (A) Immunohistochemistry of consecutive mouse bone marrow femur sections 10 days after injection of CFSE-stained PDX ALL-265 cells; mCherry (red; left panel) indicates all PDX cells, CFSE (green; right panel) indicates LRC. (B) All sections from day 10 were quantified defining the endosteal region as less than 100 μm from bone matrix; shown is the median with upper/lower quartile and maximum/minimum of two to three sections from two femurs in two mice per data point; ∗∗∗p < 0.001, ∗∗∗∗p < 0.0001 by two-tailed unpaired t test. (C) Kinetic for ALL-265 as mean ± SE; ∗∗∗p < 0.01 by two-tailed unpaired t test. (D) Ten LRC or non-LRC were injected into each of 39 mice and engraftment was determined by in vivo imaging at day 75; each dot represents one mouse; dashed line represents detection threshold (5 × 105 photons s−1); ns: not significant as determined by two-tailed unpaired t test. See also Figure S3 and Table S3.
Figure 4
Figure 4
LRC Survive Systemic Drug Treatment In Vivo (A) Each mouse was injected with 107 CFSE-stained ALL-265 PDX cells and treated with buffer, etoposide (ETO, 50 mg/kg, intraperitoneally [i.p.]), or cyclophosphamide (Cyclo, 150 mg/kg, i.p.) on day 7. Mice were euthanized on day 10; LRC were analyzed and re-transplanted into secondary recipients. (B) Living PDX cells from mice in (A) were quantified and presented as mean of each group (n = 4–5) ± SE. (C) Original data for one representative mouse per treatment. (D) Mean of all four to five mice per treatment, depicted as relative drug effect on LRC compared with non-LRC (100%) ± SE; ∗∗∗∗p < 0.0001 by two-tailed unpaired t test. (E) Mean relative proportion of LRC of total PDX cells. (F) LRC isolated were re-transplanted and mice monitored by in vivo imaging; mean of each group (n = 1–2) ± SE. See also Figure S4.
Figure 5
Figure 5
Expression Profile of LRC Shows Distinct Changes to Non-LRC (A) Fifteen days after transplantation, ALL-265 LRC or non-LRC were isolated and single-cell mRNA-seq was performed in 15 LRC and 35 non-LRC. (B) Hierarchical clustering and gene expression heatmap across the 500 most differentially expressed genes (false discovery rate [FDR] <0.01) in 15 LRC and 35 non-LRC single cells. Values are plotted relative to the average of non-LRC. (C) Principal component analysis of the 500 most variable genes in all 50 single cells. (D) Significantly enriched KEGG pathways (FDR <0.05) as determined by fixed network enrichment analysis (FNEA); bars show the number of significantly up- or downregulated genes in the corresponding pathway and are ordered according to the enrichment score (ES). (E) LRC signature genes (FDR < 0.05 and log2 fold-change >1) were derived from integrated bulk and single-cell RNA-seq analysis from six animals carrying either ALL-265 or ALL-199 and are shown ranked by fold-change and colored by significance. See also Figure S5, Tables S4, S5, and S6.
Figure 6
Figure 6
LRC Resemble MRD Cells in the PDX Mouse Model (A) 107 ALL-199 cells were injected into 19 mice; when 30% of bone marrow cells were human, PDX cells were enriched from five mice and used as untreated control samples; cells of one mouse were subjected to single-cell sequencing; the remaining mice received buffer, vincristine (VCR, 0.25 mg/kg; n = 5), cyclophosphamide (Cyclo, 100 mg/kg; n = 3), or a combination thereof (VCR + Cyclo; n = 6) weekly for 2 weeks; when VCR + Cyclo combination treatment had reduced tumor burden to MRD (<1% human cells in bone marrow), PDX cells were enriched and cells of one VCR + Cyclo mouse were subjected to single cell mRNA-seq. (B) In vivo imaging data of three representative mice per group. (C) Mean of each group ± SE; p < 0.05, ∗∗∗p < 0.001 by two-tailed unpaired t test; mice receiving buffer had to be euthanized after 1 week of treatment due to end-stage leukemia. (D) Percentage of PDX ALL cells in mouse bone marrow as determined by flow cytometry postmortem as mean ± SE; ∗∗p < 0.01, ∗∗∗p < 0.001, ∗∗∗∗p < 0.0001 by two-tailed unpaired t test. (E) MRD cells show reduced expression of MYC- and E2F-target genes in gene set enrichment analysis (GSEA) (Liberzon et al., 2015). (F) GSEA was performed comparing LRC signature with transcriptomes of MRD versus untreated cells (mean of data for ALL-199; left panel). Scatterplot of fold-changes for genes differentially expressed (FDR < 0.05) between both LRC versus non-LRC and MRD versus untreated control cells; grey area indicates LRC signature (right panel). See also Figure S6.
Figure 7
Figure 7
LRC Resemble Primary MRD Cells from Patients (A) Adult or pediatric ALL patients were treated according to GMALL-0703 or BFM-2009 protocols for 71 or 33 days, respectively; at MRD, the subgroup of StemB cells (in samples from adults) or all remaining ALL cells (in samples from children) were enriched out of normal bone marrow; cells at diagnosis and at MRD were subjected to RNA-seq. (B) K-means clustering of gene expression values of 167 highly differentially expressed genes (FDR < 0.001) of all data from single cells. (C) Principal-component analysis (PCA) of single cell transcriptomes using all shared expressed genes; each symbol indicates a single cell. (D) GSEA comparing the LRC signature with signatures of leukemia stem cells (Saito et al., 2010) and dormant CD34-positive chronic myeloid leukemia (CML) (Graham et al., 2007). (E) All genes differentially expressed (padj < 0.05) between primary samples from five children before onset of treatment to three matched MRD samples 33 days after onset of treatment. (F) Scatterplot of fold-changes for genes differentially expressed between both LRC versus non-LRC and primary MRD versus primary diagnostic cells, grey area indicates LRC signature (left panel); GSEA comparing the LRC signature with differentially expressed genes between primary MRD and primary diagnostic cells (right panel). (G) PCA of bulk samples transcriptomes using all shared expressed genes; each symbol indicates a single sample. See also Figure S7, Tables S7, and S8.
Figure 8
Figure 8
Release from the Environment Induces Proliferation in LRC and Sensitizes LRC and MRD Cells toward Drug Treatment (A) From a first recipient mouse carrying CFSE-stained ALL-199 cells, LRC, non-LRC, and bulk cells were obtained at day 10; bulk cells and non-LRC were re-labeled with CFSE, re-transplanted in second recipient mice at high numbers, and re-analyzed at day 10 using flow cytometry; bulk cells, LRC, and non-LRC were re-transplanted at low numbers into groups of mice and leukemia growth was monitored over time. (B) CFSE staining at day 10 in secondary recipient mice receiving high cell numbers. (C) Growth curve in secondary recipients; mean ± SE; ns, no statistical significance by Kruskal-Wallis test and Dunn's multiple comparison test. One out of two independent experiments is shown. (D) Fourteen days after transplantation, LRC or non-LRC were isolated and 500–800 cells treated ex vivo for 48 hr with daunorubicin (DAU; 250 nM), mitoxantrone (MITO; 675 nM), amsacrine (AMSA; 18 nM), or etoposide (ETO; 300 nM). Spontaneous cell death in the absence of cytotoxic drugs was 60%; a mean of eight data points from three independent experiments in triplicates or duplicates is shown for DAU and MITO and one experiment in triplicates is shown for AMSA and ETO. Four thousand untreated cells and MRD cells were treated ex vivo for 48 hr with 15 μM ETO, 450 μM MITO, 300 nM VCR, or 500 nM DOX. Cell death was measured by flow cytometry; spontaneous cell death in the absence of cytotoxic drugs was 33%; shown is one experiment in triplicate; mean ± SE; ns, not significant, ∗∗∗p < 0.001 by two-tailed unpaired t test. (E) Summary of ALL-265 data from Figure 4C (n = 5), S6 (n = 3), and 8D (n = 3); ns, not significant, p < 0.05 and ∗∗∗∗p < 0.0001 by two-tailed unpaired t test.

Comment in

Similar articles

Cited by

References

    1. Bacher U., Kohlmann A., Haferlach T. Gene expression profiling for diagnosis and therapy in acute leukaemia and other haematologic malignancies. Cancer Treat Rev. 2010;36:637–646. - PubMed
    1. Blatter S., Rottenberg S. Minimal residual disease in cancer therapy – small things make all the difference. Drug Resist Updat. 2015;21-22:1–10. - PubMed
    1. Bonnet D., Dick J.E. Human acute myeloid leukemia is organized as a hierarchy that originates from a primitive hematopoietic cell. Nat. Med. 1997;3:730–737. - PubMed
    1. Castro Alves C., Terziyska N., Grunert M., Gündisch S., Graubner U., Quintanilla-Martinez L., Jeremias I. Leukemia-initiating cells of patient-derived acute lymphoblastic leukemia xenografts are sensitive toward TRAIL. Blood. 2012;119:4224–4227. - PubMed
    1. Clevers H. The cancer stem cell: premises, promises and challenges. Nat. Med. 2011;17:313–319. - PubMed

MeSH terms

Substances