. 2017 Aug;42(9):1850-1859.
doi: 10.1038/npp.2016.270. Epub 2016 Dec 5.

High-Frequency Stimulation of the Subthalamic Nucleus Blocks Compulsive-Like Re-Escalation of Heroin Taking in Rats

Affiliations

High-Frequency Stimulation of the Subthalamic Nucleus Blocks Compulsive-Like Re-Escalation of Heroin Taking in Rats

Carrie L Wade et al. Neuropsychopharmacology. 2017 Aug.

Abstract

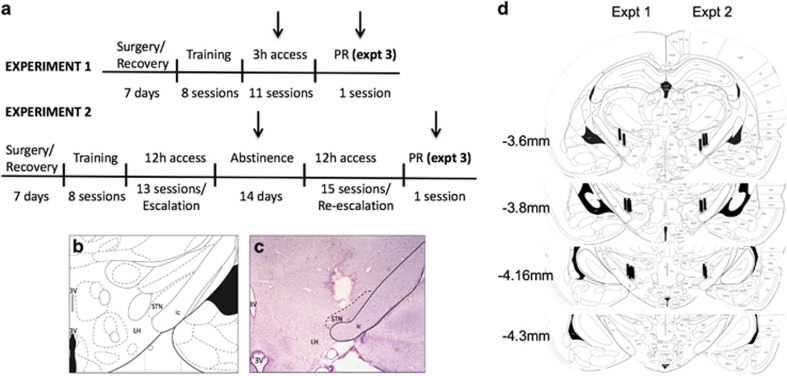
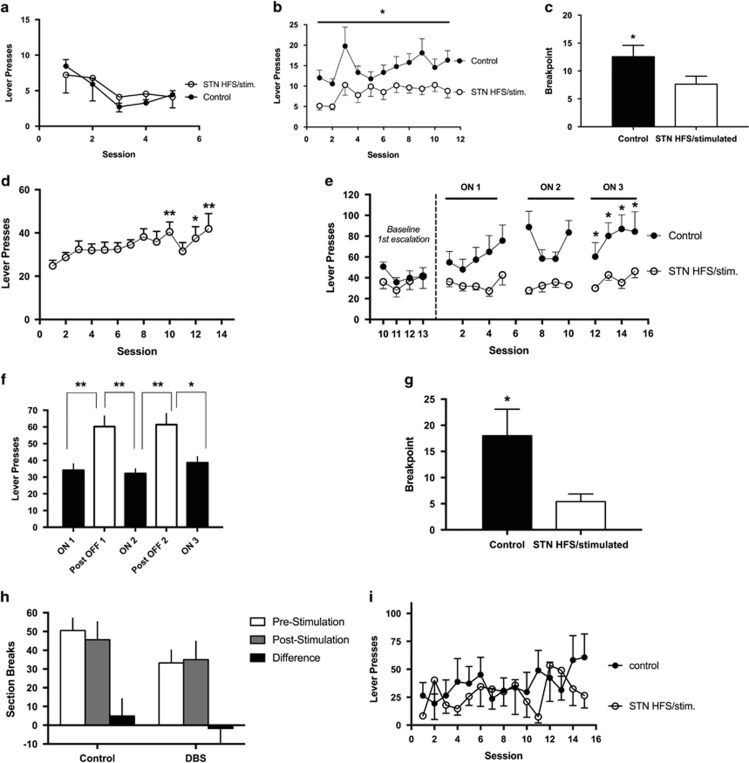
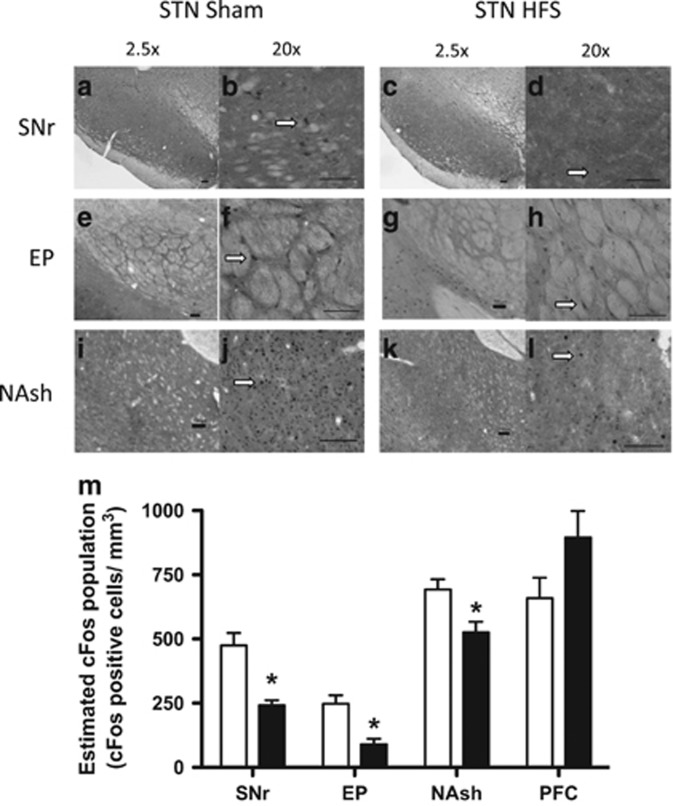
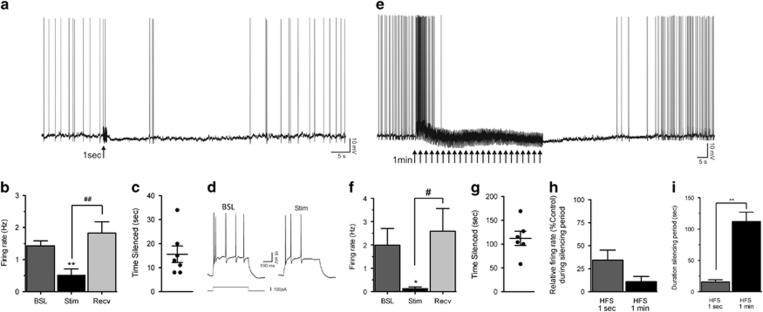
Opioid addiction, including addiction to heroin, has markedly increased in the past decade. The cost and pervasiveness of heroin addiction, including resistance to recovery from addiction, provide a compelling basis for developing novel therapeutic strategies. Deep brain stimulation may represent a viable alternative strategy for the treatment of intractable heroin addiction, particularly in individuals who are resistant to traditional therapies. Here we provide preclinical evidence of the therapeutic potential of high-frequency stimulation of the subthalamic nucleus (STN HFS) for heroin addiction. STN HFS prevented the re-escalation of heroin intake after abstinence in rats with extended access to heroin, an animal model of compulsive heroin taking. STN HFS inhibited key brain regions, including the substantia nigra, entopeduncular nucleus, and nucleus accumbens shell measured using brain mapping analyses of immediate-early gene expression and produced a robust silencing of STN neurons as measured using whole-cell recording ex vivo. These results warrant further investigation to examine the therapeutic effects that STN HFS may have on relapse in humans with heroin addiction.


Figures

Figure 1
Figure 1
Experimental design. (a) Experimental timeline for Experiments (Expt) 1–3. Arrows indicate periods of STN HFS. Note that control animals were implanted with stimulating electrodes but were not stimulated to control for the effect of the surgery. (b) Brain atlas. (c) Representative image of the tip of the electrode using Cresyl violet staining. (d) Location of electrodes in Experiment 1 (left) and Experiment 2 (right). ic, internal capsule; LH, lateral hypothalamus; STN, subthalamic nucleus; 3V, third ventricle.
Figure 2
Figure 2
Heroin self-administration. Heroin self-administration during short-access sessions (Experiment 1) is represented in panels a–c. (a) Training. Number of heroin infusions in 1 h training sessions (no stimulation) between subthalamic nucleus (STN) (black circles) and control animals (white circles). (b) Short access. Number of heroin infusions in 3-h sessions in animals that received high-frequency stimulation (HFS) of the STN (black circles) and control animals (white circles). *p<0.05, significant group effect. (c) Progressive ratio. Breakpoint reached after 3 h session in animals that received HFS in the STN (black bar) and control animals (white bar). *p<0.05, significant difference compared with control group. Heroin self-administration during long-access sessions (Experiment 2) is represented in panels d–g. (d) Initial escalation of heroin self-administration during fourteen 10-h sessions. Heroin self-administration is shown as average lever presses for all animals. *p<0.05, **p<0.01, significant difference compared with first day of long access. (e) Re-escalation during fifteen 10-h sessions in the stimulated (stim.) STN HFS and control groups. Sessions 5 and 10 were followed by a 2-day break from both stimulation and heroin access before the start of the subsequent session. *p<0.05, significant difference compared with control group. (f) Effects on heroin consumption following 2-day breaks from stimulation in the STN HFS group. Phases 1–3 (black bars) show heroin self-administration during stimulation periods. ON-1, average heroin self-administration for sessions 1–5; ON-2, average heroin self-administration for sessions 7–10; ON-3, average heroin self-administration for sessions 12–15. White bars indicate the days of non-stimulation. *p<0.05, **p<0.001, significant differences compared with OFF days. (g) Progressive ratio shown as breakpoints reached after 6 h session in animals in the control group (white bar) and STN HFS group (black bar). *p<0.05, significant difference compared with control group. Motor effects from STN HFS in control and stimulated animals are represented in panels h and i. (h) Animals were assessed for differences in locomotor activity by observing section breaks in their operant boxes before and during stimulation. (i) Lever pressing on the inactive lever during the self-administration sessions were recorded and compared between groups. Error bars indicate SEM. DBS, deep brain stimulation.
Figure 3
Figure 3
Fos expression in control and stimulated animals. The brain areas that were examined were the substantia nigra pars reticulate (SNr) (a–d), entopeduncular nucleus (EP) (e–h), and nucleus accumbens shell (NAsh) (i–l). Left panels for each structure show images that were taken from control rats, and right panels show images that were taken from stimulated rats. Orientation is noted at 2.5 × magnification (left panels), and cell counts were taken at 20 × magnification (right panels). Arrows highlight a typical Fos-positive neuron for each section. Scale bars=100 μm. (m) The quantification of Fos expression in each structure is illustrated for control rats (empty bars) and subthalamic nucleus high-frequency stimulation (STN HFS) rats (black bars) and was calculated using IPLab 3.9.4 r5 software for Macintosh (Scanalytics) and iVision 4.0.15 software for Macintosh (BioVision). *p<0.05, significant effect compared with control group. Error bars indicate SEM. PFC, prefrontal cortex.
Figure 4
Figure 4
Subthalamic nucleus (STN) activity following high-frequency stimulation (HFS). STN activity following a 1-s stimulation is represented in (a–d). (a) Continuous intracellular recording of a STN neuron in current-clamp mode. Tonic firing was depressed following a 1-s HFS (arrow), and the silencing period lasted 34 s until recovery to pre-HFS level. (b) On average, the action potential (AP) firing was significantly decreased from 1.43 to 0.52 Hz, with recovery to 1.52 Hz (n=7). **p<0.01 indicates significant effect of stimulation compared with baseline. ##p<0.01 shows significant effect of recovery compared with stimulation. Error bars indicate SEM. (c) Following delivery of a 1-s HFS, the silencing period lasted 16 s (n=7). (d) In another neuron, injection of a depolarizing current step before HFS (Control) triggered five APs, and the same current step delivered at the same holding potential during the silencing period (Stim) triggered only three APs. STN activity following a 1-min stimulation is represented in (e–i). (e) Continuous recording of a STN neuron. Delivery of a 1-min HFS (multiple arrows) first increased tonic firing for a few seconds and then markedly inhibited neuronal activity for 105 s until recovery to pre-HFS level. (f) On average, the AP firing was significantly decreased from 1.99 to 0.13 Hz, with recovery to 2.59 Hz (n=6). *p<0.05 indicates significant effect of stimulation compared with baseline. #p<0.05 shows significant effect of recovery compared with stimulation. Error bars indicate SEM. (g) Upon delivery of a 1-min HFS, the silencing period lasted 112 s (n=6). (h) The depressing effect of HFS on neuronal activity was more pronounced with a 1-min duration (89% decrease) compared with 1-s (66% decrease). (i) The duration of the silencing period was significantly longer with a 1-min HFS compared with a 1-s HFS. **p<0.01 indicates significant effect of 1-min stimulation compared with 1-s stimulation. Error bars indicate SEM. BSL, baseline; Recv, recovery; Stim, stimulations.

References

    1. Ardouin C, Voon V, Worbe Y, Abouazar N, Czernecki V, Hosseini H et al (2006). Pathological gambling in Parkinson's disease improves on chronic subthalamic nucleus stimulation. Movement Disord 21: 1941–1946. - PubMed
    1. Barbier E, Vendruscolo LF, Schlosburg JE, Edwards S, Juergens N, Park PE et al (2013). The NK1 receptor antagonist L822429 reduces heroin reinforcement. Neuropsychopharmacology 38: 976–984. - PMC - PubMed
    1. Baunez C, Dias C, Cador M, Amalric M (2005). The subthalamic nucleus exerts opposite control on cocaine and 'natural' rewards. Nat Neurosci 8: 484–489. - PubMed
    1. Benazzouz A, Piallat B, Pollak P, Benabid AL (1995). Responses of substantia nigra pars reticulata and globus pallidus complex to high frequency stimulation of the subthalamic nucleus in rats: electrophysiological data. Neurosci Lett 189: 77–80. - PubMed
    1. Beurrier C, Bioulac B, Audin J, Hammond C (2001). High-frequency stimulation produces a transient blockade of voltage-gated currents in subthalamic neurons. J Neurophysiol 85: 1351–1356. - PubMed

MeSH terms