. 2016 Dec 5:6:38187.
doi: 10.1038/srep38187.

Soluble Amyloid-beta Aggregates from Human Alzheimer's Disease Brains

Affiliations

Soluble Amyloid-beta Aggregates from Human Alzheimer's Disease Brains

Thomas J Esparza et al. Sci Rep. .

Abstract

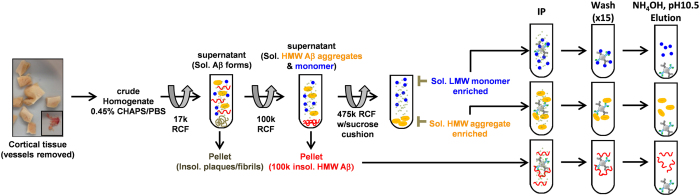
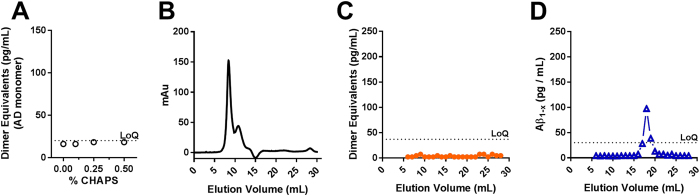
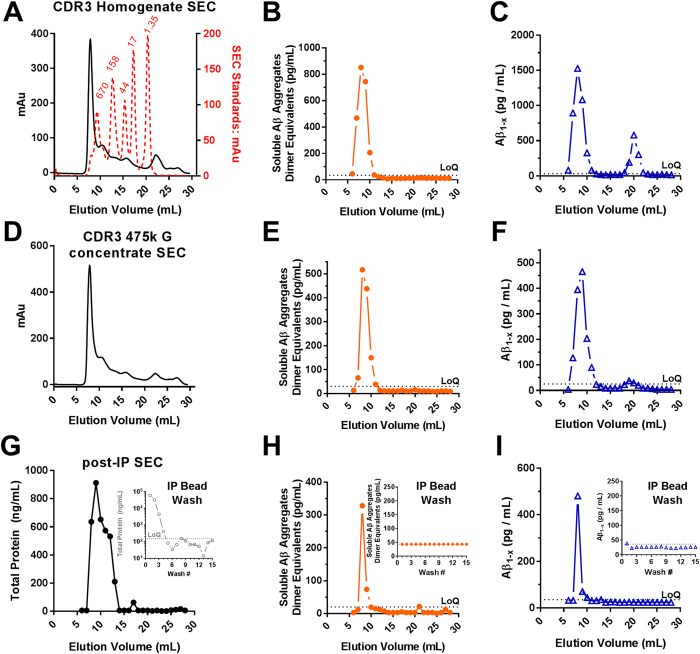
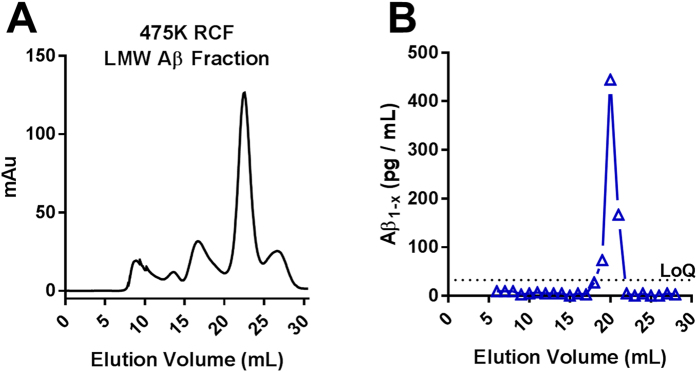
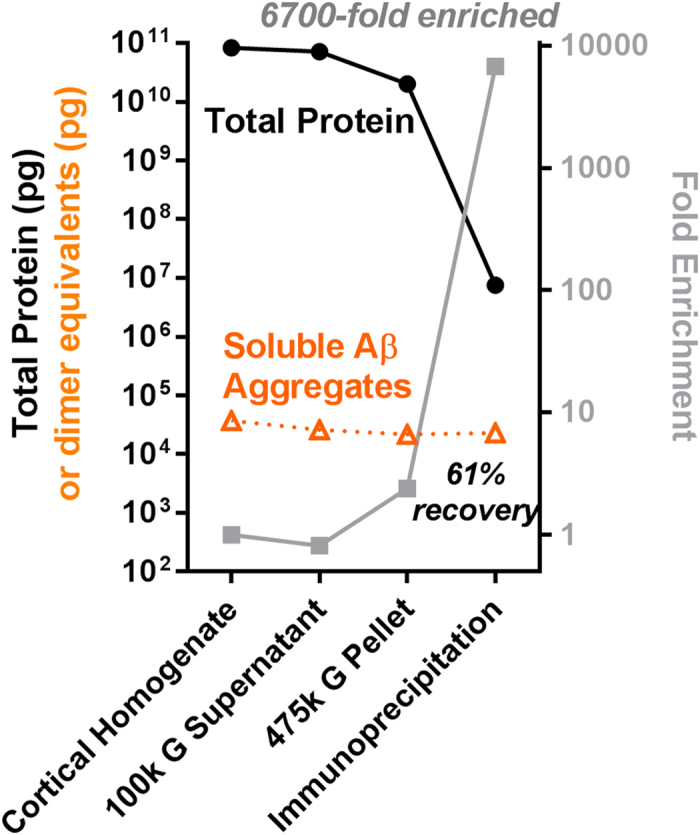
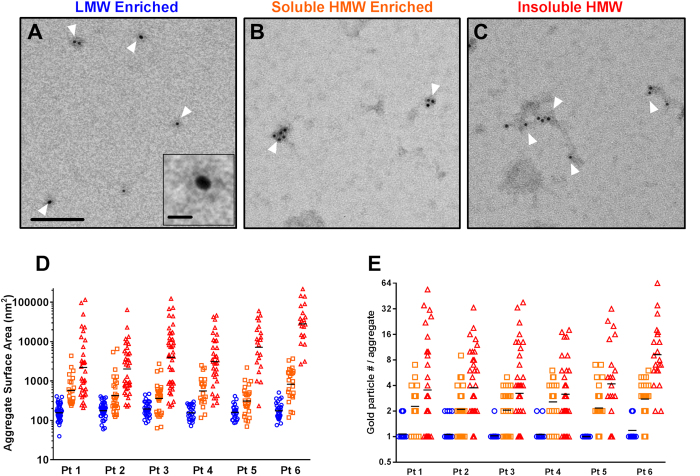
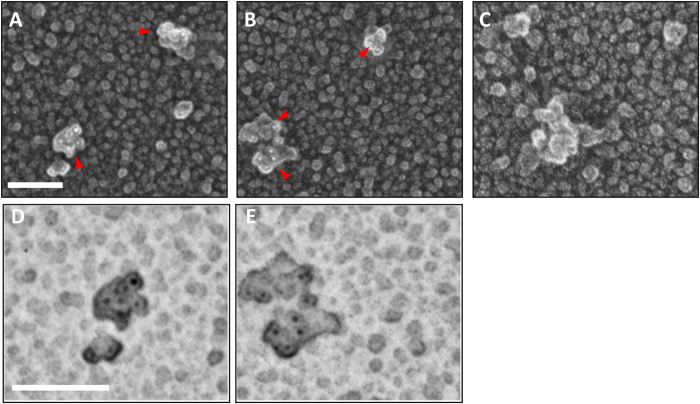
Soluble amyloid-beta (Aβ) aggregates likely contribute substantially to the dementia that characterizes Alzheimer's disease. However, despite intensive study of in vitro preparations and animal models, little is known about the characteristics of soluble Aβ aggregates in the human Alzheimer's disease brain. Here we present a new method for extracting soluble Aβ aggregates from human brains, separating them from insoluble aggregates and Aβ monomers using differential ultracentrifugation, and purifying them >6000 fold by dual antibody immunoprecipitation. The method resulted in <40% loss of starting material, no detectible ex vivo aggregation of monomeric Aβ, and no apparent ex vivo alterations in soluble aggregate sizes. By immunoelectron microscopy, soluble Aβ aggregates typically appear as clusters of 10-20 nanometer diameter ovoid structures with 2-3 amino-terminal Aβ antibody binding sites, distinct from previously characterized structures. This approach may facilitate investigation into the characteristics of native soluble Aβ aggregates, and deepen our understanding of Alzheimer's dementia.


Conflict of interest statement

The authors declare no competing financial interests.

Figures

Figure 1
Figure 1. Method for isolating and purifying soluble Aβ aggregates from human AD brain.
Cortical tissue was dounce homogenized in sub-critical micelle concentration of the detergent CHAPS, size forms of Aβ were isolated by differential ultracentrifugation, then Aβ was purified by dual antibody immunoprecipitation and elution in ammonium hydroxide. RCF: relative centrifugal force. Sol.: soluble, LMW: low molecular weight, HMW: high molecular weight. IP: immunoprecipitation.
Figure 2
Figure 2. Sub-critical micelle concentration of CHAPS in PBS does not induce ex vivo aggregation of human AD brain derived Aβ monomers.
(A) Titration of CHAPS during homogenization of normal control cortical tissue spiked with 2 ng/mL human AD brain-derived Aβ monomer. No induction of detectible Aβ aggregates. (BD). Size exclusion chromatography of the 475,000× g RCF sucrose cushion fraction from normal control cortical tissue spiked with 2 ng/mL AD brain-derived Aβ monomer. (B) Total protein, (C) Soluble Aβ aggregate assay indicating no detectible Aβ aggregates, (D) Aβ1−x assay indicating <10% of spiked monomer present in sucrose cushion (high molecular weight enriched) portion of the preparation. LoQ: limit of quantitation.
Figure 3
Figure 3. Enrichment and preservation of soluble high molecular weight Aβ aggregates from human AD brain following differential centrifugation and immunoprecipitation.
(A) Size exclusion chromatography (SEC) total protein profile (measured by absorption) of a CDR3 tissue homogenate prepared in 1xPBS containing 0.45% CHAPS; overlay with Bio-Rad gel filtration standards (red) with molecular weight in kDa indicated (red text). (B,C). Soluble Aβ aggregate and Aβ1−x assays on SEC fractions of original lysates. LoQ: limit of quantitation. (D) SEC total protein profile of the sucrose cushion fraction after ultracentrifugation at 475,000× g. (E,F) Soluble Aβ aggregate and Aβ1−x assays on SEC fractions of sucrose cushion fraction after ultracentrifugation at 475,000× g, demonstrating the preservation of soluble Aβ aggregates and separation from monomers. (G) SEC total protein profile (measured by NanoOrange) of the 475,000× g sucrose cushion fraction followed by immunoprecipitation (IP), washing, and elution with ammonium hydroxide. (H,I) Soluble Aβ aggregate and Aβ1−x assays on eluted high molecular weight soluble Aβ aggregates. Insets: Quantification of protein (note log scale in panel G), soluble Aβ aggregates, and Aβ1−x in the immunoprecipitation bead washes.
Figure 4
Figure 4. Aβ monomer is the predominant size form of Aβ from human AD brain in the top layer after 475,000× g ultracentrifugation.
(A) SEC total protein profile from 1 mL of the top 5 mL supernatant layer removed following ultracentrifugation at 475,000× g. (B) Aβ1−x assay on the same supernatant SEC fractions.
Figure 5
Figure 5. “Quantitative bookkeeping”.
Total protein and soluble Aβ aggregate assays (note log scale) performed on each step of the isolation and purification of soluble Aβ aggregates from human AD brain.
Figure 6
Figure 6. Immunoelectron microscopic analysis of soluble Aβ aggregates from human AD brain in comparison to low molecular weight Aβ and insoluble aggregates.
Labeling was performed using the anti-Aβ antibody HJ3.4 followed by anti-mouse secondary conjugated to 6 nm diameter gold beads. (A) Exemplar immunoelectron microscopic images of low molecular weight (LMW) Aβ immunoprecipitated from the 475,000× g supernatant. White arrows indicate individually resolved objects with typically 1 but occasionally 2 gold beads. Scale bar = 100 nm. Inset shows a single 6 nm gold bead, with scale bar 10 nm. (B) Exemplar immunoelectron microscopic images of soluble high molecular weight (HMW) Aβ aggregates immunoprecipitated from the sucrose cushion after 475,000× g ultracentrifugation. Arrows indicate compact aggregates with multiple gold beads. (C) Exemplar immunoelectron microscopic images of insoluble high molecular weight Aβ aggregates immunoprecipitated from the pellet after 100,000× g ultracentrifugation. Arrows indicate elongated and irregular aggregates with multiple gold beads per aggregate. (D) Surface area measurements (in nm2, note log scale) of the gold labeled objects in the three fractions: LMW (blue circles), soluble HMW (orange squares), and insoluble (red triangles). Preparations were made from 6 AD patients; 10 random fields per patient were analyzed in an automated fashion. (E). Number of gold particles per aggregate were counted in an automated fashion from the same images.
Figure 7
Figure 7. Quick-freeze deep etch negative replica immunoelectron microscopic images of soluble Aβ aggregates from human AD brain.
(A,B) Exemplar images of soluble high molecular weight Aβ aggregates immunoprecipitated from the sucrose cushion after 475,000× g ultracentrifugation spotted onto glass and stained with N-terminal Aβ antibody HJ3.4 followed by anti-mouse secondary conjugated to 6 nm diameter gold beads. Replicas were produced by platinum deposition and mounted for imaging. Red arrows indicate aggregates with multiple gold bead (white) labeling. Scale bars 100 nm: (C) Images with no primary antibody indicating absence of nonspecific binding of gold-labeled secondary antibody. (D,E) Expanded view of aggregates from panels A and B with contrast inverted to make the gold bead labels (black) more apparent.
Figure 8
Figure 8. Mass spectrometry of soluble Aβ aggregates from human AD brain.
(A) Liquid chromatography-tandem mass spectrometry (LC-MS/MS) spectrum for undigested, full-length Aβ1-40. Each peak represents an ion fragmented from Aβ1-40, with peaks labeled ‘b’ representing N-terminal fragment ions and peaks labeled ‘y’ representing C-terminal fragment ions. The numbers indicate measured mass/charge ratio (m/z). The single letter amino acid code across the top indicates the de novo sequence identified by mass spectrometry, which matches the amyloid precursor protein sequence corresponding to Aβ1-40. The line breaks between amino acids indicate a cleavage of the amide bond between two adjacent amino acids producing fragment ions. The lines below each amino acid indicate a detected ‘b’ ion, and lines above indicate a detected ‘y’ ion. Inset: isotopic envelope for the +5 charged, full-length Aβ1-40: the peaks are spaced 0.2 daltons apart at z = +5 because the naturally occurring isotopes (e.g. 13C and 15N) differ by 1 dalton. For the +5 ion, the observed m/z was 866.4351 (theoretical m/z = 866.4370), which was −2.1 parts per million (ppm) error from the theoretical mass of Aβ1-40. (B) Spectrum for full length Aβ1-42. For the +5 ion, the observed m/z was 903.2623 (theoretical m/z = 903.2612), which was 1.2 ppm error from the theoretical mass of Aβ1-42.

References

    1. Hardy J. et al. Pathways to Alzheimer’s disease. Journal of internal medicine 275, 296–303, doi: 10.1111/joim.12192 (2014). - DOI - PubMed
    1. Hardy J. A. & Higgins G. A. Alzheimer’s disease: the amyloid cascade hypothesis. Science 256, 184–185 (1992). - PubMed
    1. Katzman R. et al. Clinical, pathological, and neurochemical changes in dementia: a subgroup with preserved mental status and numerous neocortical plaques. Annals of neurology 23, 138–144 (1988). - PubMed
    1. Hulette C. M. et al. Neuropathological and neuropsychological changes in “normal” aging: evidence for preclinical Alzheimer disease in cognitively normal individuals. Journal of neuropathology and experimental neurology 57, 1168–1174 (1998). - PubMed
    1. Price J. L. & Morris J. C. Tangles and plaques in nondemented aging and “preclinical” Alzheimer’s disease. Annals of neurology 45, 358–368 (1999). - PubMed

Publication types

Substances