

RESPECT-ED: Rates of Pulmonary Emboli (PE) and Sub-Segmental PE with Modern Computed Tomographic Pulmonary Angiograms in Emergency Departments: A Multi-Center Observational Study Finds Significant Yield Variation, Uncorrelated with Use or Small PE Rates
- PMID: 27918576
- PMCID: PMC5137866
- DOI: 10.1371/journal.pone.0166483
RESPECT-ED: Rates of Pulmonary Emboli (PE) and Sub-Segmental PE with Modern Computed Tomographic Pulmonary Angiograms in Emergency Departments: A Multi-Center Observational Study Finds Significant Yield Variation, Uncorrelated with Use or Small PE Rates
Erratum in
-
Correction: RESPECT-ED: Rates of Pulmonary Emboli (PE) and Sub-Segmental PE with Modern Computed Tomographic Pulmonary Angiograms in Emergency Departments: A Multi-Center Observational Study Finds Significant Yield Variation, Uncorrelated with Use or Small PE Rates.PLoS One. 2017 Aug 29;12(8):e0184219. doi: 10.1371/journal.pone.0184219. eCollection 2017. PLoS One. 2017. PMID: 28850591 Free PMC article.
Abstract
Introduction: Overuse of CT Pulmonary Angiograms (CTPA) for diagnosing pulmonary embolism (PE), particularly in Emergency Departments (ED), is considered problematic. Marked variations in positive CTPA rates are reported, with American 4-10% yields driving most concerns. Higher resolution CTPA may increase sub-segmental PE (SSPE) diagnoses, which may be up to 40% false positive. Excessive use and false positives could increase harm vs. benefit. These issues have not been systematically examined outside America.
Aims: To describe current yield variation and CTPA utilisation in Australasian ED, exploring potential factors correlated with variation.
Methods: A retrospective multi-centre review of consecutive ED-ordered CTPA using standard radiology reports. ED CTPA report data were inputted onto preformatted data-sheets. The primary outcome was site level yield, analysed both intra-site and against a nominated 15.3% yield. Factors potentially associated with yield were assessed for correlation.
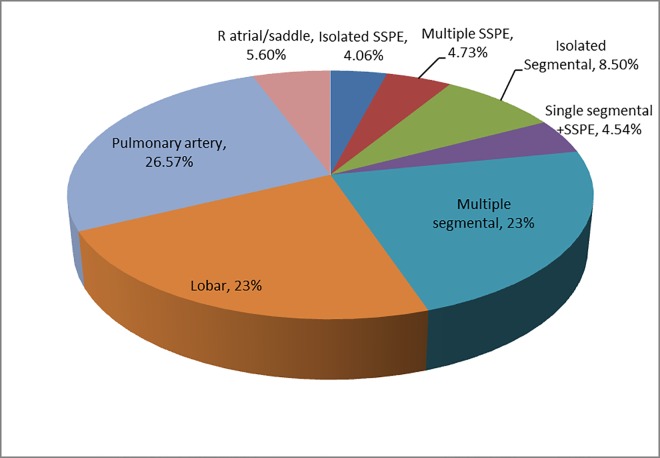
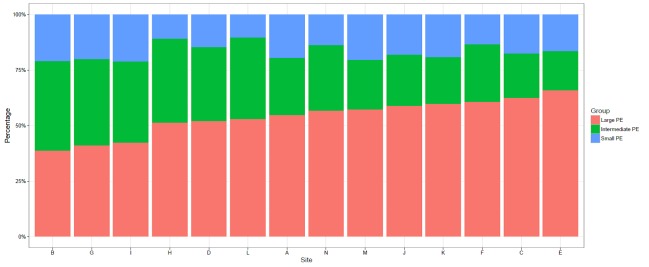
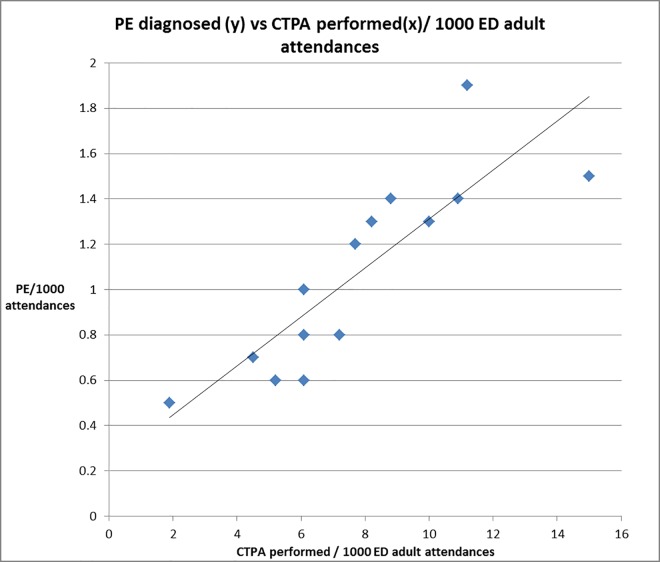
Results: Fourteen radiology departments (15 ED) provided 7077 CTPA data (94% ≥64-slice CT); PE were reported in 1028 (yield 14.6% (95%CI 13.8-15.4%; range 9.3-25.3%; site variation p <0.0001) with four sites significantly below and one above the 15.3% target. Admissions, CTPA usage, PE diagnosis rates and size of PE were uncorrelated with yield. Large PE (≥lobar) were 55% (CI: 52.1-58.2%) and SSPE 8.8% (CI: 7.1-10.5%) of positive scans. CTPA usage (0.2-1.5% adult attendances) was correlated (p<0.006) with PE diagnosis but not SSPE: large PE proportions.
Discussion/ conclusions: We found significant intra-site CTPA yield variation within Australasia. Yield was not clearly correlated with CTPA usage or increased small PE rates. Both SSPE and large PE rates were similar to higher yield historical cohorts. CTPA use was considerably below USA 2.5-3% rates. Higher CTPA utilisation was positively correlated with PE diagnoses, but without evidence of increased proportions of small PE. This suggests that increased diagnoses seem to be of clinically relevant sized PE.
Conflict of interest statement
The authors have read the journal's policy and the authors of this manuscript have the following competing interests: David Mountain has provided paid expert witness opinions and testimony about diagnosis of pulmonary embolism for the Medical Board of Western Australia and the Western Australian coroner.
Figures
References
-
- Segard T, Macdonald WBG. Changing trends in venous thromboembolism-related imaging in Western Australian teaching hospitals, 2002–2010. Med J Aust [Internet]. 2013. [cited 2015 Dec 18];198(2). Available from: https://www.mja.com.au/journal/2013/198/2/changing-trends-venous-thrombo... - PubMed
Publication types
MeSH terms
LinkOut - more resources
Full Text Sources
Other Literature Sources
Medical
